Transcription
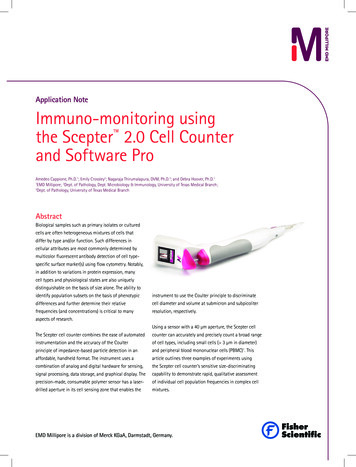
Application NoteImmuno-monitoring usingthe Scepter 2.0 Cell Counterand Software ProAmedeo Cappione, Ph.D.1; Emily Crossley2; Nagaraja Thirumalapura, DVM, Ph.D.3; and Debra Hoover, Ph.D.1EMD Millipore; 2Dept. of Pathology, Dept. Microbiology & Immunology, University of Texas Medical Branch;3Dept. of Pathology, University of Texas Medical Branch1AbstractBiological samples such as primary isolates or culturedcells are often heterogeneous mixtures of cells thatdiffer by type and/or function. Such differences incellular attributes are most commonly determined bymulticolor fluorescent antibody detection of cell typespecific surface marker(s) using flow cytometry. Notably,in addition to variations in protein expression, manycell types and physiological states are also uniquelydistinguishable on the basis of size alone. The ability toidentify population subsets on the basis of phenotypicinstrument to use the Coulter principle to discriminatedifferences and further determine their relativecell diameter and volume at submicron and subpicoliterfrequencies (and concentrations) is critical to manyresolution, respectively.aspects of research.Using a sensor with a 40 µm aperture, the Scepter cellThe Scepter cell counter combines the ease of automatedcounter can accurately and precisely count a broad rangeinstrumentation and the accuracy of the Coulterof cell types, including small cells ( 3 µm in diameter)principle of impedance-based particle detection in anand peripheral blood mononuclear cells (PBMC)1. Thisaffordable, handheld format. The instrument uses aarticle outlines three examples of experiments usingcombination of analog and digital hardware for sensing,the Scepter cell counter’s sensitive size-discriminatingsignal processing, data storage, and graphical display. Thecapability to demonstrate rapid, qualitative assessmentprecision-made, consumable polymer sensor has a laser-of individual cell population frequencies in complex celldrilled aperture in its cell sensing zone that enables themixtures.EMD Millipore is a division of Merck KGaA, Darmstadt, Germany.
01Example 1: Lymphocyte vs. monocyte subsetsensing aperture. The Scepter cell counter detects eachdiscrimination in freshly isolated PBMCscell passing through the sensor’s aperture, calculates cellIntroductionconcentration, and displays a histogram as a function ofcell diameter or volume on its screen.The human immune system is comprised of cellsubsets, with distinct functional profiles, that fightScepter 2.0 software was then used to upload test filespathogens. The assessment of immune profiles of thefrom the device and perform subsequent data analysisvarious immune cell subsets, such as lymphocytes andto determine the concentrations and relative cellmonocytes, can help identify molecular signaturesfrequencies for the lymphocyte and monocyte fractions.that may facilitate research, ranging from translationalmedicine, prognostic advancements, and early decision-Guava easyCyte cell countingmaking tools in vaccine development. The Scepter10 µL of each PBMC sample was diluted in 190 µL PBS.cell counter, when used in combination with ScepterSamples were then analyzed on a guava easyCyte HTSoftware Pro, provides a tool for rapid determination ofsystem to determine the concentrations and relative celllymphocyte and monocyte concentrations as well as thefrequencies for the lymphocyte and monocyte fractions.relative frequency of these cell types in PBMC isolates.Materials and MethodsHuman blood sample prepCell viability determination usingguava ViaCount assay10 µL of each PBMC sample was mixed with 190 µLHuman PBMCs were isolated from whole heparinizedViaCount assay reagent, incubated for 5 minutes at roomblood of healthy donors by Ficoll-Paque densitytemperature (RT). Viability data were acquired on a guavacentrifugation (GE Healthcare). Briefly, 9 mL of bloodeasyCyte instrument using guava ExpressPro software.was diluted to 25 mL with phosphate-buffered saline(1X EmbryoMax PBS, EMD Millipore). and layered overCell surface staining and subset determination15 mL of Ficoll. Samples were centrifuged at 400 x g forFor each sample, 100,000 PBMCs were resuspended30 minutes with no brake, and the resulting PBMC layerin 100 µL PBS 0.1% bovine serum albumin (BSA).was recovered. The PBMC fractions were washed twiceTo distinguish the discrete cell subsets present inby centrifugation using PBS. After final spin, cell pelletsPBMC samples, they were stained with the followingwere resuspended in PBS for sufficient conductivitycombination of fluorescently labeled antibodies: CD3-PEduring Scepter cell counting.(T cells), CD19-Alexa Fluor 488 (B cells), CD16/CD56APC (NK cells), and CD14-PECy7 (monocytes) (antibodies2Scepter cell countingall from eBioscience). Singly stained samples and isotypeThe Scepter cell counter was used to count samplescontrols were included with each staining set to ensurefollowing the simple on-screen instructions for each stepproper instrument setup. Samples were incubatedof the counting process. Briefly, the user attaches aat RT for 20 minutes, washed twice with PBS, then40 µm sensor, depresses the plunger, submerges theresuspended in 200 µL PBS prior to acquisition. Samplessensor into the sample, then releases the plungerwere analyzed (3000 cells/sample well) on a guavadrawing 50 µL of cell suspension through the cell-easyCyte HT system using guava ExpressPro software.
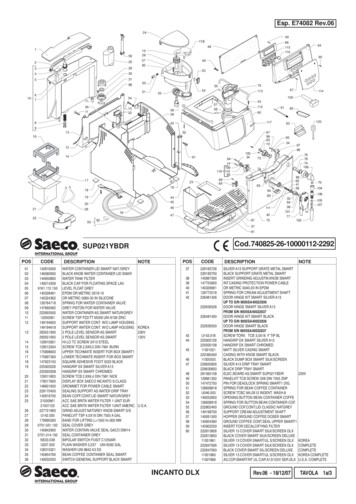
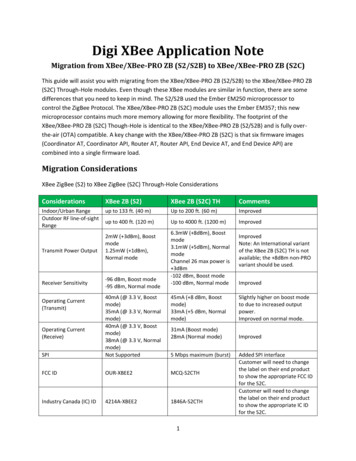
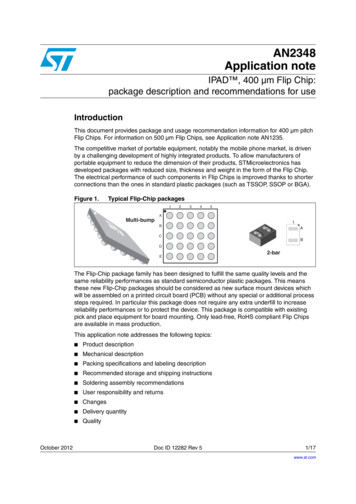
Resultsdistinguishable on the basis of particle size. Thehistograms in Figure 1B show the distribution of particlesViability assessment of PBMCFreshly prepared or frozen PBMC samples consistedin the different fractions as function of forward scatter,of live cells, dead cells, and a considerable amounta flow cytometry-based correlate of particle size. Whileof cellular debris. The debris component varied withthere was some overlap between size distributions ofrespect to properties inherent to the blood sample asdead cells and debris, the live cells constituted a distinctwell as the methods of storage and PBMC preparation.fraction made up of two differently-sized cell types.To understand the relative proportions of live cells, deadQuantifying subsets of PBMCscells and debris, freshly isolated PBMC were stained with(T cells, B cells, NK cells, monocytes)ViaCount reagent.PBMC can be subdivided into many distinct cell typesViaCount reagent distinguished viable and non-viablebased on the varying expression of specific surfacecells based on differential permeabilities of two DNA-markers and functional capabilities (for example, cytokinebinding dyes. The cell-permeant nuclear dye stainedsecretion). The abundance and relative distribution ofall nucleated cells, while the cell-impermeant viabilitythese subsets are functions of developmental state asdye brightly stained dying cells. Cellular debris was notwell as overall health. Two main populations of PBMCstained by either dye.are lymphocytes and monocytes. The lymphocyte subsetcan be further subdivided into T cells (CD3 ), B cellsResults from a representative assay are presented(CD19 ), and NK cells (CD16/56 ). Monocytes can bein Figure 1A. In this example, more than 95% of thedistinguished from all lymphocytes on the basis of CD14cells were viable. The three components were alsoexpression.AB10e4Total Events1007550M325M310e4Count750025005000Forward Scatter0ABCD14-PECy7 (Monos)75002500M150007500Forward Scatter10000CD3 100CD14 10010e3757510e2M2T 005000 7500Forward Scatter10000025005000 7500Forward Scatter10000CD3-PE (T-cells)00Monocytes10e410000CD56-APC (NK Cells)2500M110e010e0Live CellsDebris/RBC750025005000Forward Scatter010e3NK cellsM1CD19 1007510e2M2B cells75502510e1M1M22510e210e3CD19-A488 (B-cells)10e4M1M2M30010e150M3010e010e0CD16/56 100Count500010000C10e410000M1Figure 1. Representative flowcytometry data demonstratingsize-based discrimination of livevs dead cells. (A) live cells (blue),dead cells (red), and debris (green)fractions were defined usingViaCount reagent. (B) The fourhistograms show the relativedistribution of each fraction as afunction of particle size (forwardscatter).00Yellow 2250050007500Forward Scatter10038Count10e1010000Dead Cells1310e0Side Scatter250050007500Forward Scatter5010e0M100M15025M1010e210e1CountM2CountRed FluorescenceCount7510e3Live Cells10025005000 7500Forward Scatter10000025005000 7500Forward Scatter10000Figure 2. Representative datafrom flow cytometry analysis ofmulticolor staining performed onPBMC fractions. (A) Live cells (red)are distinguished from debris/dead cells (green) on the basis offorward vs. side scatter. (B) Livecells from (A) are fractionated inthe 2 plots based on variations inexpression of CD14, CD3, CD16/56,and CD19. (C) The four histogramsshow the localization of eachcell fraction with regards to thetwo peaks defined by forwardscatter. As shown, the three majorlymphocyte subsets are foundpredominantly in the smallercell peak (blue) while the CD14 monocytes are restricted to thelarge cell fraction (pink).3
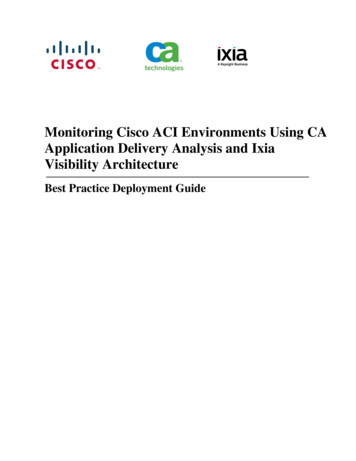
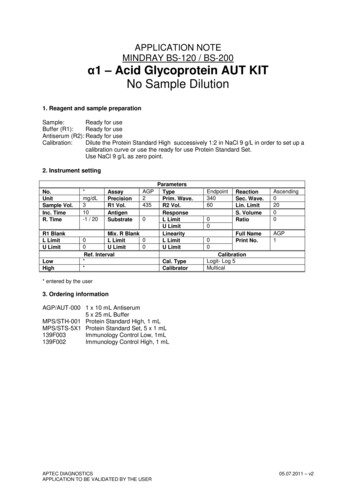
To investigate the distribution of these four subsets withdebris. The peaks correspond to lymphocytes (small cells),regards to size, PBMCs were stained with fluorescentmonocytes (large cells), and a debris/dead cell fraction.antibodies specific for each surface marker (Figure 2). Thedot plots confirmed definition of each subset by stainingAcross the nine PBMC samples analyzed (Table 1),with each cell-type specific marker. Figure 2C indicatedthe average mean cell diameters were 7.23 0.30 µmthat B, T, and NK cells were generally smaller in size (lowand 10.02 0.20 µm for lymphocytes and monocytes,forward scatter) while CD14 monocytes were larger inrespectively. Resulting values were consistent withsize (higher forward scatter).previously reported size ranges2. In addition, cellfrequencies were determined by three methods:To examine the ability of the 40 µm Scepter sensorScepter diameter plot, guava easyCyte forwardto discriminate lymphocytes from monocytes, PBMCscatter, and antibody staining. The Scepter valuesfractions were isolated from fresh human blood byslightly underestimated the lymphocyte fraction whileFicoll gradient centrifugation. Diluted samples wereoverestimating the monocyte subset. This is likely theanalyzed using both a guava easyCyte flow cytometerresult of the Scepter cell counter’s comparatively lowerand the Scepter cell counter. Representative histogramresolution as well as subjectivity and user bias in theplots are presented in Figure 3. In each case, three mainplacement of gates defining each subset. Overall, therepeaks were distinguishable by each analysis method,was good agreement between the different analyticalwith greater peak resolution in the flow cytometrytechniques with values varying by 10% in nearly alldata, particularly in the separation of lymphocytes fromcases.Flow CytometryScepter (40 µm)Relative FrequencyCountCountTest12Diameter (µm)CountCountForward cyte647272Monocyte362828Diameter (µm)Figure 3. Three representative examples comparing histogram plots for human PBMC samples acquired on theScepter cell counting (diameter figures on right) and guava easyCyte flow cytometry (forward scatter figureson left) platforms. Analysis plots derived from both platforms demonstrate three distinct peaks correspondingto lymphocyte, monocyte, and dead cell/debris fractions. The difference in counts displayed (Y-axis) is due todifferences in sample dilution between the guava flow cytometer and the Scepter cell counter.4ForwardScatter2LymphocyteDiameter (µm)CountCountForward ScatterScepter1Monocyte6Forward ScatterCell FractionTable1. Lymphocyte and monocyte subset frequencies from nineindividual PBMC samples. Aliquots from each sample were analyzedusing the guava easyCyte and Scepter platforms. 1Values were derivedfrom the diameter histogram plot. 2Values were derived from the forwardscatter histogram plot based on total events measured on guava easyCyteplatform. 3Staining frequencies derived as follows:% Leukocytes % CD3 T cells % CD16/56 NK % CD19 B cells;% Monocytes % CD14 cells
02Example 2:were stimulated for two days in the presence of solubleHuman T-cell activationanti-CD28 mAb (clone 28.2, BD Pharmingen, 2 μg/mL)on plates pre-coated with anti-CD3 mAb (clone HIT3a;IntroductionBD Pharmingen, 10 μg/mL). Mitogenic stimulation wasIn vivo, T lymphocytes are activated and inducedcarried out in the presence of 2 µg/mL PHA (Sigma).to proliferate upon binding of the T cell receptor toUnstimulated control cultures were also analyzed.antigen-presenting cells. In response to stimulation,T cells undergo physical, biological, and phenotypicScepter cell countingchanges, including increased cell size, secretion ofSample acquisition and data analysis was performedcytokines, and up-regulation of CD25 surface expression,as previously described. Briefly, following stimulation, aultimately culminating in the production of specifically-small aliquot of each culture was harvested, diluted intuned immune responses. Elevated CD25 expressionPBS, then analyzed on the Scepter cell counter. Test fileslevels are a late-stage indicator of T-cell activation .were uploaded and analyzed using Scepter Software ProAssays measuring changes in T- and B-cell activationto determine the degree of cell activation (% activatedare commonly used to identify patterns of immunecells) as well as concentrations for both unstimulatedresponse in clinical diagnostics as well as therapeuticand activated fractions.4development.CD25 staining for activationThe in vivo immune response by T cells can be mimickedFollowing two-day stimulation, cultures were harvested,ex vivo by binding T cells to co-immobilized anti-CD28washed twice with PBS, and then counted using theand anti-CD3 monoclonal antibodies . PBMCs canScepter cell counter. For each sample, 100,000 cells werealso be activated through exposure to more genericresuspended in 100 µL PBS 0.1% BSA. To distinguishinducers of cell proliferation, such as the plant lectinthe activated T-cell fraction, samples were stained withphytohemagglutinin (PHA) or pokeweed mitogen. Exanti-CD3-PE (T cells) and anti-CD25-APCeFluor780vivo activation enables detailed studies of the molecular(antibodies from eBioscience). Singly stained samples andmechanisms regulating T-cell activation and response.Isotype controls were included with each staining set to3Materials and Methodsensure proper instrument setup. Samples were incubatedat RT for 20 minutes, washed twice with PBS, thenCell culture/activationresuspended in 200 µL PBS prior to acquisition. SamplesHuman PBMC fractions were isolated as previouslywere analyzed (3000 cells/sample well) on a guavadescribed. Prior to culture, initial cell concentrations wereeasyCyte HT system using guava ExpressPro software.determined using the Scepter cell counter. All culturingexperiments were performed in RPMI 1640 supplementedwith 10% fetal bovine serum (FBS) (R10) in the absenceof antibiotics. PBMC (400,000 cells/mL, 24-well plates)5
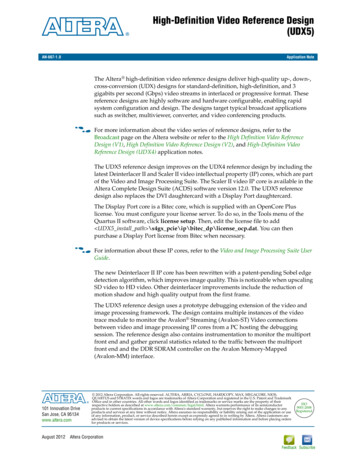
ResultsThe dot plots in Figure 4B showed three mainTo address the potential use of the Scepter cell counterpopulations of cells: resting T cell (CD3 /CD25-),for rapid qualitative monitoring of immune cellactivated T cells (CD3 /CD25 ), and non-T cells (CD3-/activation as a function of the cell size shift, freshlyCD25-). By comparison, cultures stimulated with CD3/isolated PBMCs were stimulated in culture using twoCD28 Ab demonstrated significantly greater levels ofdifferent mechanisms: (1) CD3/CD28 antibody-mediatedT-cell activation than those exposed to PHA. Controlco-stimulation of the T cell receptor (TCR) and (2)cultures showed very low frequencies of activated cells.mitogenic stimulation by PHA.Under all conditions, CD25 expression also correlatedwith an increase in overall cell size (Figure 4C).ABCForward ScatterForward ScatterCD25 eFluor780CD25 Side ScatterSide ScatterCD25-CD3-PESide ScatterUntreatedCD25 - cell sizeForward ScatterForward ScatterCD25 eFluor780Side ScatterSide ScatterCD3-PESide ScatterCD3/CD28Forward ScatterForward ScatterForward ScatterCD25 eFluor780Side ScatterSide ScatterCD3-PESide ScatterPHAForward ScatterForward ScatterFigure 4. Expression of the cell activation marker CD25 correlates with an increase in cell size. (A) An elliptical gate was used to identify live cells. (B) Dot plots depict the fractionation of livecells on the basis of CD3 and CD25 expression. (C) The forward scatter histogram plots demonstrate that expression of CD25 is restricted to the larger-cell fraction for all culture conditions.6
In Figure 5, the Scepter cell counter’s ability to detect cellthe live, unstimulated fraction. This overlap was clearlyactivation was compared to that of the guava easyCytedemonstrated in the untreated sample, in which twoflow cytometry platform. While the Scepter cell counterpeaks were seen in the flow cytometry histogram plot ofwas able to detect the presence of the larger, activatedtotal cells (Marker R5). By comparison, the live cell-onlycell fraction in both stimulated cultures, the devicehistogram showed a single peak within R5. The resultingwas unable to simultaneously discriminate the smallerdata clearly demonstrated the subset of activated T cellsunstimulated population in these samples. This was mostbut could not be used discriminate the live, unstimulatedlikely due to the presence of a large number of deadT cell population.cells (red cells in Figure 5A) that overlapped in size withBFlow CytometryForward ScatterScepter (40 µm)LiveCountTotalCountSide ScatterUntreatedCCountAForward ScatterDiameter (µm)Forward ScatterForward ScatterForward ScatterCountCountCountSide ScatterCD3/CD28Forward ScatterDiameter (µm)Forward ScatterForward ScatterCountCountCountSide ScatterPHAForward ScatterDiameter (µm)Figure 5. Representative data demonstrating size-based discrimination of resting vs. activated cells in control and stimulated PBMC cultures. (A) Live cell (blue), dead cell (red), and debris(green) fractions were defined using ViaCount reagent. (B) The two histograms in each row show the relative distribution of each fraction as a function of particle size (forward scatter). Plotsare based on total events and live cells, respectively. (C) Histogram data for each sample following analysis using the Scepter cell counter with 40 µm sensor.7
03Example 3: Splenic cell shift in murinemodel of EhrlichiosisMaterials and methodsInfection of mice with Ehrlichia murisSix- to eight-week-old C57BL/6 mice were infectedIntroductionwith Ehrlichia muris ( 1 x 10⁴ bacterial genomes) byHuman monocytotropic ehrlichiosis (HME) is anemerging tick-borne disease caused by the obligatelyintracellular pathogen Ehrlichia chaffeensis that residesin mononuclear phagocytes. HME initially manifestsas nonspecific flu-like symptoms but can progress tolife-threatening toxic shock-like syndrome with anemia,thrombocytopenia, and multi-organ failure. The presenceof extensive inflammation in the absence of bacterialburden suggests that mortality is the consequence ofunregulated immunopathology5,6. In this study, a murinemodel of HME based on infection of C57BL/6 micewith Ehrlichia muris was used to investigate aspectsof the immune response, in particular, changes to thepopulation dynamics of splenocytes.the intraperitoneal route. Mice were sacrificed on day30 post-infection and spleens were harvested. Singlecell suspensions of splenocytes were prepared usingthe GentleMACS Tissue Dissociator following themanufacturer’s instructions (Miltenyi Biotec Inc., CA).Determination of splenocyte cell distribution usingthe Scepter cell counterCells were diluted to a
Guava easyCyte cell counting 10 µL of each PBMC sample was diluted in 190 µL PBS. Samples were then analyzed on a guava easyCyte HT system to determine the concentrations and relative cell frequencies for the lymphocyte and monocyte fractions. Cell viability d