Transcription
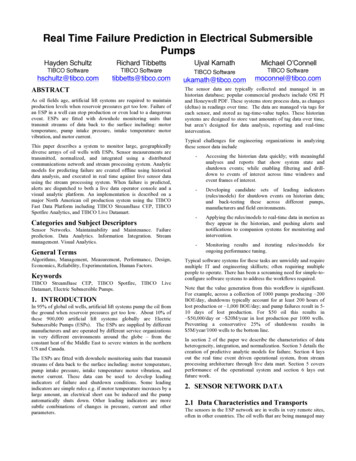
Real Time Failure Prediction in Electrical SubmersiblePumpsHayden SchultzRichard TibbettsUjval KamathTIBCO SoftwareTIBCO Softwarehschultz@tibco.comtibbetts@tibco.comTIBCO SoftwareABSTRACTAs oil fields age, artificial lift systems are required to maintainproduction levels when reservoir pressures get too low. Failure ofan ESP in a well can stop production or even lead to a dangerousevent. ESPs are fitted with downhole monitoring units thattransmit streams of data back to the surface including: motortemperature, pump intake pressure, intake temperature motorvibration, and motor current.This paper describes a system to monitor large, geographicallydiverse arrays of oil wells with ESPs. Sensor measurements aretransmitted, normalized, and integrated using a distributedcommunications network and stream processing system. Analyticmodels for predicting failure are created offline using historicaldata analysis, and executed in real time against live sensor datausing the stream processing system. When failure is predicted,alerts are dispatched to both a live data operator console and avisual analytic platform. An implementation is described on amajor North American oil production system using the TIBCOFast Data Platform including TIBCO StreamBase CEP, TIBCOSpotfire Analytics, and TIBCO Live Datamart.Categories and Subject DescriptorsSensor Networks. Maintainability and Maintenance. Failureprediction. Data Analytics. Information Integration. Streammanagement. Visual Analytics.General TermsAlgorithms, Management, Measurement, Performance, Design,Economics, Reliability, Experimentation, Human Factors.KeywordsTIBCO StreamBase CEP, TIBCO Spotfire, TIBCO LiveDatamart, Electric Submersible Pumps.1. INTRODUCTIONIn 95% of global oil wells, artificial lift systems pump the oil fromthe ground when reservoir pressures get too low. About 10% ofthese 900,000 artificial lift systems globally are ElectricSubmersible Pumps (ESPs). The ESPs are supplied by differentmanufacturers and are operated by different service organizationsin very different environments around the globe – from theconstant heat of the Middle East to severe winters in the northernUS and Canada.The ESPs are fitted with downhole monitoring units that transmitstreams of data back to the surface including: motor temperature,pump intake pressure, intake temperature motor vibration, andmotor current. These data can be used to develop leadingindicators of failure and shutdown conditions. Some leadingindicators are simple rules e.g. if motor temperature increases by alarge amount, an electrical short can be induced and the pumpautomatically shuts down. Other leading indicators are moresubtle combinations of changes in pressure, current and otherparameters.ukamath@tibco.comMichael O’ConnellTIBCO Softwaremoconnel@tibco.comThe sensor data are typically collected and managed in anhistorian database; popular commercial products include OSI PIand Honeywell PDF. These systems store process data, as changes(deltas) in readings over time. The data are managed via tags foreach sensor, and stored as tag-time-value tuples. These historiansystems are designed to store vast amounts of tag data over time,but aren’t designed for data analysis, reporting and real-timeintervention.Typical challenges for engineering organizations in analyzingthese sensor data include-Accessing the historian data quickly; with meaningfulanalyses and reports that show system state andshutdown events; while enabling filtering and drilldown to events of interest across time windows andevent frames of interest.-Developing candidate sets of leading indicators(rules/models) for shutdown events on historian data;and back-testing these across different pumps,manufacturers and field environments.-Applying the rules/models to real-time data in motion asthey appear in the historian, and pushing alerts andnotifications to companion systems for monitoring andintervention.-Monitoring results and iterating rules/models forongoing performance tuning.Typical software systems for these tasks are unwieldy and requiremultiple IT and engineering skillsets; often requiring multiplepeople to operate. There has been a screaming need for simple-toconfigure software systems to address the workflows required.Note that the value generation from this workflow is significant.For example, across a collection of 1000 pumps producing 200BOE/day, shutdowns typically account for at least 200 hours oflost production or 1,000 BOE/day; and pump failures result in 510 days of lost production. For 50 oil this results in 50,000/day or 20M/year in lost production per 1000 wells.Preventing a conservative 25% of shutdowns results in 5M/year/1000 wells to the bottom line.In section 2 of the paper we describe the characteristics of dataheterogeneity, integration, and normalization. Section 3 details thecreation of predictive analytic models for failure. Section 4 laysout the real time event driven operational system, from streamprocessing architecture through live data mart. Section 5 coversperformance of the operational system and section 6 lays outfuture work.2. SENSOR NETWORK DATA2.1 Data Characteristics and TransportsThe sensors in the ESP network are in wells in very remote sites,often in other countries. The oil wells that are being managed may
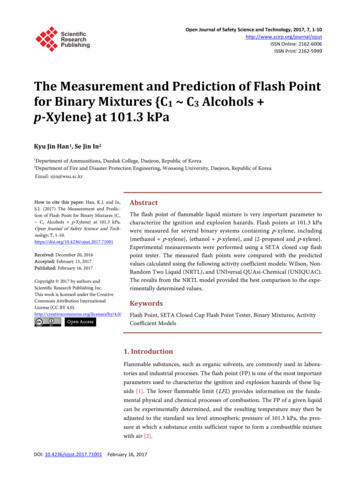
be owned and/or operated by various organizations, so dictatingcommon procedures and achieving a common level of datareliability is usually not possible. The data are often transmittedusing older General Purpose Packet Radio Service (GPRS) withvarious levels of quality of service.The equipment under test is located in many remote sites, withvarious degrees of exposure to weather and external effects ontelemetry and network components, e.g. birds, so it’s notuncommon for errors to occur in the data. This can includemissing or incorrect historian entries. When an oil well isinitialized, for example, the measurements are often unreliableand can take some minutes to stabilize.2.2 Data CollectionThere are several paths that the remote sensor data can take beforethey are analyzed. The most straightforward path is for the data tobe collected from remote sites and transferred to a centralizedlocation, either traditional relational database, or industry-specifichistorian database like OSI-PI or Honeywell PHD. This is oftennot as straightforward as it sounds, as the sensor samples aretypically stored and forwarded between remote equipment andlocal and central historian instances; at varying latencies.Agile Analytics environments like TIBCO Spotfire, and EventProcessing systems like TIBCO StreamBase, connect very easilyto any of these external data sources, as there is already a largepreexisting library of external data adapters. If there is no existingadapter for a data source, it is straightforward to write a newadapter using the products’ APIs. Regardless of whether existingadapters are used or a new adapter is written, a fundamentalfeature of the agile analytics and event processing systems is thatthe connectivity to external systems is isolated from thedevelopment of the business logic that performs the failure /outage detection.While a well-developed software system using traditionalprogramming languages will also isolate the code betweendifferent layers of the system, this is a fundamental feature ofagile analytics and event processing systems which naturallyisolate the infrastructure connectivity code, if any, from thealgorithm processing steps. Since the connectivity code, themessage passing, the control over concurrency is all handled bythe analytics and event processing system, the subject matterexperts do not need a team of developers. Rather, the responsibleengineers can review the data in Spotfire’s interactive visualenvironment to uncover patterns/rules/models in the sensor dataleading up to the outage; backtest the models on historical data;and publish the models to Streambase for ongoing monitoring.This can all be achieved in an intuitive point-click environmentwithout the need for traditional coding.2.3 Data Integration and NormalizationThe first step in the detection system is data cleansing, whichwaits for measurements to stabilize when a well is cycled,eliminates any duplicate samples, filters incorrect values, andimputes missing values from previous samples, as appropriate.When using previous values to substitute missing values, it isimportant not to obscure failures that cause missing sensormeasurements. Sending both raw values that may be null and thelatest values accomplishes this.Figure 1. TIBCO StreamBase event flow diagram that replacesanomalous bad data values with the previous valid sensor reading(within time constraint) and stops invalid data from being processedwhen a well is being restarted.3. PREDICTIVE ANALYTIC MODELINGWhile the exact features and algorithms are proprietary, and differin each implementation, the basic techniques are common acrossdifferent users, manufacturers, and environments. As such, thefeature vectors, and the algorithms in this paper are not identicalto the algorithms used in customer implementations.3.1 Developing Historic ModelsDifferent detection algorithms have been implemented: ad hocrules, statistical control charts and machine learning. Thedetection algorithms all implement a common interface making itextremely easy to change between detection algorithms, or evenrun multiple detection algorithms simultaneously.A detailed description of TIBCO StreamBase interfaces is givenin section 4.1.The detection algorithms that have been used in this system fallinto two broad categories: ad hoc algorithms that subject matterexperts have developed to based on their experience, andstatistical models and control charts that are trained on collecteddata.Training statistical models has been done using the TIBCOSpotfire analytics system either using built-in functionality or bycalling R functions to train the model. To improve performance,the R functions were run in the TIBCO Enterprise Runtime for Renvironment (TERR) environment rather than the open-source Renvironment, but the functionality is identical. TERR is TIBCO’sproprietary, high performance R engine that is embedded in bothSpotfire and StreamBase.Machine learning models are trained using TIBCO Spotfirecalling R code running in TERR. Then the trained models may beexecuted from the TBCO StreamBase system by invoking the Rmodel from an embedded TERR instance (or instances).3.1.1 Ad Hoc Detection AlgorithmsWhile statistical and machine learning techniques are extremelypowerful; ad-hoc, rules-based algorithms are a good way to getstarted. Organizations that use the ESP failure detection systemdescribed herein will have been maintaining oil and gas wells fordecades. This organization will have a culture, and have strategiesthey use to schedule maintenance. A new equipment failuredetection system will therefore not be the only way maintenancedecisions are made.The people who schedule site visits for all of the sites need tohave confidence in the new system to justify prioritizingsuggestions over other maintenance tasks. If the system mimicsdecisions made in ways they understand, it will build confidence.
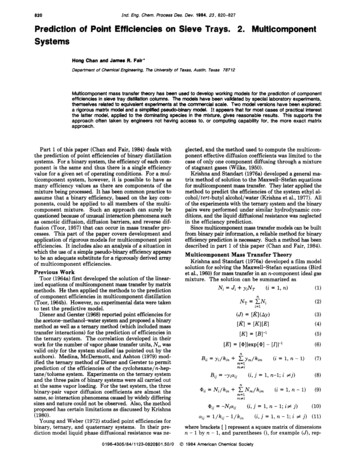
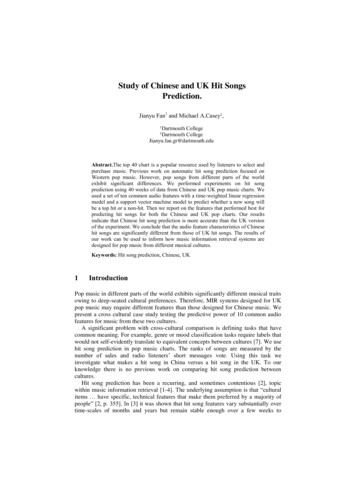
For example, if the system reports that a failure is likely due tohigh pump pressure readings combined with current spikes, it ismore compelling than, a logistic regression model that says thatthe likelihood of failure in the next week is 0.72.Figure 2. TIBCO SpotFire analysis of sensor data leading to failure.Subject matter experts use this sort of analytics to guide developmentof ad hoc detection algorithms.Especially when considering that there will inevitably be issueswhen a complex new system is initially deployed, the approachwe take is to initially deploy with algorithms based on thecustomer’s current detection methods and enhance with statistical,clustering and machine learning models.During implementation discussions, the customer defined theirdetection methods using decision flow diagrams like the onebelow. Their methodology is proprietary so this is not the actualdecision diagram, but illustrates the sort of decision logic that istypically used.is the equivalent event flow code that automates the previousdiagram. This diagram below is the complete source code that iscompiled and executed. It’s a very easy way for subject matterexperts who think of their detection algorithm in terms of flowcharts to implement the algorithm.Figure 4. Equivalent TIBCO StreamBase event flow to previous handdrawn flow diagram. This event flow diagram has properties (notshown) for each operator that allows StreamBase to compile andexecute this logic.In addition to event flow diagrams, ad hoc rules have also beenimplemented. These were simple predicates without any forwardor backward chaining. This was not because there were noproduction systems available—the TIBCO Fast Data platformsupports two different rules engines, TIBCO Business Events andthe open source Drools rules engine. Rather, the number of ruleswould not be able to take advantage of performance optimizationsfrom RTTI [arg acronym escapes me while I’m disconnected] soexpressing the rules as compiled TIBCO StreamBase predicatesexpressions is more efficient and simpler to manage.RuleNameRule Predicate Expressionpressuremaxelement(pressure) - minelement(pressure) ssureROC)) 4currentavg(current) / maxelement(current) 0.78-Each of the variables, pressure, pressureROC, and current are listswhere the first element is the aggregated value for the latest hour,the second element is the aggregated value for the latest 4 hours,the third element is the aggregated value for the latest 12 hours,and the fourth element is the aggregated value for the latest day.Pressure holds the average pressure values. PressureROC is therate of change of pressure. Current is the average current value.3.1.2 ClusteringWhen failure modes can be described, it is often effective to useclustering algorithms to number the failure modes and labelsamples with either that failure mode or as normal operation.Then a clustering algorithm can determine the cluster centerpoints. Each sample measurement is compared to a failure clustercenter, if the Cartesian distance to the closest cluster center issmall, then it is flagged as a likely failure of that type.Figure 3. Failure detection flow chart drawn by subject matter export.As this logic is proprietary, some of the logic has been changed toobscure precise details, but the kind of logic the subject matter expertuses is shown.The graphical event flow language that TIBCO StreamBase usesis particularly well suited to express this kind of algorithm. HereFigure 5. A TIBCO StreamBase event flow program for a k-meansclustering algorithm.The event flow diagram below scores a new list of samplemeasurements against the cluster centers that have been calculatedby the k-means clustering algorithm.
4.1 Stream Processing ArchitectureTo allow different detection algorithms to be plugged in, aninterface for an abstract detection algorithm has been defined andeach specific detection algorithm implements that interface. Onerequirement is that all of these detection algorithms operate havethe same inputs.Figure 6. The TIBCO StreamBase event flow code for scoring asample against a list of cluster centers.3.1.3 Statistical Detection AlgorithmsA binary predictor was built using a logistic regression model.TIBCO SpotFire was used to identify portions of historical datathat represented ESP failures and train a logistic regression model.Then the model’s coefficients are loaded into TIBCO StreamBaseto evaluate the real-time ESP samples.A StreamBase interface is analogous to a Java interface. It is asource code module that only contains definitions. While a Javainterface defines method signatures with method returns, aStreamBase interface defines input streams, output streams andshared query tables, specifying the schemas of each. EveryStreamBase application (a .sbapp file) that implements theinterface must define the exact same input streams, outputstreams, shared query tables all with the exact same schemas.In Java methods defined by the interface can be invoked on anObject that implements that interface. In StreamBase event flowprogramming, an extension point is used to enqueue and dequeueto streams without knowing the actual implementing module.Unlike invoking a method on a Java interface, a StreamBaseextension point may specify (either at design time or at runtime)multiple implementing modules so enqueueing a tuple into aninput port on that extension point can send the tuple to severalimplementing modules.Figure 7. TIBCO SpotFire form to build a regression modelFigure 9. This event flow uses an extension point for the interfaceFailureDetectionAlgorithm.sbint. The properties view shows that thereare two implementations: RulesBasedFailureDetection.sbint andLogisticRegressionFailureDetection.sbint. When a tuple is sent to theextension point, it will be processed by both implementing modules andany output tuples will be sequentially emitted from the output port ofthe extension point.Figure 8. TIBCO SpotFire trained regression model coefficientspublished to TIBCO StreamBase.4. REAL TIME OPERATIONSIt is a system requirement that implementing and running differentdetection algorithms must not be difficult. This is accomplishedby separating the stages and defining interfaces so thatcomponents may easily be switched when the system is deployed.
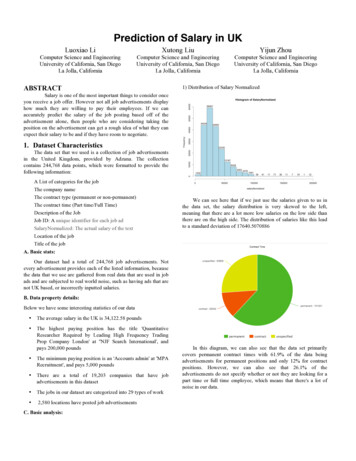
Interfaces are used in this system to specify algorithm modules sothat different algorithms can be deployed, or several algorithmsrun simultaneously, without any modifications to the rest of thesystem. Developers are also required to match the input andoutput schemas exactly so that any errors are caught at designtime rather than causing runtime errors.ESPSensor SamplesAlertsTIBCO StreamBaseAlertsLive DatamartDetection AlgorithmParametersTIBCO SpotFireHistoricalSample DataFigure 10. System Architecture Diagram. ESP sensor samplesare sent to both a historical database and into TIBCOStreamBase. TIBCO Spotfire uses data from the historical DBand send detection algorithm parameters to StreamBase.StreamBase processes sensor samples and sends alerts toSpotfire (vis Spotfire Automation Services) and into theTIBCO Live Datamart to be displayed on user’s dashboards.Users may view the alerts in context using Spotfire andfurther refine algorithm parameters.Figure 11. Top level event flow. Connects to external input and outputsystems and calls each stage of the system.After data cleansing, a feature extraction stage aggregates the dataand calculates common features that are used by all of thedetection algorithms. The cleansed data is aggregated usingseveral time windows. The specific features that are calculated areproprietary to each customer, but common statistics like meanvalues, standard deviation, movement trend are calculated fordifferent time windows, typically daily, hourly, and 10-minutewindows.Figure 12. The feature extraction event flow. The CalcStatsExtextension point calculates the statistics for every time window. ThelatestVals agregate operator outputs the latest value for eachwindowed statistics as the list of features per time window.4.2 Stream Processing ImplementationThis system was developed entirely with event processingproducts with no traditional programming of any of thealgorithms, analytics, dashboards, and interactive interface to theaggregated feature vectors and alerts.The only traditional programming language work used toimplement the initial system is adapters to external systems, likeOSI PI and OSI AF and unit testing. Most of the java code for thejunit-based testing framework was autogenerated.Figure 13. This is the same implementation event flow that is used tocalculate every time-windowed feature.The implementation of this system in TIBCO StreamBase eventflow fo
the analytics and event processing system, the subject matter experts do not need a team of developers. Rather, the responsible engineers can review the data in Spotfire’s interactive visual environment to u