Transcription
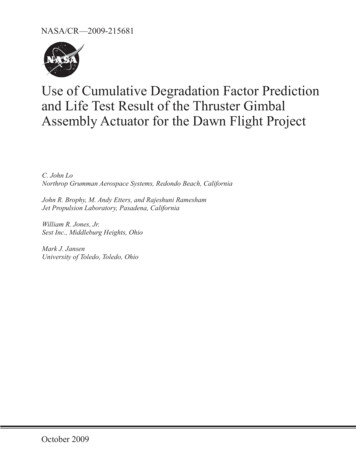
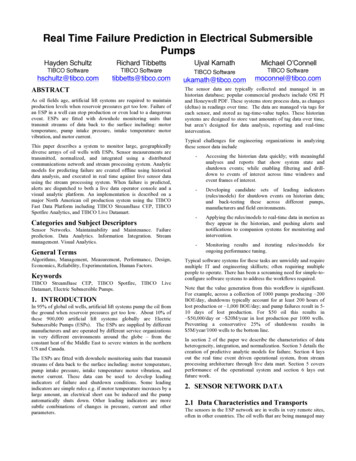
Prediction of Salary in UKLuoxiao LiXutong LiuYijun ZhouComputer Science and EngineeringUniversity of California, San DiegoLa Jolla, CaliforniaComputer Science and EngineeringUniversity of California, San DiegoLa Jolla, CaliforniaComputer Science and EngineeringUniversity of California, San DiegoLa Jolla, CaliforniaABSTRACT1) Distribution of Salary NormalizedSalary is one of the most important things to consider onceyou receive a job offer. However not all job advertisements displayhow much they are willing to pay their employees. If we canaccurately predict the salary of the job posting based off of theadvertisement alone, then people who are considering taking theposition on the advertisement can get a rough idea of what they canexpect their salary to be and if they have room to negotiate.1. Dataset CharacteristicsThe data set that we used is a collection of job advertisementsin the United Kingdom, provided by Adzuna. The collectioncontains 244,768 data points, which were formatted to provide thefollowing information:A List of categories for the jobThe company nameThe contract type (permanent or non-permanent)The contract time (Part time/Full Time)Description of the JobJob ID: A unique identifier for each job adSalaryNormalized: The actual salary of the textWe can see here that if we just use the salaries given to us inthe data set, the salary distribution is very skewed to the left,meaning that there are a lot more low salaries on the low side thanthere are on the high side. The distribution of salaries like this leadto a standard deviation of 17640.5070886Location of the jobTitle of the jobA. Basic stats:Our dataset had a total of 244,768 job advertisements. Notevery advertisement provides each of the listed information, becausethe data that we use are gathered from real data that are used in jobads and are subjected to real world noise, such as having ads that arenot UK based, or incorrectly inputted salaries.B. Data property details:Below we have some interesting statistics of our data The average salary in the UK is 34,122.58 pounds The highest paying position has the title 'QuantitativeResearcher Required by Leading High Frequency TradingProp Company London' at ''NJF Search International', andpays 200,000 pounds The minimum paying position is an 'Accounts admin' at 'MPARecruitment', and pays 5,000 pounds There are a total of 19,203 companies that have jobadvertisements in this dataset The jobs in our dataset are categorized into 29 types of work 2,580 locations have posted job advertisementsC. Basic analysis:In this diagram, we can also see that the data set primarilycovers permanent contract times with 61.9% of the data beingadvertisements for permanent positions and only 12% for contractpositions. However, we can also see that 26.1% of theadvertisements do not specify whether or not they are looking for apart time or full time employee, which means that there's a lot ofnoise in our data.
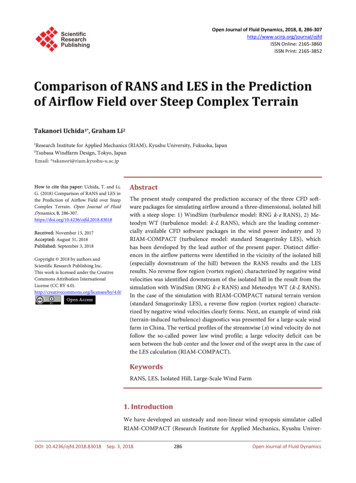
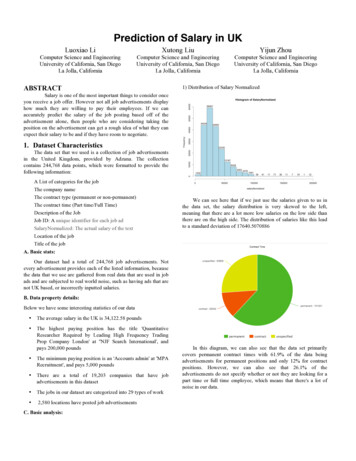
C.Data Preprocessing1) Distribution of Salary NormalizedIn the exploratory analysis section, we saw that the data wasskewed to the left. This is a problem because linear regressionmodels assume that distributions are normalized. Possible solutionsto this problem are taking the square root or the log of the salaries.This leads to a more evenly distributed set of salaries. If we take thelog of the salaries, we can see that the distribution closely resemblesa bell curve, which is what we want.Initially we thought that the contract would make for a reallygood feature, however, the problem is that most of the data (73.26%)does not specify whether or not it is for full time or part time,making this property of the dataset mostly noise, which isunfortunate, but realistic since not all real world job advertisementsspecify full time/part time. However for the ones that do, 23% arefor Full Time and 3.2% are for Part Time.LocationNumber of Job advertisementsUK38217London28487South East London11232The City6196Manchester3285The table above lists the locations with the most jobadvertisements. One thing that we noticed was that the location withthe most job advertisements was the UK. However, the problem withthis is that most of these locations are cities in the UK. Therefore,the data is inconsistent, in that not all these locations are cities.D.Feature exploration*For each of these features, when dealing with Salaries,we always use the log of the salaries and not the actual salarya.Average Salary of Salary of people with the same Title(Correlation 0.91135613)2. Predictive taskA.Task: Salary PredictionIn this project, we want to predict the salary of the person whoaccepts the job posted by the job advertisement. Using the datasetprovided by Adzuna, we want to create a model that minimizes themean absolute error when predicting the salary (One that predicts thesalary as accurately as possible). To do this we chose to use arandom forest regressor, which we used to fit our feature model ofthe data.B.Validity of predictionsSince we are given 244,768 total job advertisements, we firstrandomize the order of the data, and then select the first 230,000data points for training, and then the rest of the data was kept fortesting. After training the model, we wanted to estimate the salariesand calculate the MAE on that data set, which is basically onaverage, how many pounds does our model predict off the actualsalary. We also decided to calculate a normalized MAE, whichcalculated the percentage that our prediction was off by, because1,000 pounds means much more to the person making 5,000 than theperson making 200,000.We gathered the average salary of people with the same title, and foreach advertisement, we compared this average to the actual salary ofthe position. This led to a very strong correlation to the actual salary.b. Average salary of a location (0.41511654)
We can see that although we can see a correlation, there is alsoa lot of noise due to the UK not being a city problem. This couldexplain why the correlation of the location's average is lower thanthe company average.c. Average Salary of Companies (correlation 0.6679146)3. Select/Design ModelsA crucial step in this project is to select useful features andaccurate models. From the correlation between the features anddata, we were able to design several models.A.Evaluation of the ModelsTo evaluate the accuracy of the model, we calculated theMAE (Mean Absolute Error) of the prediction in the validationset. We calculated both MAE Score (prediction - actual) andMAE Normalized ((prediction - actual) / actual) to evaluate theaccuracy of the models.B.Baseline ModelsBased on the relevant features, we tried to start with thebasic models using only one feature on linear regression.a. Model 1: Prediction average SalaryWe also computed the average salary of the whole company andfound that while there was a correlation to the actual salary, it wasn'tas strong as the correlation to the title.d. Num of job postings in a location (correlation 0.1048831)*In the graph below, we only took the locations with 0-3,000 jobpostings due to a few outliers in the dataset.We started with the simplest model of prediction.Without using any techniques and features, we calculated theaverage salary of the training data. We predicted all thevalidation data to be the average salary of the training data.The MAE of this baseline model is: MAE Normalized 0.781204005349 & MAE Score 21838.716943. We can seethat the accuracy of the baseline is extremely low.b. Model 2: Feature CompanyWe then used single feature company and linearregression to predict the salary. We categorized the salary intoeach company, then took the average of the salary in eachcompany as the feature of the model. The MAE of this modelis: MAE Normalizedb 0.39400684388 & MAE SCORE 13171.086606. We can see that there is already animprovement in this model.Using similar technique, we computed several modelsusing different features, the result is in the chart below:We can see that the number of postings in a location to Salaryhas little to no correlation to salary. This was surprising because weinitially thought that more job postings meant that the company wasmore desperate and would be willing to pay more money. This couldalso be due to the fact that the location data is inconsistent. Eventhough it is not shown in the graph due to it being an outlier, thelocation with the most job postings is the UK, differs from the rest ofthe data set because it is a country and not a city.e. Part Time/Full Time (correlation 0.12048831)Because our dataset has a lot of noise when pertaining to thisproperty, the correlation is also very low.f. Text-mining: UnigramUsing 500 most common unigrams, and see which 5 unigramswith the most positive associate weight, and which 5 with the mostnegative associate weight. "note, may, live, ltd, over" are 5 unigramswith the most positive associate, and "require, recruiting, seeking,duties, originally" are 5 unigrams with the most negative ationAveSalaryInTitle ContractTypeC.MAE Norm0.7812040050.454725897MAE .200.63775057Complex ModelsWe believe that more complex model of the featureswould make the prediction more accurate. Therefore, westarted to combine the features together.a.Model 1: Combine all the featuresWe first combined all the features together as one basicfeature to predict. The MAE for this model is: MAENormalized 0.32913566735 & MAE SCORE 10363.578615b.Model 2: Create 3 groups and categorize the data pointinto ""/"full time"/"part time", generate theta withinthe groupThen we realized that jobs are categorized into 3 groupsby contract type: full time, part time and not specified. Webelieved that if we grouped the data points into those threegroups, and have individual thetas for each group, we mighthave a better model for the prediction. The MAE for this
model is: MAE Normalized 0.32813957995 & MAESCORE 10357.978534. This does not improve too muchbecause there are too many data in the category of notspecified, which makes the feature ambiguous.c.Model 3: Create 3 groups and categorize the data pointinto ""/"permanent"/"contract", generate theta withinthe groupSimilarly, we used contract time as a feature tocategorize the data into permanent, contract and notspecified. The MAE for this this model is: MAE Normalized 0.30797619889 & MAE SCORE 9310.459168In addition, we used text mining. We used most 500common unigrams and 500 common bigrams as the features,but neither of them have a better result.D.Dealing With Noise/OverfittingWe can see that adding more features does notnecessarily improve our model. One obstacle that prevents usfrom getting a better performance is the large amount ofnoise in the data. From the diagrams that we showed in part 1and part 2, there is a correlation between the features andsalary, but some of the correlations are very weak. Therefore,we need to delete those outliers from the training data toeliminate the noises. We first used the raw training data toget the parameters (thetas) for the model. Next, we run oneround of the thetas on the training data, and store the datapoints that have difference between prediction and actualgreater than 0.8. We assume that there is some sort of error inthese data points due to human error, such as adding an extra0 to the salary, or inputting wrong information. We thendelete those data points from the training set and rerun theprocess to get new parameters. Finally run the model usingvalidation set. From research, we realized that adding thesquare and cube of the features would also reduce theoverfitting. Therefore, we also add the square and cube of thefeatures to the basic feature.The MAE for the model with regularization is: MAENormalized 0.275165830841 & MAE Score 8583.914206The MAE for the model eliminating the Noise is: MAENormalized 0.26378159615 & MAE Score 7635.3968514. Relevant LiteratureThe dataset comes from kaggle, called "predict the salaryof any UK job as based on its contents", published by Adzuna, a jobsearch engine based in UK. The dataset is used as a census of thepeople's income dataset. With the relevant features and excitingmodels we found, we started our research by predicting salary withclassification or regression. If we want a binary answer, like (1 or 0),we can predict if a person's salary is below or above the averagesalary or threshold. We can also predict exact salary that a personwill have if the person takes the job. To predict whether a person'ssalary is above or below the average, we have several options,classification tasks, such as logistic regression, support vectormachine, etc.To predict the salary a person might have, we usedregressions, such as linear regression, ridge regression, etc to buildour model. Some other people chose to predict binary output of thisdataset. We prefer to predict the real salary a person will have withcontents of the dataset.A. Linear Regression:Linear regression is one of the simplest supervised learningapproaches to learn the relationship between inputs and output.Inputs are features and output is prediction. For modeling therelationship between two variables, it fits the inputs and features intoa linear equation ( y ax b). In out prediction task, we usedaverage salary per company, average salary per location, averagesalary per job category, and numbers of job advertisements perlocation published, as input features to linear equation.B. Tikhonov Regression: [3]Tikhonov regression is also known as ridge regression. It is asupervised learning approach that learns the relationship betweeninput vector and output. It addresses some problems with ordinaryleast square by penalizing size of coefficients. The differencebetween ridge regression and linear regression is that ridgeregression penalizes on overfitting.C. Nearest Centroid: [3]Nearest Centroid Classifier assigns samples in each class to betheir centroid, and the method detects whose centroid is nearest toobservations. Nearest centroid classifier is a simple algorithm thatrepresents each class with the centroid of members of the class. Thisis a similar process to the k-means process.D. Nearest Neighbor Regression: [3]When data labels are continuous rather than discrete, nearestneighbor regression is a good choice. A label of data will beassigned to a query point, the nearest centroid of its nearestneighbors.E. Support Vector Machine( SVM): [2]Some people also predicted binary solutions with similardatasets. By predicting output 0 or 1, support vector machine is themethod they use. Using Support Vector Machine can minimize themisclassification error in classification. Also, the method of SupportVector Classification can be used to solve regression problems. Themethod is called Support Vector Regression( SVR). Because SVRignores any training data that close to the prediction when build themodel, the SVR depends on subset of training data.F. Random Forest: [3]Random forest comes from a general technique called randomdecision forest. A random forest is an ensemble learning method forclassification and regression, etc. The random forest can fit anumber of classifying decision trees on various dataset and subsamples. A single decision tree will lead overfitting, but randomforest can improve test accuracy largely by reducing the overfitting.The state-of-art algorithm is Extremely randomized trees[1]: TheExtremely Randomized Trees contains ExtraTreeClassifer class andExtraTreeRegressor class. Same as random forests, extremelyrandomized trees also use a random set of candidate features;however, thresholds are picked randomly on each candidate feature,and the splitting rule is selected by the best of those randomlyconducted thresholds. In this way, we can minimize the variance ofthe model. We tried extremely randomized tree on our data sets. Theoutcome is similar to the random forest regressor but not better.Our method is similar to other regression methodsimplementation. Same features, like location, company, category,
contract type have been used in the past studies[4] from census dataand most used similar approaches to tackle their tasks.5. Result/ConclusionTo improve our performance, we tried to apply different modelsthat we have researched on to our data set. We used LinearRegression as our baseline classifier. We tried Support VectorMachine - Support Vector Regression, Nearest Centroid, LinearRegression, Logistic Repressor, K Neighbors Regressor, andRandom Forest Regressor. The table below shows the MAE andaccuracy to the corresponding classifier:MethodsMAENormalizedMAE 8965Nearest Centroid0.34816583012083.9142060.651834170Linear Regressor0.2637815967635.3968510.736218404Logistic e features we used are average salary per location, length ofjob description, average salary per company, number of jobs perlocation, average salary in each job title, contract time and contracttype. Average salary in each job title contract type work well onour data dataset. Average salary per location does not help much onthe dataset. We think average salary per company may depends oncontract type, because if a company offers more full time positionsthan part-time, the average salary might be higher. Furthermore, ifthere are more jobs posted in one location, there might be some bigcompanies in this location and the salary will be higher for thosecompanies.With the results shown above, we realized Random ForestRegressor gives us the best result. At first, we thought K NeighborsRegressor is the best solution because merging each data point as itscentroid may have a positive effect on eliminating the noises;however, the result is worse than Random Forest Regressor. Thereason might be K Neighbors Regressor does not improve predictiveaccuracy with averaging and control the overfitting as good asRandom Forest Regressor does. Additionally, we think SupportVector Regression gets the worst result because there are many datapoints around average and a few data points at two edges. SupportVector Regression just put more weights on the data points that nearthe decision boundary. In this data set, most points are close to thedecision boundary; thus SVR would not help.Overall, the most efficient method that we found was therandom forest regressor.References:1. Geurts, Pierre, Damien Ernst, and Louis Wehenkel. "ExtremelyRandomized Trees." Springer Science Business Media, Inc, 2 Mar.2006. Web. 1 Dec. 2015.2. Smola, Alex, and Bernhard Scholkopf. "A Tutorial on SupportVector Regression." Neurocolt.com. Produced as Part of the ESPRITWorking Group in Neural and Computational Learning IINeuroCOLT. Web. 1 Dec. 2015.3. "Scikit-learn." : Machine Learning in Python — 0.17Documentation. Web. 1 Dec. 2015.4. Lane, Terran, and Ronny Kohavi. Census-Income (KDD) DataSet. Print.
University of California, San Diego La Jolla, California ABSTRACT Salary is one of the most important things to consider once you receive a job offer. However not all job advertisements display how much they are willing to pay their employees. If we can accurately predict the salary of the job postin