Transcription
Study of Chinese and UK Hit SongsPrediction.Jianyu Fan1 and Michael A.Casey2,Dartmouth CollegeDartmouth CollegeJianyu.fan.gr@dartmouth.edu12Abstract.The top 40 chart is a popular resource used by listeners to select andpurchase music. Previous work on automatic hit song prediction focused onWestern pop music. However, pop songs from different parts of the worldexhibit significant differences. We performed experiments on hit songprediction using 40 weeks of data from Chinese and UK pop music charts. Weused a set of ten common audio features with a time-weighted linear regressionmodel and a support vector machine model to predict whether a new song willbe a top hit or a non-hit. Then we report on the features that performed best forpredicting hit songs for both the Chinese and UK pop charts. Our resultsindicate that Chinese hit song prediction is more accurate than the UK versionof the experiment. We conclude that the audio feature characteristics of Chinesehit songs are significantly different from those of UK hit songs. The results ofour work can be used to inform how music information retrieval systems aredesigned for pop music from different musical cultures.Keywords: Hit song prediction, Chinese, UK1IntroductionPop music in different parts of the world exhibits significantly different musical traitsowing to deep-seated cultural preferences. Therefore, MIR systems designed for UKpop music may require different features than those designed for Chinese music. Wepresent a cross cultural case study testing the predictive power of 10 common audiofeatures for music from these two cultures.A significant problem with cross-cultural comparison is defining tasks that havecommon meaning. For example, genre or mood classification tasks require labels thatwould not self-evidently translate to equivalent concepts between cultures [7]. We usehit song prediction in pop music charts. The ranks of songs are measured by thenumber of sales and radio listeners’ short messages vote. Using this task weinvestigate what makes a hit song in China versus a hit song in the UK. To ourknowledge there is no previous work on comparing hit song prediction betweencultures.Hit song prediction has been a recurring, and sometimes contentious [2], topicwithin music information retrieval [1-4]. The underlying assumption is that “culturalitems have specific, technical features that make them preferred by a majority ofpeople” [2, p. 355]. In [3] it was shown that hit song features vary substantially overtime-scales of months and years but remain stable enough over a few weeks to
2Jianyu Fan and Michael A. Caseyproduce better-than-chance predictions. Most of the above studies used a variety ofnon-linear machine learning methods and, as such; do not easily lend themselves tointerpretation of model weights. The current study is concerned with interpretationand feature selection in hit song prediction to compare cultures. Hence, we used linearregression model and we compared these results with using support vector machinemodel. We address the time evolution of features using time-weighted linearregression classifiers. Our data consisted of official weekly top 40 songs in the year2012 in the Chinese and UK markets.The remainder of the paper is organized as follows: Section 2 gives the backgroundto hit song prediction; Section 3 gives details of the dataset used; Section 4 describesthe audio features; Section 5 presents methods and results of binary classification;Section 6 gives a comparative cross-cultural analysis of audio features; and weconclude with a summary and discussion in Section 7.2BackgroundA number of systems have been proposed for hit song prediction, which is a binaryclassification task to predict whether or not a new song will be a hit. Dhanaraj, R [1]used both lyric features and audio features from a corpus of 1700 songs. They used asupport vector machine (SVM) with boosting. The reported results were better thanrandom and the results using lyrics features were better than for using audio featuresalone. Pachet’s [2] goal was to classify songs as low, medium or high popularityusing a SVM trained on a corpus of 32,000 songs. His results cannot prove theirclassifiers worked. Ni et al. [3] used the shifting perceptron algorithm, which employsa time-weighted version of the perceptron learning rule, in a corpus of 5947 of the UKtop 40 singles over the last 50 years. The goal was to distinguish the top 5 hits fromthe top 30-40 hits. The accuracy was between 56% and 62%.In our work, we want to see how hit song prediction varies from different cultures,and we set up our experiments to specifically address that question using 10 commonaudio features and linear binary classification.3DatasetTop 40 chart data for the year 2012 was collected from the Official ChartCompany1 for UK hit songs and ZhongGuoGeQuPaiHangBang2for Chinese hit songs.We labeled the top 20 songs hits and the bottom 20 not hits. Within these data we alsoevaluated prediction performance for the highest 5 (1-5) and lowest 5 (36-40) rankedsongs. We needed to download Chinese songs one by one to perform audio analysisso we managed to collect 40 weeks of data. Because there is always some gap ofweekly data in the Chinese chart, in the 40 weeks of data we have, there are 3 weekswith no data. So we have 37 weeks data on Chinese songs and 40 weeks data from nkui.com
Study of Chinese and UK Hit Song Prediction3UK chart. Since the chart is Top 40 chart, songs never enter this chart is considered asa new song. There are 347 new Chinese songs in total and 405 new English songs intotal.4Audio FeaturesWe extracted the following audio features using the EchoNest3service to analyze eachsong: danceability, duration, energy, key, liveness, loudness, mode, speechiness,tempo and time signature. These features most resemble those used in [1] and they arefeatures that globally represent a song. From the EchoNest website, we find theofficial description of following audio features.“The danceability feature is a number ranges from 0 to 1, representing how danceablethe Echo Nest thinks this song is [1].”“The duration feature is the length of the songin seconds [1].” “Energy feature is a number ranges from 0 to 1 representing howenergetic the Echo Nest thinks this song is.” “Key feature is the signature that TheEcho Nest believes the song is in. Key signatures start at C and ascend the chromaticscale. In this case, a key: 1 represents a song in D-flat [1]. ” “Loudness feature’sdescription is that: overall loudness of a track in decibels (dB) [1].” “Mode feature isthe number representing whether the song is major (0) or minor (1) key [1].” “TimeSignature is Time signature of the key; how many beats per measure. [1].” Thesefeatures are all global features no mature what genre the song belongs to, thesefeatures are all meaningful for the song.In Section 6 we inspect which features were the given weights with highermagnitudes and did the hit song prediction using different subsets of features based onselecting the higher-weighted feature terms. We obtained different feature weightingsfor Chinese hit songs prediction and UK hit songs prediction, as discussed below.5Machine LearningTo predict whether a song will be ranked higher or lower, and to analyze the featureweights of predicting UK songs and Chinese songs, we used a time weighted linearregression and compared results with a support vector machine model. We used timeweighted linear regression (TWLR) and support vector machine (SVM) to predictwhether songs newly entering the char in the coming two weeks will be hit songs.5.1Time Weighted Linear Regression (TWLR)To account for feature variation in time we give more weight to the training data thatis closer in time to the test data so that the model prediction results are more affected3http://the.echonest.com/
4Jianyu Fan and Michael A. Caseyby more recent data and less by data in the more distant past. Locally (time) weightedlinear regression [5] is defined as the following: For a given training set,{(and for a given test example,, we fit)()}(1)by minimizing: (where is the linear regression weight matrix andup on the temporal distance between x and. Then:)(2)is a time weight dependent(3)withthe time of the training data (is 1 for the first week’s data ) andthe time of the test data. To avoid numerical problems we scaled the weightstoadd to 1 for each x. Ifis small then the error terms () arenegligible. Ifis large the algorithm adjusts the weights to reduce the error. Wecan computeusing:(4)with W a diagonal matrix of the temporal weights.We used a shifting four-week window on the data to perform training and prediction,with the first three weeks of data in each window used for training and new songs inlast week used for testing. The window was advanced by one week and the processrepeated. We also used a shifting five-week window on the data while the first threeweeks of data is used for training and the last week is used for testing.We defined hit songs as those with rank 1-20 and non-hit songs as those with rank21-40, thereby yielding an equal chance of randomly assigning the correct label. Foreach window, we count the number of songs that were accurately predicted amongnew songs (Songs haven’t entered Top40). Each week there are 7 new songs onaverage. In addition, we count the number of top 5 songs among new songs (ranks 1-5)that are predicted as hit songs and the number of bottom 5 songs among new songs(ranks 36-40) predicted as non-hit songs.Table 1 shows the results of predicting new UK and Chinese hit songs for the TWLRand SVM model. The results of TWLR indicate that performance of predictingChinese songs was significantly above the baseline (50%). (Err 41.58%; p-value 0.03). But TWLR doesn’t work very well for predicting new UK hit songs. (Err 52.10%; p-value 0.29)As for SVM, we chose RBF kernel and gamma is equal 100. SVM model works greatfor predicting both new Chinese songs (err 39.25%; p-value 0.011) and UK hitsongs (err 42.30%; p-value 0.04). However, the result of predicting UK newsongs which are from top1-5 and top 36-40 is not very significant (err 44.32%; pvalue 0.263). The overall result of predicting 2nd week’s data is less accurate thanthose of predicting 1st week’s data
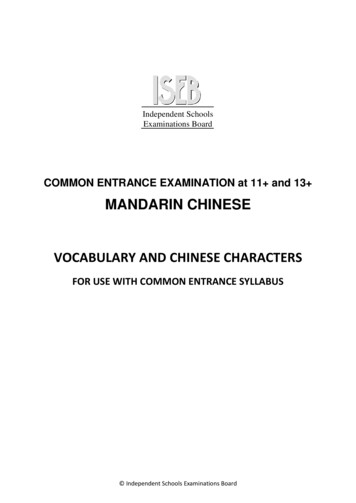
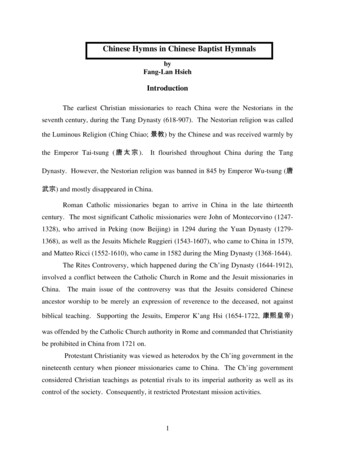
Study of Chinese and UK Hit Song Prediction5Table 1.Error Rate for New Songs ChineseUKChineseUKChineseUKChinese5.2Error rate (40 .50%P Value0.2900.0300.0040.0010.8820.3300.0050.147Error Rate (1-5vs. .62%P 1520.021Result AnalysisThere is no overlapping between training and testing sets. By comparing the results ofusing TWLR and SVM, we can see that SVM performed better with yieldingsignificant results relative to the baseline. Thus, whilst a linear hyper-plane in thefeature space cannot powerfully separate the categories there are linear categoricaltendencies in the feature space. The SVM is able to project the features into a kernelspace to perform the separation so it is difficult to interpret which features contributemost to the classification. However, TWLR gives us detailed information about theweights of features so that we explore the differences of feature between UK hit songprediction and Chinese hit song prediction.Table 1 shows that model prediction is better for top 5 and bottom 5 songs, exceptfor UK Hit Songs while using SVM. We propose that this is because the top and bottomranked songs are more likely to exhibit the feature traits learned by the classifier. Also,for these two groups, there are fewer changes in position week-to-week relative toother songs. Therefore the time-weighted model could more easily predict songsbased on the earlier week’s data.In addition, Chinese song prediction was significantly better when we onlyconsidered new songs from top and bottom 5 songs than considering from all Top 40.We analyze the social background and the results of the test. We can know thatwhether the song is rap and whether it is recorded in concert or in studio will affectthe rank of the song in Chinese chart greatly. Again, we interpret this to mean thatthose song positions are most likely to exhibit the traits of the hit/non-hit categoriesmaking them stand out from the songs at middle ranks with less certain labels.5.3Time to Become a Top10 HitTo check whether it is better to predict the next week’s data and the second nextweek’s data, we counted the number of weeks hit songs take before becoming a top10hit. Figure 1 and Figure2show the distributions of number of weeks of UK andChinese hit songs.
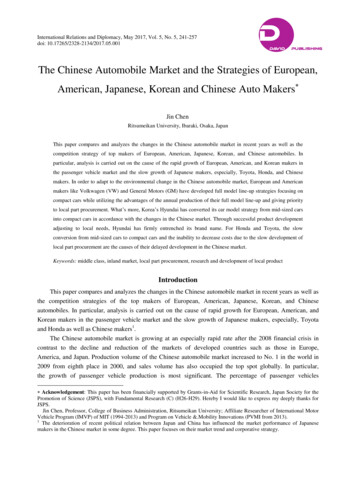
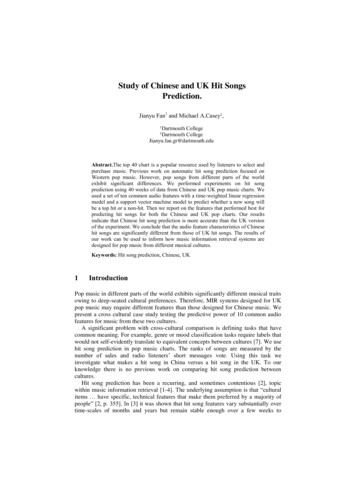
6Jianyu Fan and Michael A. CaseyFig. 1.Number of Weeks before Becoming Top10 Hits (UK Charts)Fig. 2.Number of Weeks before Becoming Top10 Hits (Chinese Charts)The distribution in above charts shows that over 2/3 of top10 hits are brand newsongs in UK chart. While for Chinese chart, over 2/3 of top10 hits take zero week orone week to get in to top10.Figure 3and Figure 4 show the distributions of number of weeks of songs stay intop 10.
Study of Chinese and UK Hit Song Prediction7Fig. 3.Number of Weeks Staying in Top10 Hits (UK Charts)Fig. 4.Number of Weeks Staying in Top10 Hits (Chinese Charts)6Analyses of FeaturesWe inspected the linear regression weight in both the Chinese hit songs predictingmodel and UK hit songs predicting model to discover which features are moreimportant. In addition, we did both UK hit song prediction and Chinese hit songprediction using increasing number of features.
8Jianyu Fan and Michael A. Casey6.16.1.1Effects on Results Using Different FeaturesFeature WeightsThevector gives us information about the weight of each feature. Figure 5 andFigure 6 display the result of models for UK hit songs and Chinese hit songs. The
Chinese songs was significantly above the baseline (50%). (Err 41.58%; p-value 0.03). But TWLR doesn’t work very well for predicting new UK hit songs. (Err 52.10%; p-value 0.29) As for SVM, we chose RBF kernel and gamma is equal 100. SVM model works great for predicting both new Chinese songs (err 39.25%; p-value 0.011) and UK hit