Transcription
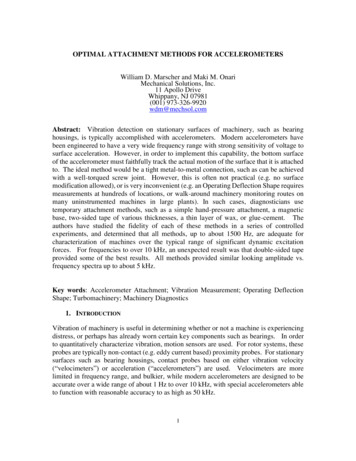
OPTIMAL ATTACHMENT METHODS FOR ACCELEROMETERSWilliam D. Marscher and Maki M. OnariMechanical Solutions, Inc.11 Apollo DriveWhippany, NJ 07981(001) 973-326-9920wdm@mechsol.comAbstract: Vibration detection on stationary surfaces of machinery, such as bearinghousings, is typically accomplished with accelerometers. Modern accelerometers havebeen engineered to have a very wide frequency range with strong sensitivity of voltage tosurface acceleration. However, in order to implement this capability, the bottom surfaceof the accelerometer must faithfully track the actual motion of the surface that it is attachedto. The ideal method would be a tight metal-to-metal connection, such as can be achievedwith a well-torqued screw joint. However, this is often not practical (e.g. no surfacemodification allowed), or is very inconvenient (e.g. an Operating Deflection Shape requiresmeasurements at hundreds of locations, or walk-around machinery monitoring routes onmany uninstrumented machines in large plants). In such cases, diagnosticians usetemporary attachment methods, such as a simple hand-pressure attachment, a magneticbase, two-sided tape of various thicknesses, a thin layer of wax, or glue-cement. Theauthors have studied the fidelity of each of these methods in a series of controlledexperiments, and determined that all methods, up to about 1500 Hz, are adequate forcharacterization of machines over the typical range of significant dynamic excitationforces. For frequencies to over 10 kHz, an unexpected result was that double-sided tapeprovided some of the best results. All methods provided similar looking amplitude vs.frequency spectra up to about 5 kHz.Key words: Accelerometer Attachment; Vibration Measurement; Operating DeflectionShape; Turbomachinery; Machinery Diagnostics1. INTRODUCTIONVibration of machinery is useful in determining whether or not a machine is experiencingdistress, or perhaps has already worn certain key components such as bearings. In orderto quantitatively characterize vibration, motion sensors are used. For rotor systems, theseprobes are typically non-contact (e.g. eddy current based) proximity probes. For stationarysurfaces such as bearing housings, contact probes based on either vibration velocity(“velocimeters”) or acceleration (“accelerometers”) are used. Velocimeters are morelimited in frequency range, and bulkier, while modern accelerometers are designed to beaccurate over a wide range of about 1 Hz to over 10 kHz, with special accelerometers ableto function with reasonable accuracy to as high as 50 kHz.1
In all cases the accuracy and repeatability depends upon how well the base of theaccelerometer is able to follow the true movement of the surface being measured. Thisrequires a stiff attachment, one that does not allow the accelerometer surface to part fromthe measured surface, and that also does not allow the natural frequency of the mountedaccelerometer to drift down into the intended measurement frequency range.2. APPLICATION HISTORYThe ideal attachment in this regard has always been considered metal-to-metal contact,enforced by a screw or bolt that enforces significant compression on the interface. Testinghas of course validated this as a means to achieve high fidelity of measurement, asdiscussed in references [1] to [7]. Depending upon the mass of the accelerometer and thestiffness of the mounting surface, this method can result in accurate and repeatablemeasurements to order of 50 kHz [4, 5, 6].However, screw-on attachment of an accelerometer requires tapping of the measuredsurface, which may not be permitted, or may not be practical (e.g. thin surface walls). Inother instances, it may be very time-consuming and inconvenient to perform such anattachment. This is the case in a typical Operating Deflection Shape (ODS) test, whenhundreds of measurements on many types of surfaces are required [7]. It is also the casefor walk-around routes in large plants, where technicians must measure key locations on alarge number of machines in a brief period of time, as they follow their routes.Therefore, other methods of attachment are typically used. One of the simplest and oldestis the use of hand-held pressure, by holding the accelerometer sensor base (sometimesthrough a needle point “stinger”) firmly against the measurement location. This methodis intuitively considered the least accurate attachment method, but in the authors’experience is typically more accurate than the other long-time method, a magnetic basefirmly screwed onto the accelerometer base. The problem with the magnetic base is thatat moderate frequency the magnetic surface can temporarily lose contact with the magnetictarget surface, especially at higher acceleration G levels.Other methods include the use of a thin layer of special sticky wax (only works for surfaceswith temperatures to about 100 F), a thin layer of glue/ cement (typically cyano-acrylic“superglue”), and double-sided sticky tape on the order of 8 mils (0.2 mm) thick. Studieshave been performed by various organizations, and opinion-based curves of adequateranges for each technique are published by such standards organizations as ISO (ISO5348[1]), Hydraulic Institute (ANSI/HI 9.6.4 [2]), and ANSI (ANSI S2.61 [3]).2
3. EXPERIMENTAL SET-UPAs stated in the references, there is general agreement that a screw-on connection is thehighest fidelity method of attaching an accelerometer to a machine for which vibration isto be measured. Finite element analysis confirms this conclusion, for flat-surface-on-flatsurface, where a torqued-up screw tightly compresses the two surfaces together sufficientlyso that the separation force from acceleration F ma, remains below the spring-likecompression force across the surface, F kx, where m is the accelerometer mass, k is theattachment interface stiffness, a is the acceleration being measured, and x is thecompression displacement of the combined accelerometer base and measured surfacematerial. Therefore, the author’s testing used the screw attachment method as the standardagainst which all other methods were compared.In the authors’ experiments, a 12 inch long, 2 inch wide, 2 inch thick cantilever beam wasattached to a stiff support over a 4 inch length at one end, firmly bolted to a massive slottedmachine foundation plate. The beam retained 8 inches of cantilevered free length, as shownin Figure 1. The modal characteristics of the final assembly were determined by impacttesting and an Operating Deflection Shape test, assisted by 3-D finite element analysis, andresulted in quantification of many natural frequency modes existed in the range of 100 Hzto 10 kHz. The test results were evaluated in the context of these modes (unavoidable in areal-life laboratory set-up), rather than assuming infinite stiffness of the attachment of thebeam “fixed end” to ground, or the base of the exciter to ground. A screwed-on referenceaccelerometer was attached to the bottom of the free end of the beam, 2.5 inch from thebeam end. The tested accelerometer/ attachment method in each test was attached to thebeam, on the top side of the beam, precisely on the opposite side of the referenceaccelerometer, as also shown in Figure 1.Figure 1: Acceleration attachment test set-up3
The tests consisted of exciting the end of the beam with an electrodynamic shaker, with anaccelerometer on its head to detect the acceleration spectrum input to the base of a stinger.For all acceleration measurements in the experimental set-up, MSI used off-the-shelfaccelerometers from a major supplier. The remaining equipment consisted of a NationalInstruments (NI) data acquisition (DAQ) system chassis model number NI PXIe-1073 withtwo cards of model number NI PXIe-4497, and a Labworks ET-132-2 shaker, driven by apower amplifier PA-138, with LabView based software control custom-programed by theauthors’ group.The LabView-based DAQ and FFT system was set up to read a frequency span of over10 kHz (after anti-aliasing), a resolution of ¼ Hz, an overlap of about 90%, and an updatetime of 0.375 sec. The analyzer was set to Peak Averaging mode throughout a frequencysweep. The shaker was set to sweep from 100 Hz to 10 kHz frequency (later testing to 20kHz will be reported in a future paper) at a constant rate of typically 20 Hz/s, at a nominallyconstant amplitude of 0.1 G at the base of the shaker stinger, where the stinger attached tothe shaker head. The shaker possessed system resonances at about 4800 Hz and 8500 Hz,which resulted in increased acceleration input to the stinger of order a 1 G when the shakerwas operating within several percent of those frequencies. The presence of the resonantfrequencies was not observed to affect the fidelity of the results.A 100 mV/g reference accelerometer was stud mounted to the underside of the cantileverbeam. For each attachment-tested accelerometer, after acquiring data at 0.1 G excitationacross the frequency range, the excitation amplitude was increased by increasing thecurrent fed to the Power Amplifier. Three amplitudes were tested (0.1 G peak, 0.3 G peak,and 1.0 G peak) for each tested attachment and each tested accelerometer type.Specifically, the procedures were repeated with different accelerometers to ensurerepeatability of the various attachment methods, or to investigate the effect ofaccelerometer mass on the result. Two different serial number (but same model) 100mV/gaccelerometers were tested, and were then replaced with a roughly 1/10th mass 10 mV/gaccelerometer. Each specific test was repeated four times to ensure consistency. Theresults were found to be quite consistent, and within the range of frequency and amplitudeinvestigated, the accelerometer size had no measurable effect. Therefore, the resultsreported will focus only on the effect of the attachment means.4. EXPERIMENTAL RESULTSA large volume of test data was acquired. The following figures show only representativeresults from the authors’ tests. Initially, plots (Figure 2 to 5) show the raw frequencyspectra from a given test, plotting the tested accelerometer and attachment as a blue line,and the reference accelerometer, bolted firmly in place to the beam, as the red line. Theseplots are log amplitude plots, which have the advantage of showing low amplitude and highamplitude responses on an equal basis, but can give the false impression of betterpercentage agreement than is actually present. Therefore, following the raw FFT plots, the4
results are re-plotted (Figures 6 to 12) from a statistical average of the repeatability testing,in this case in terms of the ratio of the tested accelerometer reading to that of the referenceaccelerometer, along with any phase difference between the two, over the tested range offrequency. This plotting method in turn can give a false impression of gross error,particularly at low amplitude anti-resonance “valleys”. Taken together, however, in theauthors’ opinion the two sets of plots give a reasonable indication of the capability of eachattachment method.Figure 2: Acceleration attachment test raw spectra, handheld-only attachment; blue is thesignal of the tested accelerometer & attachment, red is the reference accelerometer signalFigure 3: Acceleration attachment test raw spectra, magnet-only attachment; blue is thesignal of the tested accelerometer & attachment, red is the reference accelerometer signal5
Figure 4: Acceleration attachment test raw spectra, wax-only attachment; blue is thesignal of the tested accelerometer & attachment, red is the reference accelerometer signalFigure 5: Acceleration attachment test raw spectra, magnet-plus-wax attachment; blue isthe signal of the tested accelerometer & attachment, red is the ref. accelerometer signal6
.Figure 6: Acceleration attachment test comparison vs. reference, hand-held only.Figure 7: Acceleration attachment test comparison vs. reference, magnetic mount only7
.Figure 8: Acceleration attachment test comparison vs. reference, wax only.Figure 9: Acceleration attachment test comparison vs. reference, wax plus magnet mount8
.Figure 10: Acceleration attachment test comparison vs. reference, 3 mil thick tapeFigure 11: Acceleration attachment test comparison vs. reference, 7 mil thick tape9
Figure 12: Acceleration attachment test comparison vs. reference, 15 mil thick tape5. CONCLUSIONSThe test data indicated the following results:1. In the opinion of the authors, a screw compression attachment of flat-surfaceagainst-flat-surface is the “gold standard” of accelerometer attachment methods.This is consistent with the recommendations of international standards such as ISOand ANSI/HI.2. All of the tested attachment techniques were found to provide accurate andrepeatable results for frequencies from 1 Hz to 1.5 kHz, indistinguishable on apractical basis.3. The best non-damaging technique of accelerometer attachment was found to bemoderate thickness (7 mil, or 0.175 mm) double-sided fiber-reinforced paper tape.50% thinner tape did not produce as high fidelity results, nor did 2x thicker tape.The 7 mil thick tape attachment method provided reasonable fidelity from 1 Hz to7 kHz, apparently being thick enough to better fill in surface undulations than the3 mil thick tape, but not be so thick as to lose significant stiffness though thethickness of the tape as in the case of the 15 mil thick tape. Some fidelity was lostat specific natural frequency peaks and anti-resonance “zeros”, such that thereference accelerometer might report higher or lower vibration amplitude within /-1% of such zones. Except for the highest amplification factor natural10
frequencies (e.g. Q 30), the 7 mil tape provided good FFT curve shape fidelity, andpractically acceptable quantitative amplitude results to 19 kHz.4. The use of wax by itself provided results that were inferior to wax plus a magnet.5. The lowest fidelity method was shared by magnet-alone, hand-held alone, and waxalone. The magnet-alone was dependent on the flatness of the attachment surface.Handheld-alone was generally superior, but dependent on the firmness andsteadiness of the hand holding the accelerometer. Generally, any unsteadiness inthe hand holding affected frequencies at 30 Hz and below. The wax attachmentwas dependent to some extent on the thickness of the wax coating between theaccelerometer base and the target surface.6. ACKNOWLEDGMENTSThe authors would like to thank Senior Engineer Joseph Gruener, and co-op studentsDaniel Pruess and Alison Jago for their excellent work in setting up the experimentalhardware, and acquiring the data associated with this IRAD project.References[1] ISO 5348 [2018], “Mechanical Vibration and Shock- Mechanical Mounting ofAccelerometers”, International Standards Organization, Geneva Switzerland[2] ANSI/ HI 9.6.4 [2016], “Rotordynamic Pumps for Vibration Measurement andAllowable Values”, Hydraulic Institute, Parsippany NJ[3] ANSI S2.61-1989 (ASA 78-1989) [1989, Reaffirmed 2010], “Guide to the MechanicalMounting of Accelerometers”, American National Standards Institute and ASA, NewYork, NY[4] Bowers, S.V., Piety, K.R., and Piety, R.W. [1990], “Real-World Mounting ofAccelerometers for Machinery Mounting”, 4th Incipient Failure Detection Conference,EPRI, Philadelphia PA, October 1990[5] Peters, J. [2007], “Restrained by Resonance”, Uptime Magazine, May 2007[6] Corelli, D.A. [2015], “How Sensor Mounting Affects Measurements”, VibrationsMagazine, Vibration Institute, Oak Brook IL, May 2015[7] Marscher, W.D., and Onari, M.M., [2019], “Vibration Problems and Solutions forTurbomachinery and Centrifugal Pumps”, Short Course at MFPT2019, King of PrussiaPA, May 201911
The remaining equipment consisted of a National Instruments (NI) data acquisition (DAQ) system chassis model number NI PXIe-1073 with two cards of model number NI PXIe-4497, and a Labworks ET-132-2 shaker, driven by a power amplifier PA-138, wi