Transcription
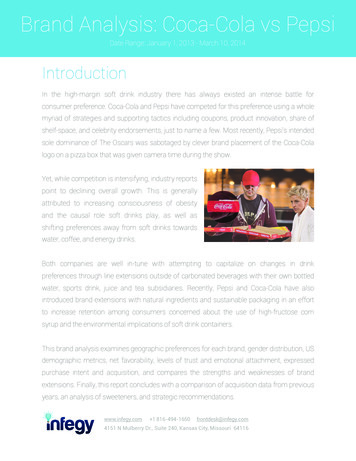
Brand Analysis: Coca-Cola vs PepsiDate Range: January 1, 2013 - March 10, 2014IntroductionIn the high-margin soft drink industry there has always existed an intense battle forconsumer preference. Coca-Cola and Pepsi have competed for this preference using a wholemyriad of strategies and supporting tactics including coupons, product innovation, share ofshelf-space, and celebrity endorsements, just to name a few. Most recently, Pepsi’s intendedsole dominance of The Oscars was sabotaged by clever brand placement of the Coca-Colalogo on a pizza box that was given camera time during the show.Yet, while competition is intensifying, industry reportspoint to declining overall growth. This is generallyattributed to increasing consciousness of obesityand the causal role soft drinks play, as well asshifting preferences away from soft drinks towardswater, coffee, and energy drinks.Both companies are well in-tune with attempting to capitalize on changes in drinkpreferences through line extensions outside of carbonated beverages with their own bottledwater, sports drink, juice and tea subsidiaries. Recently, Pepsi and Coca-Cola have alsointroduced brand extensions with natural ingredients and sustainable packaging in an effortto increase retention among consumers concerned about the use of high-fructose cornsyrup and the environmental implications of soft drink containers.This brand analysis examines geographic preferences for each brand, gender distribution, USdemographic metrics, net favorability, levels of trust and emotional attachment, expressedpurchase intent and acquisition, and compares the strengths and weaknesses of brandextensions. Finally, this report concludes with a comparison of acquisition data from previousyears, an analysis of sweeteners, and strategic recommendations.www.infegy.com 1 816-494-1650frontdesk@infegy.com4151 N Mulberry Dr., Suite 240, Kansas City, Missouri 64116
High Level MetricsCoke VolumeVolume: 299,841,466Favorability: 68%Pepsi VolumeVolume: 94,731,755Favorability: 67%Over the last 14-months, consumers around the world discussed Coca-Cola three timesmore than they discussed Pepsi. While consumer favorability for Coca-Cola was fairlyconsistent, favorability for Pepsi was highly volatile. This volatility for Pepsi led to overall loweraggregate favorability for the brand, although Pepsi saw the single highest favorability peakrecorded for either brand, at 89%.Pepsi’s favorability plummeted in May 2013 as aresult of their association with rapper Lil’ Wayne,who released a song with an inflammatory lyricabout a 14 year old who was brutally murdered.Pepsi quickly cut ties with the rapper, and as aresult, their favorability quickly rebounded. Highervolume and lower favorability for Pepsi occurredover several weeks in November and was a result ofseveral incidents. On the international stage, themost significant negative incident was a run of Swedish Pepsi ads depicting Portugal soccersuperstar Christiano Ronaldo as a voodoo doll suffering various forms of abuse.www.infegy.com 1 816-494-1650frontdesk@infegy.com4151 N Mulberry Dr., Suite 240, Kansas City, Missouri 64116
High Level MetricsFor Pepsi, the company’s escalation in favorability fromDecember 2013 through March 2014 was related toseveral high profile events, including sponsorship of theSuper Bowl half time show, as well as celebrity-centricads, the most popular being Pepsi Max and Nascar driverJeff Gordon teaming up for “Test Drive 2”. This period oftime was marked by fewer controversial events and riskycelebrity endorsements.Coca-Cola’s all time low in favorability resulted from coronersdeclaring the official death of a 31-year New Zealand womanas being related to excessive consumption of Coca-Cola.Conversations surrounding Coca-Cola skyrocketed in October2013 mainly due to a Diet Coke campaign that introducedTaylor Swift branded cans, supplemented by correspondingadvertisements.Volume increased again in November when Coca-Cola announced the company wassuspending its advertising in the Philippines so that it could donate its entire ad budget totyphoon relief efforts.Sentiment for Coca-Cola dropped again in February of 2014 in response to the company’sSuper Bowl advertisement known as #AmericaIsBeautiful, which ignited a debate aboutAmerican xenophobia on social media (more information). Coca-Cola’s consistent consumerfavorability stemmed from their aversion to more risky advertisements and celebrityendorsements. Although this strategy seemed effective at preventing negative reactions, thebrand also did not achieve near the levels of favorability experienced by Pepsi.www.infegy.com 1 816-494-1650frontdesk@infegy.com4151 N Mulberry Dr., Suite 240, Kansas City, Missouri 64116
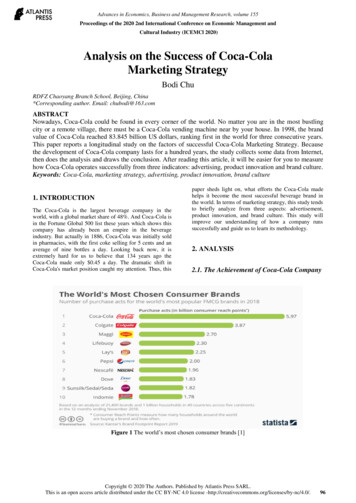
DemographicsIn the US, gender for Coca-Cola conversations was evenly distributed.Gender DistributionFor Pepsi, a clearer bias in preference was seen for men over women,with 54% to 46%. Higher conversation volume among men for Pepsi49%46%51%54%CokePepsiwas driven primarily by topics related to Pepsi’s presence within sports.Removing sports related conversations, men still remained the majority,but the split was reduced to 52:48.Coca-Cola consumers tended to belong to lower income households than their Pepsicounterparts; however, Coca-Cola consumers were seen to have a higher disposable income.This finding translates to Pepsi consumers living in areas where the cost of living is higher.This is further supported by the higher household values noted for these same Pepsiconsumers. Household size and higher education levels did not vary significantly from themean for either brand.Coca-Cola US Demographic DataPepsi US Demographic Datawww.infegy.com 1 816-494-1650frontdesk@infegy.com4151 N Mulberry Dr., Suite 240, Kansas City, Missouri 64116
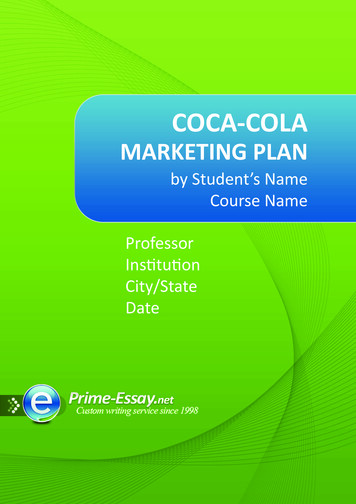
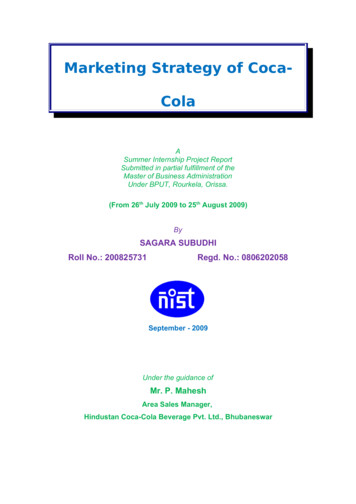
Global Brand AnalysisGlobally, we see a strong worldwide preference for Coca-Cola, with 71% of the globalpopulation’s discussion volume going to Coca-Cola, compared to just 29% for Pepsi.However, Pepsi was the brand of choice in several notable countries including Saudi Arabia,Egypt, and Norway.Around the world, men talk about both Pepsi and CocaCola more than women. Yet there were several countrieswhere conversations were consistently driven more bywomen, including Russia, Saudi Arabia, Sweden, Sudan,and Myanmar. Pepsi had a greater variance in genderparticipation globally, the majority of which occurred inAfrica and the Middle East.In the United States, Coca-Cola held less of an advantage,albeit still a strong majority, with 65% of the US populationdiscussing Coca-Cola over Pepsi. Pepsi realized a slightlystronger position in the US Midwest with 38% of theconversations discussing Pepsi compared to the overallmean of 35%.www.infegy.com 1 816-494-1650frontdesk@infegy.com4151 N Mulberry Dr., Suite 240, Kansas City, Missouri 64116
Themes and EmotionsCoca-Cola measured more positively in all emotional categories, with the highest marginsoccurring in emotions related to joy and trust. More consumers discussed themes related toacquisition for Pepsi than for Coca-Cola; however, when discussing future intent to purchasemore consumers discussed Coca-Cola.Alarmingly, carcinogens were the most referenced negative health topic for Pepsi.Coca-Cola was also more positively discussed in regard to taste, while more negatively forhealth. Aspartame was the most referenced negative health topic for Coca-Cola, relating tothe artificial sweetener found in many Coca-Cola and Pepsi brand extensions. Alarmingly,carcinogens were the most referenced negative health topic for Pepsi. The topic wasdiscussed in regard to the additive 4-methylimidazole, or 4-MeI, used to create the caramelcoloring in many Pepsi products. Pepsi has repeatedly vowed to change the formula in orderto eliminate the potentially harmful additive.www.infegy.com 1 816-494-1650frontdesk@infegy.com4151 N Mulberry Dr., Suite 240, Kansas City, Missouri 64116
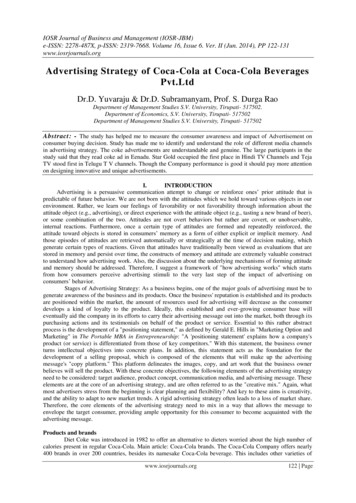
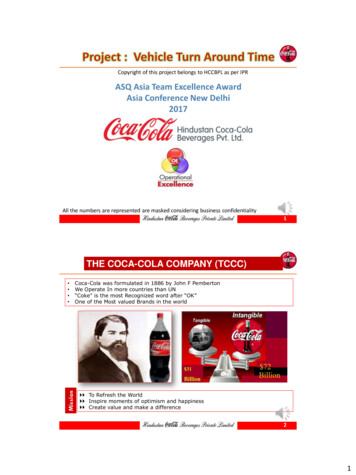
Coca-Cola vs Pepsi ScoreboardnerWinCoca-ColaCoca-Cola demonstrated clear preference in every aspect, with the exception of theacquisition category and a draw on positive and negative passion indexes. The only categorywhich Pepsi excelled over Coca-Cola was stated acquisition by a margin of just 6%. Thismeans that Pepsi consumers, when speaking of their brand, were slightly more likely tobroadcast their purchase behavior compared with Coca-Cola’s 731,755Coca-Cola217%Brand Favorability68%67%Coca-Cola1%Positive Passion IndexHighHighDraw-Negative Passion IndexLowLowDraw-Global Geographic Preference20615Coca-Cola1273%US States Preference500Coca-Cola Trust (positive)2.3%1.6%Coca-Cola44%Taste (positive)11.4%9.4%Coca-Cola21%Acquisition (positive)8.5%9%Pepsi6%Purchase Intent (positive)3.8%2.7%Coca-Cola41%Volumewww.infegy.com 1 816-494-1650frontdesk@infegy.com4151 N Mulberry Dr., Suite 240, Kansas City, Missouri 64116
Coca-Cola Brand ExtensionsDiet CokeVolume: 16,464,373Favorability:: 61%Coke ZeroCherry CokeVolume: 2,756,808Favorability: 74%Volume: 3,122,680Favorability: 63%Vanilla CokeVolume: 2,924,817Favorability: 71%Coca-Cola’s four most discussed brand extensions were Diet Coke, Cherry Coke, Coke Zero,and Vanilla Coke. Diet Coke was overwhelmingly more popular than Coca-Cola’s other brandextensions, but also drove more negative conversations for the extension and the brand as awhole. Negative remarks were most often related to health concerns with aspartame, theartificial sweetener most commonly used in diet beverages.A large portion of conversations about Diet Coke and Coke Zero focused on the healthconcerns and pop culture debate on the likability of celebrity sponsors. In the period betweenSeptember 2013 and November 2013 several posts were created and shared regarding thelong term health consequences of aspartame in Diet Coke. The original post proclaimed,“Numerous Studies Have Found No Link Between Long Term Aspartame Exposure AndCancer In Humans.” In response, commenters were quick to assert other long-term healthconsequences, particularly kidney problems, bone density loss, and high blood pressure.www.infegy.com 1 816-494-1650frontdesk@infegy.com4151 N Mulberry Dr., Suite 240, Kansas City, Missouri 64116
Coca-Cola Brand ExtensionsRegardless of conversation volume, the flavored brand extensions tended to maintain arelatively flat favorability curve. More consistent favorability for Cherry and Vanilla Coke wastied to the difference in topics focused on by consumers. Rather than topics about artificialsweeteners and celebrity endorsements, the flavored products tended to have much strongerassociations with taste, preference, and pairing with food and/or experiences. For example,words like love, favorite, better, best, pizza, movie, and food were used much more often inregard to the flavored product lines.There was a wide degree of variance inpreference and favorability among men andwomen for the brand extensions. While generalconversations for the Coca-Cola brand as awhole were split almost evenly, brand extensionconversations were participated in much moreoften by women. Diet Coke saw the biggest biasin gender share of voice, with 62% of the dialogcoming from women, compared to 49% forCoca-Cola overall.This shift in gender distribution for Diet Coke wascaused by women expressing greater concernover the health implications of artificialsweeteners and more displeasure with the TaylorSwift Diet Coke campaigns. These implicationsdrove down favorability to a concerning 44%, 28%lower than for Coca-Cola overall. In contrast,women spoke very positively about Vanilla Coke,elevating it to the most favorably discussedproduct line in the brand extensions category.www.infegy.com 1 816-494-1650frontdesk@infegy.com4151 N Mulberry Dr., Suite 240, Kansas City, Missouri 64116
Coca-Cola Brand ExtensionsDiet Coke, also referred to as Coca-Cola Light in certain geographies, was the mostdiscussed brand extension worldwide, capturing 63% of the top brand extensionconversations. However, there were several markets where the focus shifted.Coke Zero was discussed more in South America than Diet Coke, capturing the highest shareof voice in 7 out of 13 of the continent’s countries. The brand was also talked about more inSpain, Greece, Iceland, and the Philippines. The most popular topic of conversation related toCoke Zero was Metallica En La Antártida, or Metallica in Antarctica, a Coke Zero sponsoredconcert that took place in December 2013.During this time period, the most common topicsfor Diet Coke in these same countries were MarcJacobs and Taylor Swift. Worldwide, an extremedisparity existed during this time frame betweenthe star-power carried by Taylor Swift andMetallica, heavily weighted in favor of Taylor Swift.However, further research uncovered a strongpreference for Metallica over Taylor Swift in severalSouth American countries. This finding haspowerful implications for using social mediaresearch to perform celebrity preference analysis bygeography in order to maximize campaign effectiveness and cost efficiency.www.infegy.com 1 816-494-1650frontdesk@infegy.com4151 N Mulberry Dr., Suite 240, Kansas City, Missouri 64116
Coca-Cola Brand ExtensionsThe purchase indicators, purchase intent andacquisition, belong to a set of themes that canbe detected in conversations. In addition tovolume, themes also track sentiment, reportingshare of positive versus negative. For instance,a negative appearance for taste would meanthat the analyzed comment stated the subjectbeing referenced does not taste good.In this report, purchase intent and acquisition were calculated by taking the number ofpositive appearances for a theme into the total number of theme appearances. As a result,the percentages referenced above are not specific to all conversations, but onlyconversations containing themes. Due to how Infegy’s system detects and calculatesthemes, the percentages referenced are also not inherently biased to differences in volume.Take for example the volume disparity between Coke Zero and Diet Coke. Diet Coke wasmentioned in nearly 13 million more conversations than Coke Zero, yet conversations aboutacquisition occurred in the same frequency of 11% of all thematic conversations.Understanding this, both Diet Coke and CokeZero had a higher prevalence of broadcastedpurchase indicators than Cherry or VanillaCoke. This is surprising in that both CherryCoke and Vanilla Coke were recognized ashaving higher overall favorability as well ashigher favorability for taste. An interestinginsight into one reason for this were asignificant number of posts discussing difficulty in being able to find Vanilla Coke at thestores in their geographic region.www.infegy.com 1 816-494-1650frontdesk@infegy.com4151 N Mulberry Dr., Suite 240, Kansas City, Missouri 64116
Coca-Cola Brand Extensions ScoreboardnerWinDiet CokeDiet Coke won several key categories within Coca-Cola’s brand extension analysis; however,there were several other important categories Diet Coke failed to capture, including brandfavorability and taste. Specific to Diet Coke and Coke Zero, overall favorability for the brandswas seen to be largely affected by consumer concerns about aspartame. As a whole, allbrand extensions scored low on perceptions of health, mainly in regard to links betweensweetened soft drinks and ,8083,122,6802,924,817Diet CokeBrand Favorability61%74%63%71%Cherry CokePositive Passion IndexLowLowLowLowDrawNegative Passion IndexLowVery LowVery LowVery LowDrawGlobal Geographic Preference20615264Diet CokeUS Geographic Preference50000Diet CokeHealth (positive)58%58%55%58%DrawTaste (positive)67%73%68%75%Vanilla CokeAcquisition (positive)11%9%11%8%DrawPurchase Intent (positive)8%4%5%3%Diet CokeVolumewww.infegy.com 1 816-494-1650frontdesk@infegy.com4151 N Mulberry Dr., Suite 240, Kansas City, Missouri 64116
Pepsi Brand ExtensionsDiet PepsiVolume: 1,078,209Favorability: 64%Pepsi NextVolume: 318,216Favorability: 80%Pepsi MaxVolume: 2,349,168Favorability: 69%Pepsi’s most discussed brand extensions were Diet Pepsi, Pepsi Next, and Pepsi Max. UnlikeCoca-Cola, flavored soft drinks were completely absent in regard to Pepsi’s most discussedextensions. Even so, much like Diet Coke, consumers were just as concerned that Diet Pepsiand Pepsi Max contain the artificial sweetener aspartame. Prior to June 2013, Pepsi Next hadalso used aspartame as a sweetener but has since switched to stevia. The switch promptedpositive consumer reactions, leading to an increase in overall brand favorability.Pepsi Max reached peak favorability for the 14-month period through a clever revisitation toan earlier campaign called Pepsi Max & Jeff Gordon Present: “Test Drive”. The campaigncapitalized on an article authored by blogger, Travis Okulski, who called in to question theauthenticity of the original video prank featuring Jeff Gordon. The article was widely shared.Jeff Gordon and Pepsi levied their payback on Okulski by pulling off the same prank on him.By March 10, 2014, the YouTube video had amassed 14.5 million views.www.infegy.com 1 816-494-1650frontdesk@infegy.com4151 N Mulberry Dr., Suite 240, Kansas City, Missouri 64116
Pepsi Brand ExtensionsMuch like Diet Coke, women were seen to have amuch stronger preference for Pepsi’s diet offering.Pepsi Next and Pepsi Max, both more maleoriented in their marketing strategies, hit theirtarget consumers effectively, as each wasdiscussed to a greater degree by men compared towomen. Pepsi Max was referenced most by menin relation to racing, reinforcing Jeff Gordon as apowerful spokesperson for the brand. Male dominated Pepsi Next conversations most oftenreferenced the Super Bowl and football.Diet Pepsi, while discussed in half as manyconversations as Pepsi Max, received much morefrequent mentions of acquisition and purchase intent.Interestingly, purchase intent and acquisition werediscussed 70% more by women on average. Thispartially explains why Diet Pepsi registered higher inthese themes overall as the majority of Diet Pepsiposts were created by women. Further analysis also revealed a difference in conversationtopics. Both Pepsi Next and Pepsi Max were found to be discussed more often in reference totheir advertising rather than the attributes or paired experiences of the drinks on their own.In contrast, Diet Pepsi conversations were focusedmore on the drink itself with adjectives including love,taste, good, and great, as well as complimentarytopics like food, friends, and movies. Finally, PepsiNext, the only product that no longer containsaspartame, was viewed more favorably in terms ofhealth and taste.www.infegy.com 1 816-494-1650frontdesk@infegy.com4151 N Mulberry Dr., Suite 240, Kansas City, Missouri 64116
Pepsi Brand ExtensionsPepsi’s brand extensions had a varied distribution of global preference. More countriespreferred Pepsi Max, but a greater percentage of the overall global population preferred DietPepsi. Europe in particular showed a strong inclination for Pepsi Max over Diet Pepsi,capturing 63% of the total share between the three brands.Although Pepsi Next was not found to have asignificant portion of the overall conversationglobally, the brand did see a stronger positionwithin the United States, capturing 19% of thetotal conversation share. A thought-provokingdiscovery, concentrated preference was foundfor Pepsi Max in the Southeast region of the US.By filtering to this area, it was found that PepsiMax conversations were mainly focused onNASCAR, Jeff Gordon, and an advertisementfeaturing NBA basketball star, Kyrie Irving,called “Uncle Drew.”Further supporting findings from the thematic research on the previous page, higher volumesof conversation for Pepsi Max and Pepsi Next were witnessed primarily because of celebrityendorsements as well as advertising campaigns.www.infegy.com 1 816-494-1650frontdesk@infegy.com4151 N Mulberry Dr., Suite 240, Kansas City, Missouri 64116
Pepsi Brand Extensions ScoreboardDrawDiet PepsiPepsi NextThe draw between Diet Pepsi and Pepsi Next is an intriguing result. The categories won byDiet Pepsi, namely consumer preference, acquisition, and purchase intent, are all positivelyrelated to sales. However, Pepsi Next won taste and health, product attributes that would bethought to be the most important aspects considered during the purchase phase. PepsiNext’s victory in these categories reinforces the brand’s recent marketing strategies focusedon the taste and more natural ingredients with messaging like, “serious taste, sweetenednaturally”. In comparing conversation volume between the three brands, Pepsi Nextaccounted for just 8.4% of the overall conversation. From this, it seems Pepsi Next’s biggestpitfall was consumer 68Pepsi MaxBrand Favorability64%78%69%Pepsi NextPositive Passion IndexLowLowLowDrawNegative Passion IndexLowVery LowVery LowDrawGlobal Geographic Preference63886Pepsi MaxUS Geographic Preference31118Diet PepsiHealth (positive)51%52%69%Pepsi NextTaste (positive)67%64%71%Pepsi NextAcquisition (positive)15%10%8%Diet PepsiPurchase Intent (positive)9%3%5%Diet PepsiVolumewww.infegy.com 1 816-494-1650frontdesk@infegy.com4151 N Mulberry Dr., Suite 240, Kansas City, Missouri 64116
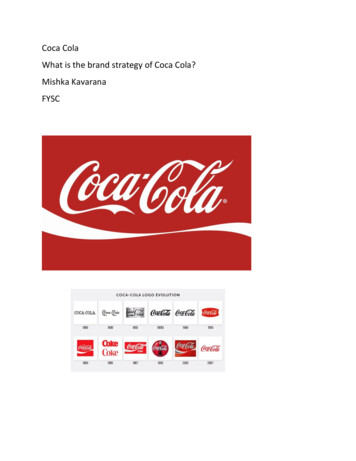
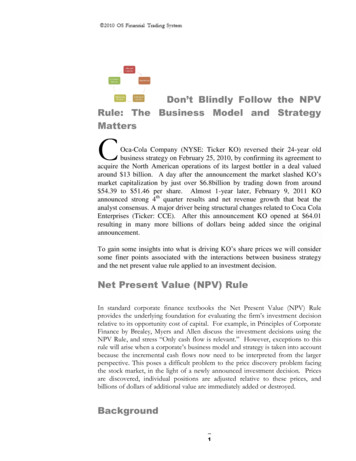
Coca-Cola vs Pepsi HistoricalCoca-Cola vs Pepsi Positive Acquisition (Share of Universe) 1/1/2007 - 3/10/2014The above chart maps out stated positive acquisition for Coca-Cola and Pepsi as a percent oftotal social conversations from January 1, 2007 through March 10, 2014. Because thenumber of online conversations have increased, and continue to increase, this form ofmeasurement gives a far more accurate view than simply using volume.What is evident is that Coca-Cola and Pepsi aredeclining in the number of conversationsreferencing acquisition. This is in contrast withgeneral conversations about the brands, whichhave increased overall, in part due to Coca-Colaand Pepsi leveraging social marketing. However, aswitnessed in both the Coca-Cola and Pepsi brandextension analyses, brand conversations arefrequently focused more on the celebrity endorsersthan the brand or product attributes.From this it seems that although both brands remain top-of-mind for consumers, thisconstant stream of awareness is not increasing consumption. In fact, a report by Mintelpoints to further declines in soft drink sales through 2017.www.infegy.com 1 816-494-1650frontdesk@infegy.com4151 N Mulberry Dr., Suite 240, Kansas City, Missouri 64116
Sweetener ProfileIn the general sweetener conversation, aspartame was talked about the least and with thelowest favorability, coming in at 43%. However,within conversations specifically about Coca-Cola,aspartame was the most referenced sweetener, italso received the lowest favorability. For Pepsi,aspartame was the second most referencedsweetener and also the most negatively discussed.One of the top concerns consumers voiced aboutaspartame was cancer, followed by other healthissues of obesity, childhood development, diabetes, and depression.The effects of high fructose corn syrup (HFCS) were also a major concern for consumers,coming in as the number one referencedsweetener for Pepsi, and second most referencedfor Coca-Cola. Favorability, while higher than foraspartame, was also very low. Although cancer isabsent from the majority of conversations abouthigh fructose corn syrup, consumers have similarhealth concerns about the sweetener in regards toobesity and childhood development. Additionalconcerns were voiced about the implications of high fructose corn syrup coming fromwww.infegy.com 1 816-494-1650frontdesk@infegy.com4151 N Mulberry Dr., Suite 240, Kansas City, Missouri 64116
Sweetener ProfileWorldwide, stevia received the majority of the share of the conversation and the highestoverall favorability. For Pepsi and Coca-Cola, stevia represented the lowest share of theconversation, but was overwhelmingly discussed with the highest favorability. Surprisingly,raw sugar did not achieve much higher favorability than high fructose corn syrup.Raw Sugar ThemesIn comparison to stevia, raw sugar, while notspoken of as positively, was comparablethematically, achieving higher favorability fortaste, slightly more acquisition and equal intentto purchase. Again where stevia outshonesugar was in the health theme.Stevia ThemesLooking back through 2007, stevia conversationvolume and consumer favorability havegradually increased year-to-year. What isevident from this is that even when subjected togreater scrutiny, consumer perceptions of stevia persist in being positiveJust as with discussions about the diet brands,women were found to be more involved insweetener discussions than men. Even greaterparticipation by women was found inconversations started by parents on the subjectof sweeteners and their children with motherscontributing 62% of all posts.www.infegy.com 1 816-494-1650frontdesk@infegy.com4151 N Mulberry Dr., Suite 240, Kansas City, Missouri 64116
Conclusion & MethodAlthough Coca-Cola and Pepsi remained top-of-mind for consumers, according to bothindustry reports and social media analysis, this constant stream of awareness did notincrease consumption. Instead, what increased was growing consumer concern over thesweeteners used both in the original formulas and the diet and light brand extensions meantto serve as healthier options. Whereas the scrutiny for aspartame was previously concernedwith the ingredient’s benefits for fighting obesity, frightening topics like cancer, depression,and childhood development problems now dominate the majority of conversations. Rawsugar and high fructose corn syrup are still highly correlated with obesity in the mind ofconsumers. However, high fructose corn syrup carries with it much greater concerns of longterm health problems. The only sweetener that was viewed favorability and not commonlyassociated with major health concerns was stevia.In conjunction with increasing health consciousness, the shift in consumer preference awayfrom soft drinks means that retention must be a priority for soft drink makers going forward.Recognizing this, Coca-Cola and Pepsi should tread carefully not to alienate currentcustomers loyal to their brands. The most detrimental incidents to brand equity for bothbrands occurred due to their choices in celebrity endorsers and resulted in social campaignscalling for consumers to boycott.Research MethodsThis report was created using Infegy Atlas. Infegy Atlas is a social media monitoring andresearch platform that utilizes proprietary automated natural language processingtechnology and Infegy’s in-house repository of online dialog dating back to 2007.Infegy Atlas operates on a simple but powerful query language similar to what you would usefor a Google search but with more operators, filters and options. The queries used for thisreport are available upon request.www.infegy.com 1 816-494-1650frontdesk@infegy.com4151 N Mulberry Dr., Suite 240, Kansas City, Missouri 64116
Global Brand Analysis Globally, we see a strong worldwide preference for Coca-Cola, with 71% of the global population's discussion volume going to Coca-Cola, compared to just 29% for Pepsi. However, Pepsi was the brand of choice in several notable countries including Saudi Arabia, Egypt, and Norway.