Transcription
FGCU FacultySalary Compression and Inversion StudySubmitted to:Steve BelcherSpecial Assistant for Faculty AffairsOffice of Academic AffairsFlorida Gulf Coast UniversitySubmitted by:The Balmoral Group, LLCResponsible Office:341 North Maitland Avenue, Suite 100Maitland, FL 32751Tel: 407.629.2185, ext. 104 Fax: 407.629.2183Cell: 407.415.2964Contact Person: Valerie Seidelvseidel@balmoralgroup.usDecember 2011(Revised January 2012)
Table of ContentsI.Literature Review. 1II.Rank Ratio Analysis . 3III.Data and Models. 5IV.Results. 6Appendix A. Rank Ratio Comparisons between FGCU and Peer Groups by 2‐Digit CIP . 18Appendix B Predicted and Actual Salary Comparisons by 2‐Digit CIP . 31Works Consulted . 38List of Tables and FiguresTable 1. FGCU CIP Codes . 7Table 2. University Wide Explanatory Variables . 8Table 3. Health and Business Explanatory Variables . 8Table 4. Linear Regression Results . 15Table 5. Librarian Regression Results . 17Table 6. Advisor Regression Results. 17Figure 1. FGCU Rank Ratio Analysis . 3Figure 2. CIP 51 Rank Ratio Analyses . 4Figure 3. CIP 52 Rank Ratio Analyses . 5Figure 4. Salary Comparison University‐Wide . 9Figure 5. Predicted Salary by Rank with Faculty Experience . 10Figure 6. Predicted Faculty Salaries with Experience by Rank for CIP 51 . 12Figure 7. Predicted Faculty Salaries with Experience by Rank for CIP 52 . 13FGCU Faculty Salary Compression and Inversion StudyDecember 2011 (Revised January 2012)
FGCU Faculty Salary Compression and Inversion StudyThe Balmoral Group is pleased to present this Executive Summary Report for the analysis of salarycompression and inversion at Florida Gulf Coast University (FGCU). Our analysis has relied on twoseparate but complementary modeling approaches: rank ratio analysis and regression analysis. The rankratio analysis was used to identify potential compression and inversion at the 2‐digit Classification ofInstructional Programs (CIP) code level for each of FGCU’s 25 2‐digit CIP codes1. Peer group salary levelsthroughout this report are determined using CUPA survey results of 78 peer institutions. The regressionanalysis was used to statistically test whether identified compression and inversion were significant.Before summarizing the results of our analysis we briefly discuss the literature related to compressionand inversion studies in section I. In section II we summarize our rank ratio analysis. In section III and IVwe discuss our regression models and present their results.I. Literature ReviewFor the past two decades researchers have focused on the role of salary compression and its effects onwage differentials in higher learning institutions. Salary compression occurs when newly hired, or junior,faculty members receive a rate of pay that approaches, or is approximately equal to, the rate paid tofaculty of higher, or senior, professional rank. A more extreme version of salary compression, salaryinversion, arises when junior faculty members earn higher salaries than senior employees. Although insome instances salary compression, and particularly salary inversion, may be a form of wagediscrimination, salary compression is not in itself a problem. Assuming that institutions value humancapital, it is defensible to grant junior employees with specialized skills and teaching qualifications ahigher salary than those with fewer credentials.The classification of junior and senior faculty members is an important factor in constructing anappropriate compression model. A rather narrow definition by Snyder et al. (1992) defined juniormembers as individuals with less than one year of experience at a university, while Toutkoushian (1998)classified junior faculty as assistant professors with less than three years of service at a university andfewer than six years of professional experience in academia. Twigg et al. (2002), on the other hand,defined a junior faculty member as someone with fewer than three years university experience andfewer than three years professional experience before being hired. Another way to define members asjunior faculty is to include not only assistant professors but also newly promoted associate professorsand full professors. This process allows for both between‐rank and within‐rank comparisons. It shouldbe noted, however, that tenure was a factor in these studies and only three faculty ranks, AssistantProfessor, Associate Professor and Professor, were considered. These conditions differ from those atFGCU, which does not have a tenure system and includes four faculty ranks, Instructor, AssistantProfessor, Associate Professor and Professor.1CIP codes are codes assigned to classify instructional areas for benchmarking against national statistics, and aretracked by CUPA (College and University Professional Association for Human Resources).FGCU Faculty Salary Compression and Inversion StudyDecember 2011 (Revised January 2012)1
There are two methods of analysis most common to this type of study, rank ratio analysis and regressionanalysis. The rank ratio method compares mean salaries between ranks. Salary ratios are calculated bydividing the mean salary of each rank by the mean salary in a given discipline. Since the ratios arenormalized with the same denominator, they can be compared to check for compression. Any ratio of alower rank that approaches (or is greater than) the ratio of a higher rank displays symptoms ofcompression (or inversion). However, factors such as time in rank and tenure that may be significantdeterminants of salary differences are not included in the rank ratio analysis.The regression method is able to control for these other factors when testing for salary compression orinversion. The independent variables determining salary that are typically incorporated into regressionequations include rank, time in rank, and tenure. However, since FGCU does not have a tenure system,the tenure variable will not be included in statistical analysis. Market conditions can be represented bydiscipline and year of hire, while merit components are considered to be “institutionalized” into themeasures of discipline, rank, and time in rank as by Snyder et al. (1992). CIP codes at the two digit levelcan be used as dummy independent variables to control for average salary differences across academicfields.FGCU Faculty Salary Compression and Inversion StudyDecember 2011 (Revised January 2012)2
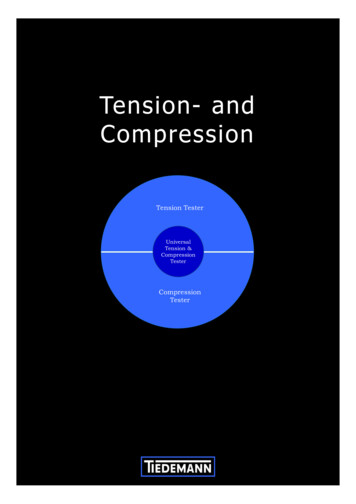
II.Rank Ratio AnalysisRank ratios were compared at the University level and by 2‐digit CIP code. As shown in figure 1 below, acomparison of salaries by rank (Instructor, Assistant Professor, Associate Professor, and Full Professor)for all FGCU faculty members, without accounting for CIP, suggests salaries progressively increase asfaculty members rise through the university ranks. Average salaries for Instructors and AssistantProfessors are less than the overall average of all faculty members combined. Instructors earn less (onaverage) than Assistant professors. Average Salaries for Associate Professors and Full Professors areabove the university average, with Full Professors earning (on average) more than Associate Professors.Figure 1. FGCU Rank Ratio AnalysisFlorida Gulf Coast University160.0%FGCU FacultyPeer Group nstructor Assistant AssociateFullProfessor Professor ProfessorInstructor Assistant AssociateFullProfessor Professor ProfessorComparing FGCU rank ratios to the faculty peer group data obtained through CUPA tells a similar story.Each successive university rank for faculty in the peer group earns (on average) a higher percentage ofthe group average salary, with Full Professors earning the highest salaries. Making these rank ratiocomparisons at the 2‐digit CIP tells a similar story for 23 out of the 25 CIP FGCU 2‐digit CIP categories(see Appendix A).Rank ratio analysis for faculty in CIP 51, Health Professionals and Related Programs, shown in figure 2below, suggests salary inversion is occurring at the ranks of Instructor and Assistant Professor, whereinstructors are (on average) earning a higher percentage of the CIP 51 average salary than facultymembers at the rank of Assistant professor. The peer group comparison does not show this inversion,which suggests the FGCU differences in salary are not market driven.FGCU Faculty Salary Compression and Inversion StudyDecember 2011 (Revised January 2012)3
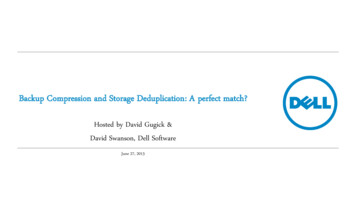
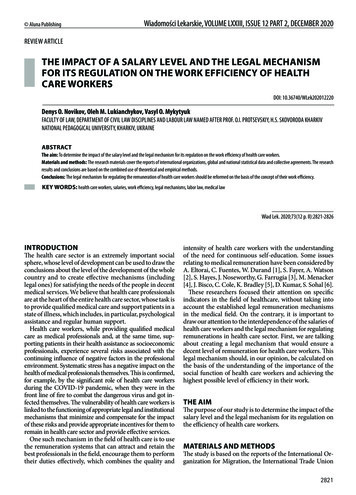
Figure 2. CIP 51 Rank Ratio AnalysesCIP 51HEALTH PROFESSIONS AND RELATED PROGRAMS140.0%FGCU FacultyPeer Group tor Assistant AssociateFullProfessor Professor ProfessorInstructor Assistant AssociateFullProfessor Professor ProfessorFaculty salaries in the Business College, CIP 52, are not showing signs of inversion; however, as indicatedin figure 3 below, there are signs of compression at the ranks of Assistant Professor and AssociateProfessor. Salary compression is also revealed in the peer group data for these faculty ranks, suggestingthe compression at FGCU is market driven.FGCU Faculty Salary Compression and Inversion StudyDecember 2011 (Revised January 2012)4
Figure 3. CIP 52 Rank Ratio AnalysesCIP 52BUSINESS, MANAGEMENT, MARKETING, AND RELATED SUPPORTSERVICESFGCU Faculty140.0%Peer Group tor Assistant AssociateFullProfessor Professor ProfessorInstructor Assistant AssociateFullProfessor Professor ProfessorThe salaries for FGCU faculty members in the remaining 23 2‐digit CIP categories and Librarians do notappear to show signs of either compression or inversion. Peer group data are available through CUPA formany of these CIP codes. However, peer group comparisons cannot be made for faculty members inAgriculture, Agricultural Operations, and Related Services; Legal professions and Studies; andMulti/Interdisciplinary Studies. All rank ratios are presented in Appendix A.III.Data and ModelsData was assembled for all faculty, librarian reference staff and advisor staff at FGCU as of August 26,2011. The following data was included in the analysis: Date of hire and years of FGCU service Current rank Years at rank Current 9‐month salaryDescriptive statistics were generated to review any data anomalies and identify outliers or unusualtrends that may require further investigation. Several rounds of data preparation were conducted toFGCU Faculty Salary Compression and Inversion StudyDecember 2011 (Revised January 2012)5
ensure that all CIP code assignments and other classification processes were consistently applied to alldata used.Regression modeling was conducted to estimate linear and log models. Estimated models included asimple pooled model without controlling for faculty CIP; one‐way fixed effects models that control foreither faculty CIP, rank, or college that faculty belong; and two‐way fixed effects models that controlledfor either faculty CIP and rank, colleges faculty belong to and rank, and faculty CIP and college. Theresults of the best‐fit model are summarized below.IV.ResultsBased on the results of the rank ratio comparisons, the following regression was estimated:Y C X Z Where Y is actual 9‐month equivalent salary, C is a vector of 25 CIP specific constants, X is vector ofuniversity‐wide independent variables that explain salary differences at the University level, and Z isvector of independent variables for subcategories of CIP fields that may differ from University‐widesalary patterns. Table 1 shows the specific CIP codes used as constants (vector C) in the regressionanalysis.The regression model to identify statistical evidence of salary compression and inversion was estimatedusing appropriate fixed‐effects controls for salary differences by 2‐digit CIP, controls for additionaldifferences in salary depending on years at rank, and specific controls for the rank of faculty members inthe health professions (CIP 51) and Business College (CIP 52). The definitions for variables used in ourmodel are described below.FGCU Faculty Salary Compression and Inversion StudyDecember 2011 (Revised January 2012)6
Table 1. FGCU CIP CodesCIP‐TwoDigit 5254CIP NameAGRICULTURE, AGRICULTURE OPERATIONS, AND RELATED SCIENCESNATURAL RESOURCES AND CONSERVATIONAREA, ETHNIC, CULTURAL, GENDER AND GROUP STUDIESCOMMUNICATION, JOURNALISM AND RELATED PROGRAMSCOMPUTER AND INFORMATION SCIENCES AND SUPPORT SERVICESEDUCATIONENGINEERINGFOREIGN LANGUAGES, LITERATURES, AND LINGUISTICSLEGAL PROFESSIONS AND STUDIESENGLISH LANGUAGE AND LITERATURE/LETTERSLIBERAL ARTS AND SCIENCES, GENERAL STUDIES AND HUMANITIESBIOLOGICAL AND BIOMEDICAL SCIENCESMATHEMATICS AND STATISTICSMULTI/INTERDISCIPLINARY STUDIESPARKS, RECREATION, LEISURE AND FITNESS STUDIESPHILOSOPHY AND RELIGIOUS STUDIESPHYSICAL SCIENCESPSYCHOLOGYHOMELAND SECURITY, LAW ENFORCEMENT, FIREFIGHTING AND RELATED PROTECTIVESERVICEPUBLIC ADMINISTRATION AND SOCIAL SERVICE PROFESSIONSSOCIAL SCIENCESVISUAL AND PERFORMING ARTSHEALTH PROFESSIONS AND RELATED PROGRAMSBUSINESS, MANAGEMENT, MARKETING, AND RELATED SUPPORT SERVICESHISTORY GENERALTable 2 shows the university‐wide variables used in the regression model: rank and years at rank. Basedon the rank ratio analysis described in the previous Section, two CIP codes show the possibility of salarycompression. These two CIP codes are 51 (Health Professions) and 52 (Business). Because these CIPcodes coincide with two specific colleges with 46 and 62 faculty members respectively, it is possible totest whether salary patterns in these two CIP codes differ from the University as a whole. The goal is toensure that any possible compression issues in these specific CIP codes are not masked by University‐wide trends. Table 3 shows the variables that are used to analyze these two subgroups.FGCU Faculty Salary Compression and Inversion StudyDecember 2011 (Revised January 2012)7
Table 2. University Wide Explanatory CYRPROFJRASTDescriptionAssistant ProfessorAssociate ProfessorFull ProfessorYears of Experience at RankAssistant Professor Years of Experience at RankAssociate Professor Years of Experience at RankFull Professor Years of Experience at RankJunior Assistant ProfessorTable 3. Health and Business Explanatory ROFBJASSTDBUSHIDescriptionHealth (51) Assistant Professor Years at RankHealth (51) Associate Professor Years at RankHealth (51) Full Professor Years at RankHealth (51) Junior Assistant ProfessorBusiness (52) Assistant Professor Years at RankBusiness (52)Associate Professor Years at RankBusiness (52) Full Professor Years at RankBusiness (52) Junior Assistant ProfessorHigh Salaried Business Subgroups (5203, 5208)The results of the regression model are shown in table 4 at the end of this section. The model’sexplanatory variables and estimates are further divided into five detailed groupings of factors that werehypothesized to affect faculty salaries: University wide faculty rank variables,University wide years at rank variables,Rank variables for faculty in CIP 51 (Health professions),Rank variables for faculty in CIP 52 (Business), andVariables indicating “junior” assistant professors with 3 years of experience or less.Our results are discussed separately for:1. Faculty members in disciplines other than business and health professions,2. Faculty members in health professions, and3. Faculty members in business disciplines.The effects of junior faculty status are discussed with each respective faculty cohort.Separate regression models for Librarians and Advisors were also estimated. The regression models arediscussed at the end of this section.FGCU Faculty Salary Compression and Inversion StudyDecember 2011 (Revised January 2012)8
Model results for FGCU Faculty in Disciplines other than Health Professions and BusinessComparisons of rank variables alone are similar to rank ratio comparisons, with the added benefit ofstatistical measures of significance. Our faculty rank variables include indicators for each facultymember’s CIP classification, and variables indicating each faculty member’s rank above instructor. Themodel also includes a separate variable for the number of years each faculty member has held theircurrent rank. The coefficients for the CIP classification measure the average salary of new instructors.The variable indicating that a faculty member is an assistant professor (DVASST) plus the variableindicating junior status (JRAST) measures the additional salary that new assistant professors make aboveinstructors. Adding these two coefficient values 14,177 and ‐1,438 suggests that, on average, newassistant professors make 12,739 more than instructors. The variable indicating that a faculty memberis an associate professor (DVASOC) measures the additional salary that new associate professors makeabove instructors. The regression results suggest that associate professors make 18,934 more thaninstructors. Subtracting the coefficient for new assistant professors ( 12,739) from 18,934 suggeststhat new associates earn 6,195 more than new assistant professors. The variable indicating that afaculty member is a full professor (DVPROF) measures the additional salary that new full professorsmake above instructors. On average, full professors starting salaries are 30,355 above instructors, 17,616 above new assistant professors, and 11,421 above new associate professors. These salarydifferences are illustrated in figure 4 below. Each of these differences is statistically significant at theconventional 5% level, indicating that salaries across ranks are not compressed at the university level,when experience is not considered.Figure 4. Salary Comparison University‐WideUniversity‐Wide Faculty Salaries Compared toNew Instructors 35,000Additional Salary 30,000 30,355 25,000 20,000 18,934 15,000 10,000 12,739 5,000 0New Assistant ProfessorNew Associate ProfessorNew Full ProfessorThe years at rank variables measure the additional salary faculty members receive for each year ofexperience at the
tracked by CUPA (College and University Professional Association for Human Resources). FGCU Faculty Salary Compression and Inversion Study December 2011 (Revised January 2012) 2 There are two methods of analysis most common to t