Transcription
Drawing Gantt Charts in LATEXwith Tik ZThe pgfgantt PackageWolfgang Skala v3.02012/01/25The pgfgantt package provides the ganttchart environment, whichdraws a Gantt chart within a Tik Z picture. The user may add variouselements to the chart, namely titles (\gantttitle, \gantttitlelist),bars (\ganttbar), milestones (\ganttmilestone), groups (\ganttgroup)and different links between these elements (\ganttlink). Furthermore,the appearance of the chart elements is highly customizable, owing to anumber of keys.Contents1 Introduction22 User Guide2.1 Overview . . . . . . . . . . . . . . .2.2 Specifying Keys . . . . . . . . . . . .2.3 The Canvas . . . . . . . . . . . . . .2.4 Line Breaks between Chart Elements2.5 Titles . . . . . . . . . . . . . . . . .2.6 Bars . . . . . . . . . . . . . . . . . .2.7 Groups . . . . . . . . . . . . . . . . .2.8 Progress Bars and Progress Groups .2.9 Milestones . . . . . . . . . . . . . . .2.10 Links . . . . . . . . . . . . . . . . . .2.11 Linked Bars and Linked Milestones .2.12 Style Examples . . . . . . . . . . . . .22348914182224263536Division of Structural Biology, Department of Molecular Biology, University of Salzburg, Austria; Wolfgang.Skala@stud.sbg.ac.at1
3 Implementation3.1 Packages . . . . . . . . . . . . . .3.2 Global Counters and Booleans . .3.3 Macros for Key Management . .3.4 Option Declarations . . . . . . .3.5 The Horizontal and Vertical Grid3.6 The Main Environment . . . . .3.7 Starting a New Line . . . . . . .3.8 Title Elements . . . . . . . . . .3.9 Chart Elements . . . . . . . . . .3.10 Bars . . . . . . . . . . . . . . . .3.11 Links . . . . . . . . . . . . . . . .3.12 Groups . . . . . . . . . . . . . . .3.13 Milestones . . . . . . . . . . . . .40404040414647495051535561644 Index665 Change History691 IntroductionThe pgfgantt package allows you to draw Gantt charts in LATEX. Thus, you can describe simple project schedules without having to include images produced by external programs. Similar to Martin Kumm’s gantt package1 (which inspired pgfgantt’sfundamental aspects), pgfgantt bases upon the Tik Z frontend of pgf2 . Besides, itprovides a comprehensive (and portable) alternative to pst-gantt3 .pgfgantt requires a current pgf installation. Note that the version numbermust at least be 2.10, dated October 25th, 2010. Furthermore, pgfgantt 3.0and above is not fully downwards compatible. In particular, the syntax of\ganttlink has changed.Acknowledgements I would like to thank Petr Pošík (Czech Technical Universityin Prague), Raphaël Clifford (University of Bristol) and Holger Karl (UniversitätPaderborn) for their ideas concerning new features.2 User Guide2.1 OverviewTo load the package, simply put1http://www.martin-kumm.de/tex gantt ontrib/pst-gantt/22
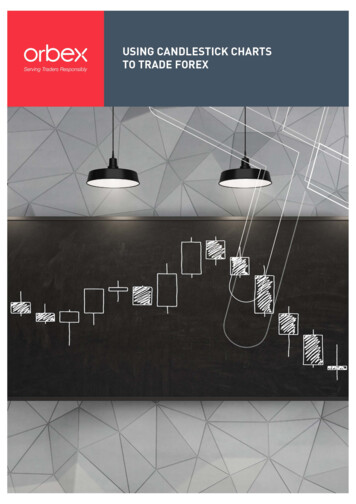
\usepackage{pgfgantt}into the document preamble.Compare the following code, which demonstrates some commands provided bypgfgantt, to the output it 2} \\\gantttitlelist{1,.,12}{1} \\\ganttgroup{Group 1}{1}{7} \\\ganttbar{Task 1}{1}{2} \\\ganttlinkedbar{Task 2}{3}{7} \ganttnewline\ganttmilestone{Milestone}{7} \ganttnewline\ganttbar{Final m3}{elem4}\end{ganttchart}20111 2 3 4 5 6 7 8 9 10 11 12Group 1Task 1Task 2MilestoneFinal Task2.2 Specifying KeysKeys (sometimes called options) modify the output from pgfgantt’s commands. Youmay specify a key in two ways: (1) Pass it to the optional argument present in eachcommand, e. g.\ganttbar[bar label font \bfseries]{Task 1}{1}{2}This locally changes a key for the element(s) drawn by that command. (2) Alternatively, specify a key by the \ganttset{hkey value listi} macro, which sets its keysglobally (or rather within the current TEX group):3\ganttset
\ganttset{bar label font \bfseries}Since pgfgantt uses the pgfkeys package for key management, all its keys reside inthe /pgfgantt/ path. However, if you set your keys by one of the methods explainedabove, this path is automatically prepended to each key.2.3 The CanvasLet us have a look at the basic anatomy of a Gantt chart and define some commonterms. Each chart consists of several elements, such as titles, bars and connectionsbetween bars. Commands that start with \gantt. . . draw these elements. Whenspecifying start and end coordinates for these commands, we use the dimensionlesschart coordinate system, whose origin lies in the top left corner. Along the x-axis,one unit corresponds to one time slot; along the y-axis, one unit equals one line.The ganttchart environment groups several of the element-drawing macros intoa single chart:\begin{ganttchart}[hoptionsi]{hnumber of time slotsi}···\end{ganttchart}The environment has one optional and one mandatory argument. The former specifiesthe hoptionsi for the chart, the latter indicates the hnumber of time slotsi.Although you will often put a ganttchart into a tikzpicture environment, youmay actually use the environment on its own. pgfgantt checks whether the chart issurrounded by a tikzpicture and adds this environment if necessary./pgfgantt/canvas ./style hstyleifill whiteThe canvas key changes the appearance of the canvas. hstylei is a list of Tik Z keyssuch as fill, draw or dashed. By default, the canvas is a white rectangle with ablack frame.\begin{tikzpicture} % optional\begin{ganttchart}%[canvas/.style {fill yellow!25, draw blue, dashed, very thick}]{6}\gantttitle{Title}{6} \\\ganttbar{}{1}{2} e} % optional4ganttchart
Title/pgfgantt/x unit hdimensioni.5cm/pgfgantt/y unit title hdimensioni1cm/pgfgantt/y unit chart hdimensioni1cmThese keys specify the width of a time slot and the height of title or chart lines,respectively. Typically, the x/y-dimension ratio approximates 1 : 2, and the lineheight is equal over the whole chart. Other dimensions are well possible, but youmight have to change several spacing-related keys in order to obtain a pleasing chart.\begin{ganttchart}[x unit 1cm, y unit title .6cm, y unit chart 1.5cm]{6}\gantttitle{Title 1}{6} \\\gantttitle{Title 2}{6} \\\ganttbar{}{1}{3} \\\ganttbar{}{4}{6}\end{ganttchart}Title 1Title 2/pgfgantt/hgrid [ false/true/hstyle listi]false/pgfgantt/hgrid style /.style hstyleidotted/pgfgantt/vgrid [ false/true/hstyle listi]falsehgrid draws a horizontal grid which starts immediately below the last title element.The key can be specified in four different ways: Firstly, hgrid false eliminates thehorizontal grid. You may omit this declaration, since it is the default. Secondly,both hgrid and hgrid true activate the horizontal grid, which is then drawn inthe default style dotted. Finally, hgrid hstyle listi draws the horizontal grid in thegiven hstyle listi (see below).5
hgrid style changes the style of single horizontal grid lines that are drawn with\ganttnewline[grid] (see section 2.4). The vgrid key governs the vertical grid;otherwise, use it exactly like hgrid.Style lists allow you to draw the grid lines in different styles. Each style list consistsof several style list items separated by a comma. A style list item has the generalsyntax *{hni}{hstylei} and orders the package to repeat the hstylei hni-times. (Thissyntax is reminiscent of column specifications in a tabular environment.) Thus, thelist *2{red}, *1{green}, *{10}{blue, dashed} instructs pgfgantt to draw firsttwo red vertical grid lines, then a green one and finally ten dashed blue lines. If anygrid lines remain to be drawn at the end of the list, the package starts again at thebeginning of the list.\begin{ganttchart}%[hgrid true,vgrid {*2{red}, *1{green}, *{10}{blue, dashed}}]{20}\gantttitle{Title 1}{20} \\\ganttbar{}{1}{8} \\\ganttbar{}{9}{20}\end{ganttchart}Title 1In most situations, you can omit the multiplier *1. Hence, the following style listsare equal:{*1{red}, *1{blue, dashed}}{{red}, {blue, dashed}}{red, {blue, dashed}}However, if you wish to use a single style comprising two or more keys for all gridlines, e. g. red, dotted, you must retain the multiplier (i. e., {*1{red, dotted}}).% wrong code% correct code\begin{ganttchart}%[hgrid true,vgrid {{red, dotted}}]{6}\gantttitle{Title 1}{6} \\\ganttbar{}{1}{3} rt}%[hgrid true,vgrid {*1{red, dotted}}]{6}\gantttitle{Title 1}{6} \\\ganttbar{}{1}{3} \\\ganttbar{}{4}{6}\end{ganttchart}6
Title 1Title 1In a chart with many time slots, drawing vertical grid lines between all of themwill lead to a confusing appearance. In such a case, you can pass an appropriatehstyle listi to vgrid in order to draw every second grid line, for example.\begin{ganttchart}%[vgrid {draw none, dotted}]{12}\gantttitlelist{1,.,12}{1} \\\ganttbar{}{1}{4} \\\ganttbar{}{5}{11}\end{ganttchart}1 2 3 4 5 6 7 8 9 10 11 12/pgfgantt/today htime slotinone/pgfgantt/today rule /.style hstyleidashed, line width 1pt/pgfgantt/today label htextiTODAYSometimes, you may wish to indicate the current day, month or the like on a Ganttchart. In order to do so, pass an integer value to the today key, which draws a verticalrule at the corresponding htime sloti. This rule appears in the hstylei denoted bytoday rule, while today label contains the htexti below the rule.\begin{ganttchart}%[vgrid, today 2]{6}\gantttitle{Title}{6} \\\ganttbar{}{1}{3} rt}%[vgrid, today 3,today label \textcolor{blue}%{Current Week},today rule/.style %{blue, ultra thick}]{6}\gantttitle{Title}{6} \\\ganttbar{}{1}{3} \\\ganttbar{}{4}{6}\end{ganttchart}7
TitleTitleTODAYCurrent Week2.4 Line Breaks between Chart Elementspgfgantt does not automatically begin a new line after finishing a chart element.Instead, you must insert an explicit line break with \ganttnewline. Within aganttchart environment, \\ is defined as a shortcut for \ganttnewline, so thatthe syntax is reminiscent of LATEX’s tabular enviroment.\begin{ganttchart}[hgrid, vgrid]{6}\gantttitle{Title 1}{3}\gantttitle{Title 2}{3} \\\ganttbar{}{1}{3} d{ganttchart}Title 1Title 2Even if you prefer a canvas without a horizontal grid, you may nevertheless want toseparate certain lines by a grid rule. For this purpose, specify the optional argument[grid] for \ganttnewline (or \\), which draws a grid rule in hgrid style betweenthe current and the new line. Alternatively, directly give the desired style as optionalargument.\begin{ganttchart}[hgrid style/.style red]{12}\gantttitle{Title}{12} \\\ganttbar{}{1}{3} \ganttnewline[thick, blue]\ganttbar{}{4}{5} \\\ganttbar{}{6}{10} newline\\
Title2.5 TitlesA title (comprising one or more lines) at the top of a Gantt chart usually indicatesthe period of time covered by that chart. For example, the first line could span twelvetime slots and display the current year, while the second line could contain twelveelements, each of which corresponds to one month. For these purposes, pgfganttimplements two titling commands.\gantttitle draws a single title element:\gantttitle\gantttitle[hoptionsi]{hlabel i}{hnumber of time slotsi}The hlabel i appears in the center of the title element, which covers the hnumber oftime slotsi starting from the right end of the last title element (or from the beginningof the line, if the title element is the first element in this line). Mostly, you will employ\gantttitle for titles that span several time slots.\begin{ganttchart}[hgrid, vgrid]{12}\gantttitle{2011}{12} rt}2011Whenever you want to draw a larger number of title elements that are equal in sizeand follow a common enumeration scheme, the \gantttitlelist macro provides afast solution:\gantttitlelist[hoptionsi]{hpgffor listi}{hlength of each elementi}9\gantttitlelist
This macro generates one title element for each member of the hpgffor listi. Thesecond mandatory argument specifies the hlength of each elementi. The Tik Z manualdescribes the syntax for the hpgffor listi in more detail, but we will mention two ofthe most common applications:1. In order to draw twelve title elements that contain the numbers from 1 to 12(indicating the months of a year), enter 1,.,12 as the hpgffor i list.\begin{ganttchart}[hgrid, vgrid]{12}\gantttitlelist{1,.,12}{1} rt}1 2 3 4 5 6 7 8 9 10 11 12Note that we would have obtained the same result if we had written\gantttitle{1}{1} \gantttitle{2}{1} . . . \gantttitle{12}{1} \\2. In order to draw seven title elements containing the names of the weekdays(e. g., “Mon” to “Sun”), we have to change the title list options key:/pgfgantt/title list options hpgffor optionsivar \x, evaluate \xThis key changes the hpgffor optionsi of the \foreach command called by\gantttitlelist. Again, the Tik Z manual is the definitive reference on possible hpgffor optionsi. There is just one thing to keep in mind: The macro thatyields the labels to be printed by \gantttitlelist must be called \x.The following example shows how you can implement a title line enumeratingthe days of the rt}[hgrid, vgrid, x unit 1cm]{7}\gantttitlelist[title list options {%var \y, evaluate \y as \x%using "\pgfcalendarweekdayshortname{\y}"%}]{0,.,6}{1} t}10
MonTueWed ThuFri/pgfgantt/title /.style hstyleiSets the appearance of a title element.SatSunfill ngs}···\begin{ganttchart}%[vgrid, canvas/.style {draw none},title/.style {fill blue!20, rounded corners 2mm, drop shadow}]{7}\gantttitle{First week}{7} \\\gantttitlelist[title/.style {draw none, inner color red}]{1,.,7}{1} t}First week1 2 3 4 5 6 7/pgfgantt/title label font hfont commandsi\smallSelects the font of the text inside a title element. In most cases, you can includefont format commands directly in the first mandatory argument of \gantttitle.However, you must use the title label font key if you intend to change the fontsize. Otherwise, the vertical alignment of the title label will be incorrect with thestandard anchor.11
% Wrong alignment% Correct alignment\begin{ganttchart}%[vgrid, hgrid,y unit title e Title}{6} t}\begin{ganttchart}%[vgrid, hgrid,y unit title 1.3cm,title label font tle}{6} t}TitleTitle/pgfgantt/title label anchor /.style hanchor ianchor midBy default, title labels are vertically centered at half their x-height. This yields a goodalignment for labels whose letters have equal amounts of ascenders and descenders(e. g., lowercase numbers). However, when the letters contain mostly ascenders (e. g.,uppercase numbers), the label position will appear too high. In this case, you shouldchange the anchor:% Badly centered label% Nicely centered label\begin{ganttchart}%[vgrid, hgrid,title label font {\LARGE}%]{6}\gantttitle{2011}{6} t}\begin{ganttchart}%[vgrid, hgrid,title label font {\LARGE},title label anchor/.style %{below -1.5ex}]{6}\gantttitle{2011}{6} t}2011201112
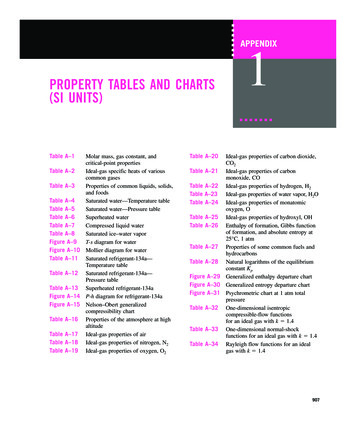
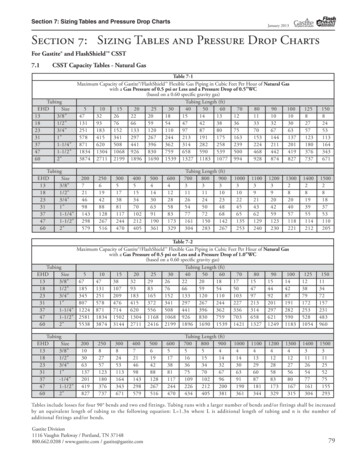
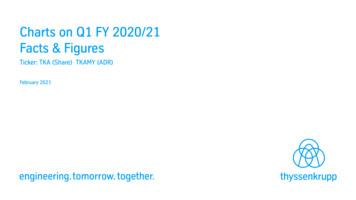
/pgfgantt/title left shift hfactor i0/pgfgantt/title right shift hfactor i0/pgfgantt/title top shift hfactor i0/pgfgantt/title height hfactor i0.6The first three keys shift the coordinates of a title element’s borders (or rather of itscorners), while title height changes its height. By default, the left upper corner ofa title element coincides with the origin of the start time slot; its right lower cornertouches the right border of the end time slot 0.6 units below the upper line border:Start time slot (1)start: (0, 0)End time slot (6)2011(6, 0 0.6): stop(6, 1)The figure below shows a Gantt chart with two lines and one (large) time slot andindicates the distances modified by these keys.(0, 0)title top shift(here: 0.25)title left shift(here: 0.2)(0, 1)Title elementwith standard values(1, 0)title right shift(here: -0.3)title height(here: 0.5)(1, 1)For example, you might devise a layout where the title element does not touch theborders of the start and end time slot.\begin{ganttchart}[vgrid, title/.style {fill teal, draw none},title label font \color{white}\bfseries,title left shift .1, title right shift -.1,title top shift .05, title height .75]{7}\gantttitle{Title}{7} t}Title13
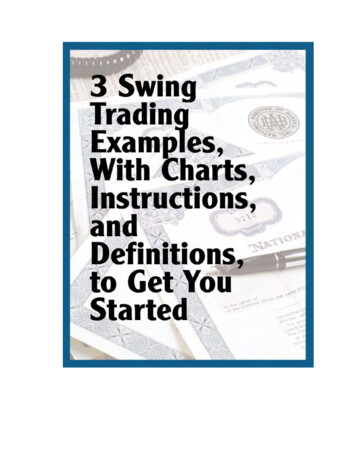
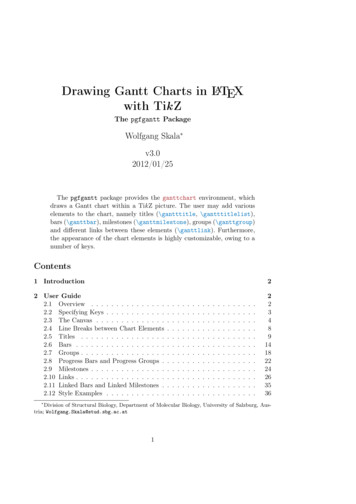
/pgfgantt/include title in canvas hbooleanitrueThe canvas normally comprises all lines of the chart. However, you may wish thatyour title elements only consist of text lacking any frame or background. In thiscase, the canvas probably should exclude all lines containing title elements, whichyou achieve by include title in canvas false.\begin{ganttchart}%[hgrid {*1{draw red, thick}}, vgrid,title/.style {draw none, fill none}, include title in canvas false]{7}\gantttitlelist{1,.,7}{1} \\\ganttbar{}{1}{3} \\\ganttbar{}{4}{7}\end{ganttchart}1 2 3 4 5 6 72.6 BarsOn a Gantt chart, a bar indicates the duration of a task or one of its parts.\ganttbar[hoptionsi]{hlabel i}{hstart time sloti}{hend time sloti}The \ganttbar macro draws a bar from the hstart time sloti to the hend time slotiand adds a hlabel i at the left of the chart.\begin{ganttchart}[vgrid, hgrid]{12}\gantttitle{Title}{12} \\\ganttbar{Task 1}{1}{3} \\\ganttbar{Task 2}{4}{10} \\\ganttbar{Final task}{11}{12}\end{ganttchart}TitleTask 1Task 2Final task14\ganttbar
/pgfgantt/time slot modifier hfactor i-1Note that a bar usually touches the left border of the hstart time sloti and not theright, as it would if the hstart time sloti were strictly interpreted as an x-coordinate.However, you may prefer to work with “real” x-coordinates instead of time slots.In this case, just set the time slot modifier key to zero. This will essentiallyeliminate the semi-intelligent behavior of pgfgantt with respect to the conversionof x-coordinates. This feature may prove useful if you decide to use real numbers forsome time slots.\begin{ganttchart}[vgrid, hgrid, time slot modifier 0]{12}\gantttitle{Title}{12} \\\ganttbar{Task 1}{0}{3} \\\ganttbar{Task 2}{3}{10} \\\ganttbar{Final task}{10}{12}\end{ganttchart}TitleTask 1Task 2Final task/pgfgantt/bar /.style hstyleiDetermines the appearance of the bar.fill white\begin{ganttchart}[vgrid, hgrid, bar/.style {fill red!50}]{12}\gantttitle{Title}{12} \\\ganttbar{Task 1}{1}{3} \\\ganttbar[bar/.style {fill yellow, dashed}]{Task 2}{4}{10} \\\ganttbar[bar/.style {fill green, draw none}]{Final task}{11}{12}\end{ganttchart}TitleTask 1Task 2Final task15
/pgfgantt/bar label text htexti\strut#1/pgfgantt/bar label font hfont commandsi\normalsize/pgfgantt/bar label anchor ./style hanchor ianchor eastThe bar label text key configures the label htexti next to each bar. This key shouldcontain a single parameter token (#1), which is replaced by the first mandatory argument of \ganttbar. The \strut in the standard value ensures equal vertical spacingof the labels. bar label font selects the font for the bar label, bar label anchordetermines its anchor. The last control sequence in hfont commandsi may take asingle argument (like \textit).\begin{ganttchart}[vgrid, hgrid, ba
Drawing Gantt Charts in LATEX with TikZ The pgfgantt Package WolfgangSkala v3.0 2012/01/25 The pgfgantt package provides the ganttchart environment, which draws a Gantt chart within a TikZ picture. The user may add various elements to the chart, namely titles (\gantttitle, \gantttitlelist