Transcription
CLOUDER A DE PLOY M E N T G U IDEGetting Started withHadoop Tutorial
Table of contentsSetup . 2-10Showing big data value . 11-15Showing data hub value . 16Advanced analytics on the same platform . 17-29Data governance and compliance . 30-37The End Game . 38
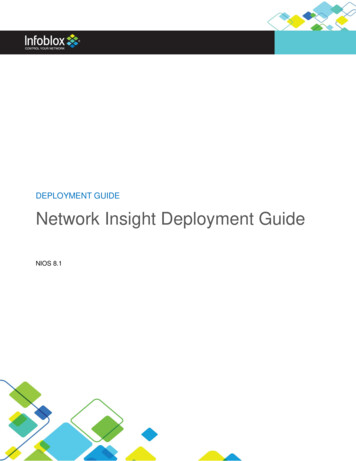
SetupFor the remainder of this tutorial, we will present examples in the context of a fictional corporation called DataCo. Our mission is to help this organization getbetter insight by asking bigger questions.SCENARIO:Your Management: is talking euphorically about Big Data.You: are carefully skeptical, as it will most likely all land on your desk anyway.Or, it has already landed on you, with the nice project description of: Go figurethis Hadoop thing out.PREPARATION:Verify your environment. Go to Cloudera Manager in your demo environment andmake sure the following services are up and running (have a green status dot nextto them in the Cloudera Manager HOME Status view): Apache Impala - You will use this for interactive query Apache Hive - You will use for structure storage (i.e. tables in the Hivemetastore) HUE - You will use for end user query access HDFS - You will use for distributed data storage YARN – This is the processing framework used by Hive (includes MR2)If any of the services show yellow or red, restart the service or reach out tothis discussion forum for further assistance.
SetupFor the remainder of this tutorial, we will present examples in the context of a fictional corporation called DataCo. Our mission is to help this organization getbetter insight by asking bigger questions.STARTING / RESTARTING A SERVICE:1. Click on the dropdown menu to the right of the service name.2. Click on Start or Restart.3. Wait for your service to turn to greenNow that you have verified that your services are healthy and showing green,you can continue.
Exercise 1: Ingest and queryrelational dataIn this scenario, DataCo’s business question is: What products do ourcustomers like to buy? To answer this question, the first thought might be tolook at the transaction data, which should indicate what customers do buyand like to buy, right?This is probably something you can do in your regular RDBMS environment, buta benefit of Apache Hadoop is that you can do it at greater scale at lower cost,on the same system that you may also use for many other types of analysis.What this exercise demonstrates is how to do the same thing you alreadyknow how to do, but in CDH. Seamless integration is important whenevaluating any new infrastructure. Hence, it’s important to be able to do whatyou normally do, and not break any regular BI reports or workloads over thedataset you plan to migrate.To analyze the transaction data in the new platform, we need to ingest it intothe Hadoop Distributed File System (HDFS). We need to find a tool that easilytransfers structured data from a RDBMS to HDFS, while preserving structure.That enables us to query the data, but not interfere with or break any regularworkload on it.
Exercise 1: Ingest and queryrelational dataApache Sqoop, which is part of CDH, is that tool. The nice thing aboutSqoop is that we can automatically load our relational data from MySQL intoHDFS, while preserving the structure. With a few additional configurationparameters, we can take this one step further and load this relational datadirectly into a form ready to be queried by Apache Impala, the MPP analyticdatabase included with CDH, and other workloads.You should first log in to the Master Node of your cluster via a terminal. Then,launch the Sqoop job: sqoop import-all-tables \-m {{cluster data.worker node hostname.length}} \--connect jdbc:mysql://{{cluster data.managernode hostname}}:3306/retail db \--username retail dba \--password cloudera \--compression-codec snappy \--as-parquetfile \--warehouse-dir /user/hive/warehouse \--hive-importThis command may take a while to complete, but it is doing a lot. It islaunching MapReduce jobs to pull the data from our MySQL database andwrite the data to HDFS in parallel, distributed across the cluster in ApacheParquet format. It is also creating tables to represent the HDFS files in Impala/Apache Hive with matching schema.Parquet is a format designed for analytical applications on Hadoop. Instead ofgrouping your data into rows like typical data formats, it groups your data intocolumns. This is ideal for many analytical queries where instead of retrievingdata from specific records, you’re analyzing relationships between specificvariables across many records. Parquet is designed to optimize data storageand retrieval in these scenarios.
Exercise 1: Ingest and queryrelational dataVERIFICATIONWhen this command is complete, confirm that your data files exist in HDFS. hadoop fs -ls /user/hive/warehouse/ hadoop fs -ls /user/hive/warehouse/categories/These commands to your right will show the directories and the files insidethem that make up your tables.Note: The number of .parquet files shown will be equal to what was passedto Sqoop with the -m parameter. This is the number of ‘mappers’ that Sqoopwill use in its MapReduce jobs. It could also be thought of as the number ofsimultaneous connections to your database, or the number of disks / DataNodes you want to spread the data across. So, on a single-node you will justsee one, but larger clusters will have a greater number of files.
Exercise 1: Ingest and queryrelational dataHive and Impala also allow you to create tables by defining a schemaover existing files with ‘CREATE EXTERNAL TABLE’ statements, similar totraditional relational databases. But Sqoop already created these tables forus, so we can go ahead and query them.We’re going to use Hue’s Impala app to query our tables. Hue provides a webbased interface for many of the tools in CDH and can be found on port 8888of your Manager Node. In the QuickStart VM, the administrator username forHue is ‘cloudera’ and the password is ‘cloudera’.Once you are inside of Hue, click on Query Editors, and open the ImpalaQuery Editor.To save time during queries, Impala does not poll constantly for metadatachanges. So, the first thing we must do is tell Impala that its metadata is out ofdate. Then we should see our tables show up, ready to be queried:invalidate metadata;show tables;You can also click on the “Refresh Table List” icon on the left to see your newtables in the side menu.
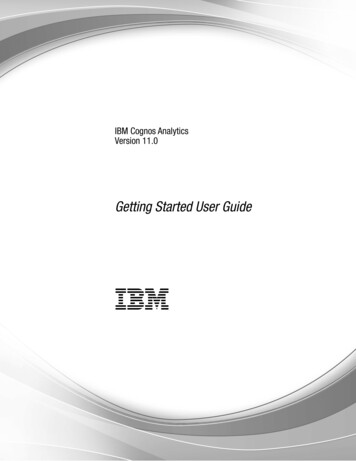
Exercise 1: Ingest and queryrelational dataNow that your transaction data is readily available for structured queries inCDH, it’s time to address DataCo’s business question. Copy and paste or typein the following standard SQL example queries for calculating total revenueper product and showing the top 10 revenue generating products:-- Most popular product categoriesselect c.category name, count(order item quantity) as countfrom order items oiinner join products p on oi.order item product id p.product idinner join categories c on c.category id p.productcategory idgroup by c.category nameorder by count desclimit 10;You should see results of the following form:
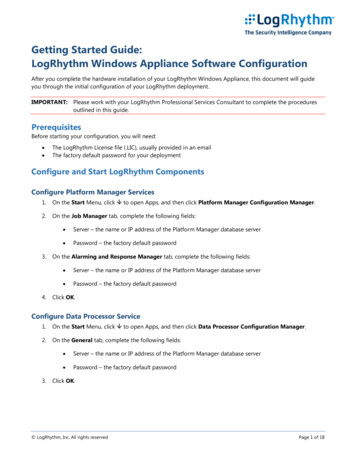
Exercise 1: Ingest and queryrelational dataClear out the previous query, and replace it with the following:You should see results similar to this:-- top 10 revenue generating productsselect p.product id, p.product name, r.revenuefrom products p inner join(select oi.order item product id, sum(cast(oi.order itemsubtotal as float)) as revenuefrom order items oi inner join orders oon oi.order item order id o.order idwhere o.order status ‘CANCELED’and o.order status ‘SUSPECTED FRAUD’group by order item product id) ron p.product id r.order item product idorder by r.revenue desclimit 10;You may notice that we told Sqoop to import the data into Hive but usedImpala to query the data. This is because Hive and Impala can share bothdata files and the table metadata. Hive works by compiling SQL queries intoMapReduce jobs, which makes it very flexible, whereas Impala executesqueries itself and is built from the ground up to be as fast as possible, whichmakes it better for interactive analysis. We’ll use Hive later for an ETL (extracttransform-load) workload.
Exercise 1: Ingest and queryrelational dataCONCLUSIONNow that you have gone through the first basic steps to Sqoop structured data into HDFS, transform itinto Parquet file format, and create hive tables for use when you query this data.You have also learned how to query tables using Impala and that you can use regular interfaces and tools(such as SQL) within a Hadoop environment as well. The idea here being that you can do the same reportsyou usually do, but where the architecture of Hadoop vs traditional systems provides much larger scaleand flexibility.
Showing big data valueSCENARIO:Your Management: is indifferent, you produced what you always produce - areport on structured data, but you really didn’t prove any additional value.You: are either also indifferent and just go back to what you have alwaysdone. or you have an ace up your sleeve.PREPARATION:Go to Cloudera Manager’s home page and verify the following services are up: Impala Hive HDFS Hue
Exercise 2: Correlate structured datawith unstructured dataSince you are a pretty smart data person, you realize another interestingbusiness question would be: are the most viewed products also the mostsold? Since Hadoop can store unstructured and semi-structured dataalongside structured data without remodeling an entire database, you canjust as well ingest, store, and process web log events. Let’s find out what sitevisitors have viewed the most.For this, you need the web clickstream data. The most common way toingest web clickstream is to use Apache Flume. Flume is a scalable real-timeingest framework that allows you to route, filter, aggregate, and do “minioperations” on data on its way in to the scalable processing platform.In Exercise 4, later in this tutorial, you can explore a Flume configurationexample, to use for real-time ingest and transformation of our sample webclickstream data. However, for the sake of tutorial-time, in this step, we willnot have the patience to wait for three days of data to be ingested. Instead,we prepared a web clickstream data set (just pretend you fast forwardedthree days) that you can bulk upload into HDFS directly.BULK UPLOAD DATAFor your convenience, we have pre-loaded some sample access log data into/opt/examples/log data/access.log.2. Let’s move this data from the localfilesystem, into HDFS. sudo -u hdfs hadoop fs -mkdir /user/hive/warehouse/original access logs sudo -u hdfs hadoop fs -copyFromLocal /opt/examples/log files/access.log.2 /user/hive/warehouse/originalaccess logsThe copy command may take several minutes to complete. Verify that yourdata is in HDFS by executing the following command: hadoop fs -ls /user/hive/warehouse/original access logs
Exercise 2: Correlate structured datawith unstructured dataNow you can build a table in Hive and query the data via Apache Impala andHue. You’ll build this table in 2 steps. First, you’ll take advantage of Hive’s flexibleSerDes (serializers / deserializers) to parse the logs into individual fields using aregular expression. Second, you’ll transfer the data from this intermediate tableto one that does not require any special SerDe. Once the data is in this table, youcan query it much faster and more interactively using Impala.“([ \ ]*) ([ \ ]*) ([ \ ]*)” (\\d*) (\\d*) “([ ”]*)”We’ll use the Hive Query Editor app in Hue to execute the following queries:LOCATION ‘/user/hive/warehouse/original access logs’;‘input.regex’ ‘([ ]*) - - \\[([ \\]]*)\\]“([ ”]*)”’,‘output.format.string’ “%1 s %2 s %3 s %4 s%5 s %6 s %7 s %8 s %9 s”)CREATE EXTERNAL TABLE tokenized access logs (CREATE EXTERNAL TABLE intermediate access logs (ip STRING,date STRING,method STRING,url STRING,http version STRING,code1 STRING,code2 STRING,dash STRING,user agent STRING)ROW FORMAT SERDE e’WITH SERDEPROPERTIES (ip STRING,date STRING,method STRING,url STRING,http version STRING,code1 STRING,code2 STRING,dash STRING,user agent STRING)ROW FORMAT DELIMITED FIELDS TERMINATED BY ‘,’LOCATION ‘/user/hive/warehouse/tokenized access logs’;ADD JAR {{lib dir}}/hive/lib/hive-contrib.jar;INSERT OVERWRITE TABLE tokenized access logs SELECT *FROM intermediate access logs;
Exercise 2: Correlate structured datawith unstructured dataThe final query will take a minute to run. It is using a MapReduce job, justlike our Sqoop import did, to transfer the data from one table to the other inparallel. You can follow the progress in the log below, and you should see themessage ‘The operation has no results.’ when it’s done.By introspecting the results you quickly realize that this list contains many ofthe products on the most sold list from previous tutorial steps, but there is oneproduct that did not show up in the previous result. There is one product thatseems to be viewed a lot, but never purchased. Why?Again, we need to tell Impala that some tables have been created througha different tool. Switch back to the Impala Query Editor app, and enter thefollowing command:Well, in our example with DataCo, once these odd findings are presented toyour manager, it is immediately escalated. Eventually, someone figures outthat on that view page, where most visitors stopped, the sales path of theproduct had a typo in the price for the item. Once the typo was fixed, and acorrect price was displayed, the sales for that SKU started to rapidly increase.invalidate
Now that you have gone through the first basic steps to Sqoop structured data into HDFS, transform it into Parquet file format, and create hive tables for use when you query this data. You have also learned how to query tables using Impala and that you can use regular interfaces and tools (such as SQL) within a Hadoop environment as well. The idea here being that you can do the same reports