Transcription
IBM Cognos AnalyticsVersion 11.0Getting Started User GuideIBM
Product InformationThis document applies to IBM Cognos Analytics version 11.0.0 and may also apply to subsequent releases.CopyrightLicensed Materials - Property of IBM Copyright IBM Corp. 2005, 2017.US Government Users Restricted Rights – Use, duplication or disclosure restricted by GSA ADP Schedule Contractwith IBM Corp.IBM, the IBM logo and ibm.com are trademarks or registered trademarks of International Business Machines Corp.,registered in many jurisdictions worldwide. Other product and service names might be trademarks of IBM or othercompanies. A current list of IBM trademarks is available on the Web at “Copyright and trademark information” atwww.ibm.com/legal/copytrade.shtml.The following terms are trademarks or registered trademarks of other companies:v Adobe, the Adobe logo, PostScript, and the PostScript logo are either registered trademarks or trademarks ofAdobe Systems Incorporated in the United States, and/or other countries.v Microsoft, Windows, Windows NT, and the Windows logo are trademarks of Microsoft Corporation in the UnitedStates, other countries, or both.Microsoft product screen shot(s) used with permission from Microsoft. Copyright IBM Corporation 2005, 2015.US Government Users Restricted Rights – Use, duplication or disclosure restricted by GSA ADP Schedule Contractwith IBM Corp.
ContentsChapter 1. Get started. . . . . . . . . . . . . . . . . . . . . . . . . . . . . . 1Search and find content. . . . . . . . .Navigation tips . . . . . . . . . . .View and interact with content . . . . . .Subscribing to reports . . . . . . . . .Managing your subscriptions . . . . . . .Notifications . . . . . . . . . . . .Run variations of reports with report views . .Report versions . . . . . . . . . . .Link behavior when you copy, move, or renameSet properties for entries . . . . . . . .Scheduling entries . . . . . . . . . .23355566778Chapter 2. Get started video tutorials and samples . . . . . . . . . . . . . . . . . 9Creating my first report. . . . . . . . . . . . . . . . . . . . . . . . . . . . . . . . 9Creating my first report - part two. . . . . . . . . . . . . . . . . . . . . . . . . . . . 11Creating my first active report . . . . . . . . . . . . . . . . . . . . . . . . . . . . . 12Chapter 3. Setting your preferences . . . . . . . . . . . . . . . . . . . . . . . 17Language settings . . . . . .Turn UI hints on. . . . . . .Setting the default format for reportHiding and showing hidden entriesManaging logging levels . . . . . . . .runs . . . . .1717171718Chapter 4. Credentials . . . . . . . . . . . . . . . . . . . . . . . . . . . . . 21Renewing your credentials . . . . .Managing your credentials . . . . .Managing your data server credentials . 21. 21. 22Chapter 5. Access permissions . . . . . . . . . . . . . . . . . . . . . . . . . 23Simple and granular access permissions . . . . .Setting permissions for content . . . . . . . .Viewing your permissions for content . . . . .Viewing your permissions for functions and features.23242525Chapter 6. Sources of data . . . . . . . . . . . . . . . . . . . . . . . . . . . 27Uploading data . .Creating data sets . 28. 29Chapter 7. Sharing and embedding Cognos Analytics content . . . . . . . . . . . . 31Share or embed a content object . . . . .Authentication sample with embedded content. 31. 32Chapter 8. Creating custom URLs to display and run Cognos Analytics content . . . . 33promptParameters option syntax. 35Chapter 9. Integrating with other Cognos products. . . . . . . . . . . . . . . . . 37The IBM Cognos Software Development Kit . . . . .Functionality mapping from Cognos BI to Cognos AnalyticsMove from quirks to standards mode HTML . . . .Opening companion apps . . . . . . . . . . Copyright IBM Corp. 2005, 2015.38383940iii
Appendix. About this guide . . . . . . . . . . . . . . . . . . . . . . . . . . . 43Notices . . . . . . . . . . . . . . . . . . . . . . . . . . . . . . . . . . . 45Index . . . . . . . . . . . . . . . . . . . . . . . . . . . . . . . . . . . . 49ivIBM Cognos Analytics Version 11.0: Getting Started User Guide
Chapter 1. Get startedIBM Cognos Analytics integrates reporting, modeling, analysis, dashboards,stories, metrics, and event management so you can understand your organization'sdata, and make effective business decisions.After the software is installed and configured, administrators set up security andmanage data sources. Next comes the data. You can get started yourself byuploading local files and applying visualizations in dashboards or stories. Forenterprise-level data, modelers are next in the workflow. After data modules andpackages are available, report authors can then create reports for business usersand analysts. Administrators maintain the system on an ongoing basis.Whether you're an analyst, report author, data modeler, or an administrator, youstart by signing in to the Welcome portal from your desktop or mobile device.There are coach marks in the user interface to help you discover what's where.For links to videos, getting started resources, expert blogs, events, and more, youcan tapin the application bar and visit the IBM Cognos Analytics -analytics/).If you want to start with video tutorials and sample data, see Chapter 2, “Getstarted video tutorials and samples,” on page 9.Depending on the work you do, you use different areas of the interface. There areIBM Cognos Analytics capabilities associated with the following areas and you seeonly those that you work with:Welcome portalRun reports, search for content, view My content, Team content, andRecent lists, open dashboards, open stories and other items, upload files,check your notifications, set your preferences and home page, and reviewyour subscriptions.Delete, copy, move, edit, run as, set properties, set permissions and more,depending on the type of entry in the content list.- Create report views for a report directly without using theReporting view.- Create shortcuts to reports, dashboards, stories, or data modules.A shortcut is a link to an object in a different location. If the original objectis moved or renamed, the shortcut no longer works.Tapto create new reports, data modules, dashboards, or stories.ReportingCreate and edit a wide range of professional reports. Use templates orcustomize your reports with prompts, bursting, advanced charts andvisualizations.For more information, see the Cognos Analytics Reporting Guide.Data modelingModelers and administrators shape data, create modules and packages andmake them available to people that create and use reports. You can use the Copyright IBM Corp. 2005, 20151
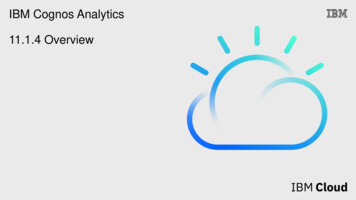
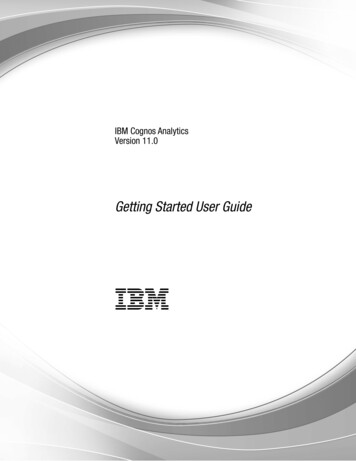
IBM Cognos Analytics modeling tool to quickly create data modules fromvarious data sources such as data servers, uploaded files, and previouslysaved data modules. The tool is intent-driven and generates a base moduleby using terms that you define.For more information, see the Cognos Analytics Data Modeling Guide.Dashboards and storiesView, monitor, and communicate data insights and analysis withdashboards or stories. You can assemble a view that contains visualizationssuch as graphs, charts, plots, tables, maps, or any other visualrepresentation of data. Enrich dashboards and stories with web pages andother content.For more information, see the Cognos Analytics Dashboards and StoriesUser Guide.Manage and administerCreate and manage accounts (users, groups, and roles), schedules, datasource connections, activities, and content stores. Perform configurationtasks, create new jobs, and open the Administration console for moremanagement options.Changes that you make in either the Manage interface or Administrationinterface, are effected in both interfaces.For more information, see Cognos Analytics Managing Guide and theCognos Analytics Administration and Security Guide.Search and find contentYou can find IBM Cognos Analytics reports, dashboards, stories, data, files, folders,packages and other items by opening your My content or Team content folders orby checking your Recent list. But Search is a quick, easy way to find your items.Figure 1. Find your contentTo find items, type keywords and tap the Enter key. You can also search for textincluding table or column labels, XML report specifications, URL items, shortcuts,templates, and more. Search doesn't return results for content that's archived, butyou can access archived content from a report that's listed in one of your folders.2IBM Cognos Analytics Version 11.0: Getting Started User Guide
Narrow your search with filtersIf your search returns too many results, you can tap the filter icon andselect the options you want. The filter option is only available after you doan initial search.Save searchesAfter you search and the results are listed, you can save your search. Ifyou included filter options in your search, these options are also saved.The save option is only available after you search.Team contentYour organization's content is in theTeam content folder. This iswhere you find reports, packages, dashboards, stories, models, and more.Items in Team content are organized in folders, so searching withkeywords is an easy way to find what you're looking for.View report output versions and archived versionsFor a report in a list, tapand then tap the View versions icon.Navigation tipsTapping around in the IBM Cognos Analytics user interface helps you discoverhow things work. Here are a few navigation tips to speed your discovery.Run a report from the My content or Team content listTap the name of a report or tapfor the Run as option.Select entries in content listsTap their icons or tap the space beside the entry names.Add a folder to My content or Team contentThe content lists open in a narrow view. To open the wide view where youcan add folders, sort, and filter content, tap.View and interact with contentYou search and find an IBM Cognos Analytics report in the Team content folder,and then you run it. The report opens in a viewer. You now have different options,such as subscribe, save as a report view, edit in reporting, and more. The availableoptions depend on the type of report or the item that you view. When a reportruns in the interactive viewer, you also have options to see different data in thereport by filtering, drilling up and down, and more.Choose the options that best suit your needs for viewing frequency andpersonalization. If you want to see a report on a regular basis, subscribe to it. If it'sreally important, you can set it as your home page. If you entered prompt andparameter values and you want to save those so you don't have to enter themevery time, save the report as a report view. If you choose to edit, the report opensin Reporting with all the tools you need. Depending on the item type, theappropriate actions are available in the viewer:vSubscribe. Delivers reports with your prompt values and options.v Save as report view. Saves your prompt values and options in a view.v Set as home.Chapter 1. Get started3
vEdit. Opens Reporting.v Run as. Choose the output format.v Save and Save as.If you view saved report output, and you want to be alerted when there's a newversion of the report, tap Notify me. You can easily find entries in Team contentby searching and by viewing the Recent items list. But you can also save andorganize your items in My content which is useful for saving report views withyour custom prompts or for saving report output versions. Your My content folderis your private area and only you can see the content that's stored there.When a report runs in the interactive viewer, the following options are available inthe toolbar that appears when you select a report object:v Sort data.v In lists, group datav Summarize data.v Convert a list or crosstab to a chart, or change a chart to a different chart type.v In crosstabs and charts, suppress columns or rowsrowsor swap columns and.v Drill through to another report.vAdd calculated membersvDrill up, drill down, and perform dimensional operations, such astop/bottom filtering.Run the report as Excel or CSV output.vSelect and interact with the elements of a chart, such as the bars in a barvchart.vView lineage information for a data itemvAccess a business glossary, such as the IBM InfoSphere InformationGovernance Catalog, for a data itemCreate, edit or remove filtersvv.Share or embed report output, preserving the context of the current viewof the report, such as prompt values.To share or embed report output, click the More iconor Embed.and then click ShareRun a report as the report owner or with the capabilities granted to thevowner.In the Cognos Analytics portal, access the Properties slideout of the report, clickthe Report tab, and then open the Advanced section.4IBM Cognos Analytics Version 11.0: Getting Started User Guide
Subscribing to reportsIf you use an IBM Cognos Analytics report regularly, you can subscribe to it. Whenyou subscribe, you pick the time, date, format, and where you want it delivered.When you subscribe to a report, the subscription includes all your prompt andparameter values.About this taskThe subscription option is available when you run and view a report, but notwhen
IBM Cognos Analytics modeling tool to quickly cr eate data modules fr om various data sour ces such as data servers, uploaded files, and pr eviously saved data modules. The tool is intent-driven and generates a base module by using terms that you define. For mor e information, see the Cognos Analytics Data Modeling Guide . Dashboards and stories