Transcription
Advanced DashboardGetting Started Guide
Advanced DashboardWelcome to Advanced Dashboard, our flagship webbased trader platform.Advanced Dashboard offers an intuitive and powerful set of capabilitiesdesigned to allow you to trade quickly and with increased confidence.This guide is meant to provide an overview of the platform's mostimportant features so you can start trading immediately.To dig deeper, click here to access our online help page or contact theHelp Desk at 1-866-638-5258.2
Getting AroundLogging InStart trading on Advanced Dashboard in three easy steps!1.1Log-in to WebBroker2.2Click on3.3Clickin the upper right-hand corner of the window#TraderTip: Add Level II and othermarket data feeds to your subscriptionby clicking "Modify my package".Getting AroundBuilt-in ViewsCustom ViewsTradingLinkingHeat MapsWatch ListsCharts3
Getting AroundAt the top of your screen, you'll see the Navigation Pane.1231.1The Search Symbol box at the top lets you look up symbols quickly andeasily by entering a name or symbol. It will also auto-suggest symbols andnames as you type.2.2The Add Components and Layout buttons will allow you to createCustom Views to suit your needs.3.3You can click on Settings to further customize your Advanced Dashboardexperience.Getting AroundBuilt-in ViewsCustom ViewsTradingLinkingHeat MapsWatch ListsCharts4
Getting AroundAt the bottom of your screen, you'll see the Trading Bar.12341.1The Buy/Sell button opens an order entry ticket to create new stock andoption orders.2.2Open the Order Status window to view, change, copy, and cancel any ofyour orders.3.3The Holdings button allows you to view, filter, close, and combine yourpositions.1.4Click on the Trade Preferences button to customize the default stock andoption order settings.Getting AroundBuilt-in ViewsCustom ViewsTradingLinkingHeat MapsWatch ListsCharts5
Getting AroundDocking & UndockingTo extend your trading onto multiple screens, click on the 'Undock' button located in theupper right corner of any component to open it in a separate window.The Trade Bar in the bottomright corner allows you toundock any of the Buy/Sell,Order Status, Holdings, orTrade Preferences windowsso that you can move themto another monitor. In'Multiple Undocked' mode,you can have multiplewindows openedsimultaneously.To switch to docked mode,select the 'SingleUndocked' option in theTrade Bar.Getting AroundBuilt-in ViewsCustom ViewsTradingLinkingHeat MapsWatch ListsCharts6
Getting AroundComponent Controls21351.1Settings icon to customize thecomponent.2.2Link Mode icon to change thecomponent's broadcast/receivebehaviour (see Linking).3.3Show/Hide icon to toggleconfiguration options.1.4Undock icon to detachcomponents to their own separatewindow.2.5Maximize/Restore icon to togglethe component view betweenmaximized and regular mode.4#TraderTip:Click onin Charts to bring up awindow showing all the technicalindicators, tools, and markers.Getting AroundBuilt-in ViewsCustom ViewsTradingLinkingHeat MapsWatch ListsCharts7
Built-in Trading ViewsAdvanced Dashboard has a variety of built-in trading layouts to help you get started.Trading tools are laid out and linked together to provide single-click analysis that caters toevery trading style.1231. Today2. Trade3. ChartsGetting AroundBuilt-in ViewsCustom ViewsTradingLinkingHeat MapsWatch ListsCharts8
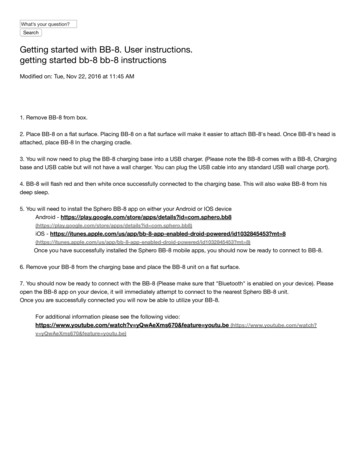
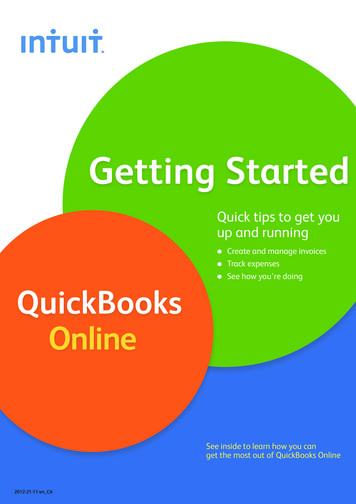
Today ViewThe Today view provides an at-a-glance display of your portfolio and of whatsectors and stocks are moving the markets.Getting AroundBuilt-in ViewsCustom ViewsTradingLinkingHeat MapsWatch ListsCharts9
Today View12341.1 Heat Maps provide a visualrepresentation of what's driving themarkets.2 Markets component provides real-time2.data for major Canadian and U.S.indices.3.3 Most Active component shows thestocks and options with the largesttrading volumes.1.4 Alerts allow you to create, view, andmodify real-time notifications for stocksand options.Getting AroundBuilt-in ViewsCustom ViewsTradingLinkingHeat MapsWatch ListsCharts10
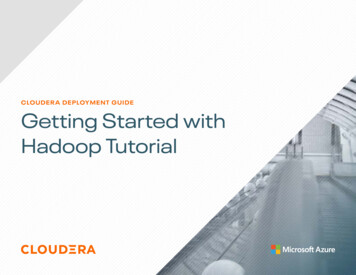
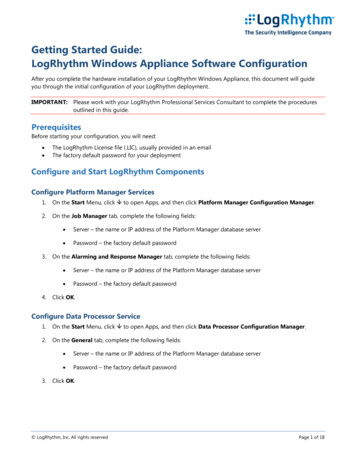
Trade ViewSee detailed stock and options quotes, news, analyst estimates, and analytics for anysecurity with (1) Watch List, (2) Quote Detail, (3) Option Chain, and (4) Analyticscomponents.1234Click here toswitch betweenMarket by Priceand Market asLadderGetting AroundBuilt-in ViewsCustom ViewsTradingLinkingHeat MapsWatch ListsCharts11
Trade ViewQuote DetailOption ChainAnalyticsQuote Detail displays quotes,News, and Analytics for a singlesecurity. In the Market Depthtab, switch between the Marketas Ladder and Market by Priceviews.Option Chain displays real-timedata for a selected symbol soyou can easily analyze call andput options.Analytics allows you to view keydata relating to both thecompany and security inquestion. View information suchas the company profile andfinancial statements, earningsand ratios, analyst evaluations,and trade history.Getting AroundBuilt-in ViewsCustom ViewsOption Chain Graph allows youto visually compare keyvariables across a number ofdifferent option series andexpirations.TradingLinkingHeat MapsWatch ListsCharts12
ChartsPerform advanced analysis by creating customized charts based on fundamental andtechnical indicators. With a diverse set of technical studies, probability analytics, anddrawing tools, create and customize (1) Charts for every security on your (2) Watch List.2Getting AroundBuilt-in ViewsCustom Views1TradingLinkingHeat MapsWatch ListsCharts13
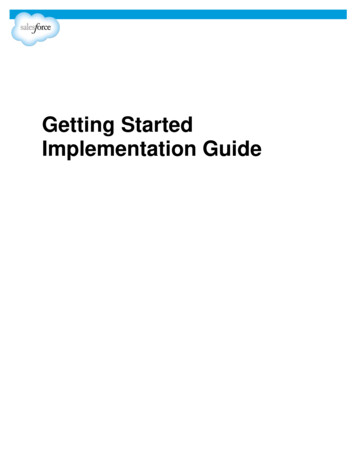
Creating a Custom Layout1.1Click on the 'Manage My Layouts' button in the top navigation bar.2.2Choose between Flexsheet, Desktop, or Accordion:3.3 Flexsheet allows you to define spaces and choose which components to place where Desktop gives you ultimate flexibility and allows for overlapping components Accordion allows you to vertically stack different components for you to scroll downTo add components to your Custom View, either: Click on Click on Right-click anywhere in the custom view windowwithin the custom view windowin your navigation bar#TraderTip: In Flexsheet layout,drag in from the outside edge tocreate a new window. Drag itback outwards to get rid of it.Getting AroundBuilt-in ViewsCustom ViewsTradingLinkingHeat MapsWatch ListsCharts14
Three Customizable Layouts2DesktopFlexsheet1Accordion3Getting AroundBuilt-in ViewsCustom ViewsTradingLinkingHeat MapsWatch ListsCharts15
Layout LibraryBrowse through your own layouts, share them with other Advanced Dashboard users, or add theirs toyour library.1Open the Layout Library by clicking on the ‘Manage Layouts’ button located on the mainnavigation bar2The Library is comprised of three distinctive categories: My Layouts, Layouts by TD, andLayouts by Other Users: Getting AroundIn 'My Layouts', you can publish yourown customized layouts and share themwith all other Advanced Dashboardusers.In 'Layouts by TD', you can viewlayouts published by TD Direct Investingand add them to your own library.In 'Layouts by Other Users’, you canview layouts published by otherAdvanced Dashboard users and addthem to your own library.Built-in ViewsCustom ViewsTradingLinkingHeat MapsWatch ListsCharts16
Buying & SellingTo open the Order Ticket, either click on the Buy/Sell button in your Trading Bar or clickon the Bid or Ask price of any stock or option.Choose which account to trade fromChoose thesecurity type andnameTo close the orderticket, just click theBuy/Sell button againGetting AroundBuilt-in Views#TraderTip: You canalso undock the orderticket to turn it into aseparate window!Specify the details of your tradeCustom ViewsTradingLinkingHeat MapsWatch ListsCharts17
How to Trade FasterRapid Order Entry capabilities in Advanced Dashboard are designed to allow you tomake trades and enter orders even faster so you never have to miss an opportunity.Skip Preview Orders & WarningsEnabling this allows for rapid order entry capabilitiesso you can send your trades direct to the market. Youwill bypass the Review screen and will not be askedto confirm your order, review warnings, or reviewcommissions.Remember PasswordEnabling this prevents you from having to enteryour password every time you make a tradeduring the current session.These settings persist for the entire session. To reset, close and relaunch the Dashboard.Getting AroundBuilt-in ViewsCustom ViewsTradingLinkingHeat MapsWatch ListsCharts18
LinkingWith Linking Mode, you can get the whole picture on a stock with just a single click. The Linking Mode icon looks like this:. It allows you to customize how toolscommunicate with each other. Once you set up your links, you can linkmultiple components across the platform sothey all change simultaneously to the stockyou're looking at. So, if your Watch List is set to broadcast onChannel 1 and your Market Depth is set toreceive Channel 1, clicking on a symbol inyour Watch List cause your Market Depthwindow to display that symbol. If you wish to broadcast symbols across alllayouts, select 'Broadcast Globally' within theLink Mode window.Getting AroundBuilt-in ViewsCustom ViewsSet the channel thatthe componentlistens onTradingLinkingBroadcast symbolsacross the entireplatformHeat MapsSet the channel thatthe componentbroadcasts toWatch ListsCharts19
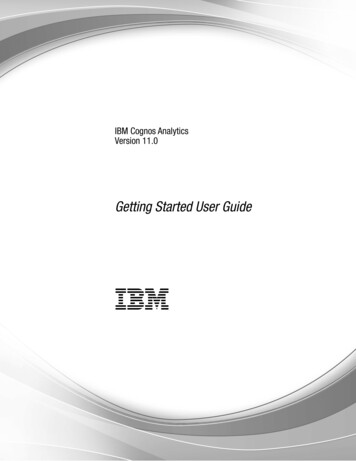
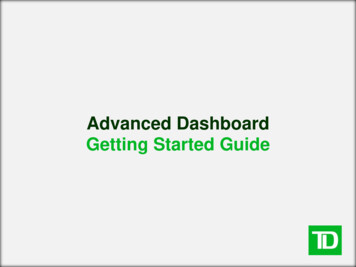
Heat MapsChange how you view the Heat Map by using the (1) Index, (2) Colour by, (3) Size by,and (4) Group by drop-down menus.1234Thisdisplays thecolour scalebeing usedon the HeatMapDouble-clickon a box toview the fullquote of thestockGetting AroundBuilt-in ViewsCustom ViewsTradingLinkingHeat MapsWatch ListsCharts20
Watch ListsBuilding New Watch Lists1. From any tab, go into the Watch List component2. Search the symbol or company name you wish to add3. Press "Enter"4. When you're done, click onand select "Save List"Importing Watch Lists1. Click onin the Watch List component window2. Select "Import TD Active Trader Watchlist"3. Choose the file you wish to import and click "Import"Managing Column Headers1. Click onin the Watch List component window2. Select "Manage Templates"3. Add or remove columns4. Click "Close"Getting AroundBuilt-in ViewsCustom ViewsTradingLinkingHeat MapsWatch ListsCharts21
ChartsAdvanced Dashboard has dozens of studies, indicators, drawing tools, andprobability analytics for you to use to enhance your trading.Adding Studies#TraderTip: Click ontobring up a window showing allthe indicators, tools, andmarkers!1. Right-click on the chart and select "Tools &Markers"2. From the drop-down list, choose whichstudies you wish to addAdding Indicators1. Right-click on the chart and select "ViewOptions", then "Indicators"2. From the drop-down list, choose whichindicators you want to add#TraderTip: the, found in the top right corner of the chartwindow, allows you to customize the tool further!Getting AroundBuilt-in ViewsCustom ViewsTradingLinkingHeat MapsWatch ListsCharts22
ChartsAdvanced Probability Analytics within the Charts component helps you validate yourtrades using market expectations.Probability Range tools estimates the range ofPrice Target drawing tool estimates the likelihoodexpected prices with a 68% and 95% degree ofthat a security will be above, below, and will touch aconfidence.certain price by a certain date.#TraderTip: Extend your analysis farther into the future by entering a larger number in the "Right-Side Expansion" box.Getting AroundBuilt-in ViewsCustom ViewsTradingLinkingHeat MapsWatch ListsCharts23
Disclosure/DisclaimerDisclosure/Disclaimer:The information contained herein has been provided by TD Direct Investing and is for informational purposes only. The information has beendrawn from sources believed to be reliable. Where such statements are based in whole or in part on information provided by third parties, theyare not guaranteed to be accurate or complete. The information does not provide financial, legal, tax, or investment advice. Particularinvestment, trading, or tax strategies should be evaluated relative to each individual’s objectives and risk tolerance. TD Direct Investing, TheToronto- Dominion Bank and its affiliates and related entities are not liable for any errors or omissions in the information or for any loss ordamage suffered.TD Direct Investing is a division of TD Waterhouse Canada Inc., a subsidiary of The Toronto-Dominion Bank. TD Waterhouse Canada Inc. –Member of the Canadian Investor Protection Fund. The TD logo and other trade-marks are the property of The Toronto-Dominion Bank.24
put options. Option Chain Graph allows you to visually compare key variables across a number of different option series and expirations. Analytics allows you to view key data relating to both the company and security in question. View information such as the company profile and financial statements, earnings and ratios, analyst evaluations, and trade history. Getting Around Built-in Views .