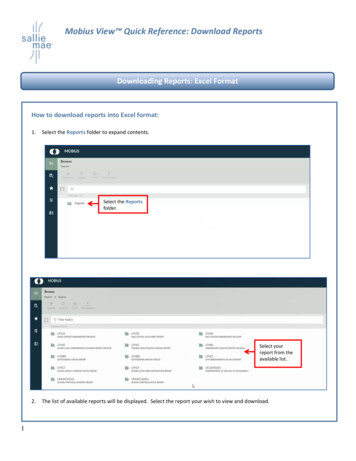
Transcription
Gallios TM Quick ReferencePurpose:The purpose of this Quick Reference is to provide a simple step by stepoutline of the information needed to perform various tasks on the system.We begin with basic tasks like starting up or shutting down the system andthen proceed to more involved software tasks. It is organized according tothe modules in the Gallios Flow Cytometer Training Modules. MajorHeadings (in blue) are the major groups of tasks. These headings may befurther subdivided into subsections of the major task and appear in alogical sequence. For example, the Major task of creating a protocol issubdivided into the subsections: Select Parameters, Create Plots,Instrument Settings, Create Regions, Gate, Analyze, and Save Protocol. Alist of the major tasks appears below in the Table of Contents.Table of ContentsStartupsShutdownCreating a ProtocolCreate a FlowPAGEAutoSetupAcquisition Manager (Panels)DatabaseOffline AnalysisSystem SetupPN A75199AA (May, 2009)P. 3P. 4P. 5P. 7P. 8P. 9P. 11P. 15P. 191 of 20
2 of 20PN A75199AA (May, 2009)
Startups Check external Sheath tank, fill the Cleaning agent tankand Empty the Waste tankPower the Computer and Monitor OnEnter a Windows password if any and select OK icon.Double clickSelect User nameEnter User password and select NextSelect Connect (to run samples) or Work Offline.Check gages System Pressure 30 Psi, Vac 17 in stfile tabFocusobjectListmodefile tabWorkspacePanelfile tabPlotProtocolsfile tabTabsCurrentWorkspaceprotocolAcquisition ManagerCommonly Used Toolbars:Save LMD Print Copy Undo PRISM Histogram Rectangle Elliptical PRISM Multilinear Gates Color PublishFilePlotPlotDivider 2 regionBlendHelpFileToolbarOpen LMD Save CutFileProtocolPasteRedo Dot Density Polygon Quadrant Contour Linear PRISM ColorPlotPlotregion Divider 1 Precedence ZoomPN A75199AA (May, 2009)3 of 20CalculateStats
StartPause & RotateAbortShutdownClenzManual tionManagerToolbarPauseStopFlow RatePrimeOpen WorklistSave PanelAdd TubeNew WorklistSave WorklistDelete CurrentTasksSingle TubeFixed ModeCustomize WorklistAdd PanelAutoschedulerPrintWorklistOpen ExternalOrderShutdown Place 2 ml of 10 % bleach solution in one tubePlace 2 ml of de-ionized water in each of 3 tubes Select Select thetab on the Resource ExplorerSelect the Common FolderSelect the cleanse.pnl and drag and drop it to the Acq.Mgr.Enter a carousel number 4 of 20on the toolbar to clear the Acq. Mgr.SelectbuttonSelect Yes if you wish to save the previous protocol or Noif notWhen the panel is finished, remove all tubesSelectStandby modein the upper right to exit theWhen finished selectsoftwareSelect NoSelectto turn off the cytometerSelect Start Shutdown OK to shutdown thecomputerPN A75199AA (May, 2009)
Creating a Protocol Select Parameters:Create Plots:Select File New New Protocol to clear theworkspace of all but one dotplot and single elliptical gateregion.Select Yes to save old protocol or No if you do not wish tosave it SelectCytometer Control on the toolbarsSelect Acquisition Setup tabSet Limits and Max events to stop accumulation later buttonSelectDeselect unwanted parametersSelect any desired parametersOptional: Set Ratio, Time and Derived ParametersClose shutters of unused lasersSelect FS Collection angle and SS desired ND filterSelect OKSelect Yes, enter a name and select Save Dot Plots (2 parameter) – Select, Histogram Plot(Single parameter)– Select, Density plot – Select Select Parameter(s) and then OK Repeat for each plot Select each plot Focus (top of the plot) in turn and drag theplot to the desired location on the Workspace Press CTRL T, select plot size, and then OK to arrangeplotsInstrument Settings: Single Tube Mode on the toolbarSelectPlace a sample for the application in position 10 on thecarousel Select SelectCytometer Control and then the Acq. Setup tabSelect Setup Mode and QuickSETChoose discriminator parameter and adjust Discriminator toexclude debris and noise but pass cellsAdjust the slider bars (top and side of each plot) beginningwith those to be used as gates for a correct patternSelect Acq. Setup tabIf needed, select QuickCOMP and adjust thecompensation using a proper sample until correct patternsare seen PN A75199AA (May, 2009)Run5 of 20
Create Regions Deselect Setup Mode, QuickSET, and QuickCOMPAllow the system to collect the desired amount of data Select Select each plot in turn and add regions:Dot Plots (2 Parameter Plots only):to stop or allow the system to reach a stop valuePolygon - selectMove the cursor to starting point on plot and left clickUse a click move technique to create all the sidesback to the starting pointRectangle – selectMove the cursor to the starting corner and left clickMove the cursor to the opposite corner and leftClick to complete the rectangleQuadrant – SelectMove the cursor to plot and left clickMove the region to anchor position and left clickAutgogate – Select ellipse or contourMove the cursor to desired population and left clickGate Histogram Plots:Linear – SelectMove the cursor to starting position and left clickMove the cursor to ending position and left clickMultilinear – SelectMove the cursor to first position and left clickMove the cursor to end of first region and left clickMove the cursor to end of second region and left clickContinue until all regions have been createdMove cursor to and left click to finish Move the cursor to lower right corner of plot to be gated Whenappears, left click and select GateIf you wish to apply the gate to all plots select that option(Note: later ungate the plot containing the gate region)Select Stop and Save tab and enter countSelect OKOptional: Stop Count Analyze Select Analysis Select ResultsDeselect all unwanted statistics and select all desiredstatistics and Select OKSave Protocol Select File Save Protocol or Select6 of 20PN A75199AA (May, 2009)
Create a FlowPAGE Add PlotsArrange PlotsSelect Insert Blank Flow PageMove the new page to a convenient area of the screen Move the cursor to the center of a plot Left click and drag and drop it onto the FlowPAGE Repeat for each plot Select theMaximize Window icon in the upper rightcorner of the FlowPAGE to expand the page to full screen Move each plot and move into positionOR Create a large rectangle completely encircling two plotsand stats Select the appropriate alignment tool (left orAdd Text top,bottom,right)Selecton the FlowPAGE toolbarMove the cursor to the location on the page and left clickType in desired text and select OKReshape the text box by grabbing a handle and pullingoutwardRight click in the box and select Properties to change font,fill, etc.Left click on another part of the page to finish on the FlowPAGE toolbarSelectLocate the directory where the image is storedSelect the desired image and then OpenMove the cursor to the desired location on the page and leftclickUse the handles to resize the imageLeft click on another part of the page to finishAdd Lines or Boxes SelectorMove to the starting pointHold the left button and drag to the ending pointSave FlowPAGE Select FlowPAGE Save FlowPAGE AsEnter a name and select SaveAdd Images PN A75199AA (May, 2009)7 of 20
AutoSetupNote: To enter a new application, you will need a base protocoland target channels for Flow-Set ProNew Application Schedule anApplication 8 of 20Select Tools AutoSetup Application DefinitionSelect Create a new application definitionSelect Current user only or All users as desiredSelect NextBrowse to find the base protocol that represents theapplicationSelect the base protocol and then OpenSelect NextSelect Filter Block and then NextOptional: select dyesSelect NextEnter the correct Flow-Set Pro target channelsSelect NextEnter an application name and select NextSelect Create a verification protocol if you wish the systemto generate a verification protocolOrSelect Add additional verifier, locate the protocol, andselect Open to add a verification protocolSelect NextThe system summarizes your entriesSelect Print if you wish and then FinishThe system now creates all protocols and FlowPAGESneeded for AutostandardizationSelect Tools AutoSetup SchedulerSelect desired applicationOrHold the CTRL key down and select multiple applicationsEnter a carousel number and select ScheduleSelect Run if you wish to run immediatelyOrSelect Close to prep tubes, place them on the system, orenter a calibration factor in the Acquisition ManagerSelecton the toolbar to run the samplesPN A75199AA (May, 2009)
Acquisition Manager (Panels) If it is not visible, select View (or right click)Select Acquisition Manager Select View Customize Worklist ColumnsSelect the desired columns to appear and then OK Select View Customize Worklist ColumnsLeft click on the column name until the name can bechangedType in the new name and press EnterWhen finished, select OKSelect ColumnsEdit Column Names Create a Panel Selectto clear the Acquisition ManagerSelectprotocol tab on the Resource ExplorerDrag and drop the desired first protocol to the AcquisitionManager Select theon the toolbar to add the desired number oftubes to the panelIf you wish to change the protocol in any of the tubes, select theOpen Protocol in the Protocol column forthat tubeSelect the desired protocol and then OpenRepeat as necessary for each tube Under Regions column, toggle the appropriate icon: to carry the regionto use the regions in that protocol,to the other tubes, orto import regions from anotherprotocolUnder the Cytosettings column, toggle the appropriate icon to: to use the cytosettings in the protocol, to pass thecytosettings to the next protocol, orto import cytosettingsfrom another protocolSelect OpenEdit the Parameter names for each tube to reflect the actualmeasurements (example: CD3, CD4, etc.)To Delete a Protocol Select the protocol line by its number and press DeleteTo Move a Protocol Select the protocol and drag and drop to the new positionPN A75199AA (May, 2009)9 of 20
Save Panel Create a WorklistRight click on Panel folderor panel area inAcq. Mgr.Enter a panel nameIf you desire to create a template in the database forReporting results, select Export results of panel toReport Generator on the Panel Save DialogSelect Save Selectthen:To Add Panels SelectPanels tab on the Resource ExplorerLocate the desired panel and drag and drop it to theAcquisition ManagerRepeat as desiredTo Add Protocols SelectProtocols tab on the Resource ExplorerLocate the desired protocol and drag and drop it tothe Acquisition ManagerRepeat as desired Clear Worklist to clear the Acq. Mgr.Editing ParameterNames Select the desired field (e.g. Under P1, P2, etc)Type in the desired information (e.g. Sample ID,Parameter name, etc.)Save Worklist SelectSave Worklist on the toolbarsEnter a worklist name and select SaveTo Run to clear Acquisition ManagerSelectSelect Worklist tab on Resource ExplorerLocate the desired worklist and drag and drop it tothe Acquisition ManagerEdit the boxes as desired To add Cal Factor, click onin the Cal Factorcolumn of the Acquisition ManagerEnter absolute count calibration value, verifyEnabled has been selected, and select OKEnter a carousel number in tube one position Select 10 of 20RunPN A75199AA (May, 2009)
DataBaseQC Product EditorEditing a Product Entering a NewProductQuality Control ReportSetting RegionPropertiesFrom the Report Generator toolbar selectProduct EditorSelect the desired product you wish to editSelect the desired information field to be editedMake the changeRepeat the process for each fieldWhen finished, select Save Prod then select Yes toconfirm update to the lot numberSelect OK From the Report Generator toolbar select Product Editor Select the New Product button Select the first information field Enter the information Repeat the process for each field When finished, select Save Prod then select Yes toconfirm update to the lot number Select OKSample data is sent to the database when samples are runand the protocol region properties are set correctly Drag and drop a protocol to the workspace Save the previous protocol or not as desired Select a region for statistics to be sent to thedatabase Right click the mouse and select Region Properties Select Region statistics to be exported for QualityControl Select a QC Product and select OK Repeat for each region to be used Save the protocolActivating QCTemplate(one time procedure) PN A75199AA (May, 2009)on the Report GeneratorSelecttoolbarChange instrument to DefaultSelect Template Select TemplateSelect desired template and then OpenSelect Template Save Template to save thetemplate with the system serial numberRepeat process for each template11 of 20
Select a Template Selecton the Report Generator toolbarSelect Template Select TemplateSelect desired template and then OpenSelect a point Left click on the point (a red line appears)Creating a NewQC Template First, enter the new QC product (earlier in database)and ensure the protocol has regions selected for QCexport with a QC productRun the protocol at least once Selecton the Report Generator toolbarSelect Template Clear TemplateSelect New Plot buttonClick on the header portion of the plotSelect user label and select a label from the list orenter the desired labelSelect the QC protocol from the listSelect the appropriate QC productSelect the lot numberSelect a parameter or regionSelect X or Y axisSelect a statisticWhen finished, select OKRepeat process for each new plotWhen finished, select Template Save AsEnter a name and select SaveAccessing a template on the Report Generator toolbarSelectSelect File Open and locate the desired templateSelect the template and then OpenCreating a Template First create a panel and then save the panel with theExport results of panel to report Generator selected SelectPanel Template on the ReportGenerator toolbarSelect File Open and locate the new blanktemplateSelect the template and then OpenSelect the desired global options on the Local tabPanel Template 12 of 20PN A75199AA (May, 2009)
Select each field in turn and enter the desiredinformationSelect Update to enter the information and clear thefieldsOrSelect Update & Retain to enter the informationonlyRepeat for each lineSelect Data Plots tab to add plotsWhen finished, select File Save Select Select Search button to list reportsHighlight desired report and then click on SelectDatabase Entry Selecton the Report Generator toolbarSelect NewEnter information in each desired field and selectSaveMaintenance Log Select, double click on item to logService Log Select, select field and enter information Panel ReporttoolbarPN A75199AA (May, 2009)Panel Report on the Report Generator13 of 20
14 of 20PN A75199AA (May, 2009)
Offline AnalysisRetrieve with RuntimeProtocol (protocol usedTo collect the data)Listmode tab on the Resource Explorer Select Locate the desired listmode file and drag and dropthe file to the Workspace If asked do you wish to clear acquisition data,answer Yes Save previous protocol as desired The protocol appears and the data shortly afterRetrieve with a DifferentProtocol Retrieve Multiple ListmodeFiles with Runtime Protocols Files with DifferentProtocolsPN A75199AA (May, 2009)SelectProtocols tab on the Resource ExplorerLocate the desired protocol drag and drop it theWorkspaceIf asked do you wish to clear acquisition data,answer YesSave previous protocol as desiredSelectListmode tab on the Resource ExplorerLocate the desired listmodeDrag and drop it to any one of the plots on theWorkspaceThe protocol will populate with the dataSelect Tools Listmode PlaybackRight click onAdd Protocol tool in thewindowSelect New Worklist SelectAdd Protocol tool once for eachaddition protocol Open FileUnder the LMD File column, selecticonSelect the desired listmode file and then OpenRepeat for all listmode filesSelect the Options tab and other desired optionsSelect the Single File Mode tab Select theRun tool in the windowThe files are displayedSame as previous action but with one addition:15 of 20
Batch Automator Select Tools AutoMATOR SetupTo remove old selected files from the list: selectthe files and then the Remove Files buttonSelect Add FilesSelect the desired files and then OpenTo change the order: Select a file and drag and dropit to a new positionSelect the desired process option next to the files ( pass, pause 12 seconds, stop and wait torestart)Select the desired output option Listmode Playback ToolSelect theOpen Protocol icon under theProtocol columnSelect the desired protocol and then OpenRepeat for each protocol To process: Selecttoolbar Select Tools Listmode Playback Select either thePanel SelectOpen for the first listmode fileSelect the listmode file and then OpenRepeat for each listmode file If desired, select theOpen for each protocol inturnSelect the desired protocol and then OpenSelect Options tab and desired optionsSelect Single File Mode tab Run on the AutomatorAdd Protocol orAdd Selecttool in the windowThe files are displayedPublishingSet Preferences 16 of 20Press CTRL W and select Publish tabSelect the desired publishing option Publish to TextFile or Publish Data to MS Excel or bothSelect desired data formatSelect desired bitmap sizePN A75199AA (May, 2009)
Select desired File References optionSelect whether or not to switch to Excel on publishSelect OK Select Tools Publish Results NowEnter name and select SaveSystem opens MS Excel and displays data Press CTRL W and select Gating tabColor Precedence Select Automatic Color PrecedenceSelect OKSelectColor Precedence Setup on the toolbarsEdit colors as desiredMove regions using a drag drop techniqueSelect OKColor will be assigned to dots based on the colorlocated highest on Precedence list (top position)Color Blend Select Color Blend Mode Select OK SelectColor Blend Setup Select 3 different regions to blend Select OKColor will be assigned based on the number of theregions satisfied by the eventOutputAssigning Color to Dot PlotsCopy and PasteCopy Image Select a plotRight click and select Copy Plot ImagePaste Image Open the desired program (e.g. PowerPoint, Word) Select desired area Select Edit PasteCopy Data Paste Data Open the desired program (e.g. MS Excel) Select desired area Select Edit PasteFreeze Single HistogramPlotsPN A75199AA (May, 2009) Select plotRight click and select Copy Plot DataRun a sample or retrieve a listmode fileChoose a histogram plot to apply freeze frame17 of 20
Move the cursor to the lower right corner of the plotUntilappearsLeft click and select the Histogram tabSelect Freeze Frame and then OKRun another sample or retrieve another file, anoutline of the previous file appears on top of thenew fileYou can repeat the process to achieve 2 freezeframes on top of a new fileBaseline Offset Select File Workspace Preferences Select Plot Display tab Select Baseline Offset On System adds a randomized positive Gaussian offsetto thelow channels bringing the negative populationout from channel zero on log displaysListmode Compensation SelectListmode tab on the Resource Explorer Select desired listmode file Drag and drop it to the workspace Select Analysis LMD Quick COMP Adjust the slider bars to change the compensation The data responds accordingly Save recompensated file (file extension will beCMP)18 of 20PN A75199AA (May, 2009)
System SetupAdministration Functions Select a the user with administration privileges Enter the user password Select Admin button Select the user, enter both the user andadministration passwords and select OKAdd a User Group Users Select Workgroups Select Edit and then Add Rename your workgroup as d
the modules in the Gallios Flow Cytometer Training Modules. Major Headings (in blue) are the major groups of tasks. These headings may be further subdivided into subsections of the major task and appear in a logical sequence. For example, the Major task of creating a protocol is subdivided into the subsections: Select Parameters, Create Plots,File Size: 310KB
