Transcription
Manufacturing Cost Analysis for ProtonExchange Membrane WaterElectrolyzersAhmad Mayyas, Mark Ruth, Bryan Pivovar, Guido Bender,and Keith WipkeNational Renewable Energy LaboratoryNREL is a national laboratory of the U.S. Department of EnergyOffice of Energy Efficiency & Renewable EnergyOperated by the Alliance for Sustainable Energy, LLCThis report is available at no cost from the National Renewable EnergyLaboratory (NREL) at www.nrel.gov/publications.Contract No. DE-AC36-08GO28308Technical ReportNREL/TP-6A20-72740August 2019
Manufacturing Cost Analysis for ProtonExchange Membrane WaterElectrolyzersAhmad Mayyas, Mark Ruth, Bryan Pivovar, Guido Bender,and Keith WipkeNational Renewable Energy LaboratorySuggested Citation (Arial 12 pt Bold)Mayyas, Ahmad, Mark Ruth, Bryan Pivovar, Guido Bender, and Keith Wipke. 2018.Manufacturing Cost Analysis for Proton Exchange Membrane Water Electrolyzers.Golden, CO: National Renewable Energy Laboratory. sti/72740.pdf.NREL is a national laboratory of the U.S. Department of EnergyOffice of Energy Efficiency & Renewable EnergyOperated by the Alliance for Sustainable Energy, LLCTechnical ReportNREL/TP-6A20-72740August 2019This report is available at no cost from the National Renewable EnergyLaboratory (NREL) at www.nrel.gov/publications.National Renewable Energy Laboratory15013 Denver West ParkwayGolden, CO 80401303-275-3000 www.nrel.govContract No. DE-AC36-08GO28308
NOTICEThis work was authored by the National Renewable Energy Laboratory, operated by Alliance for SustainableEnergy, LLC, for the U.S. Department of Energy (DOE) under Contract No. DE-AC36-08GO28308. Fundingprovided by the Laboratory Directed Research and Development (LDRD) Program at NREL. The views expressedherein do not necessarily represent the views of the DOE or the U.S. Government.This report is available at no cost from the National RenewableEnergy Laboratory (NREL) at www.nrel.gov/publications.U.S. Department of Energy (DOE) reports produced after 1991and a growing number of pre-1991 documents are availablefree via www.OSTI.gov.Cover Photos by Dennis Schroeder: (clockwise, left to right) NREL 51934, NREL 45897, NREL 42160, NREL 45891, NREL 48097,NREL 46526.NREL prints on paper that contains recycled content.
AcknowledgmentThis work was supported by the Laboratory Directed Research and Development (LDRD) Program atthe National Renewable Energy Laboratory (LDRD 10012-17.02.01 H2 @scale)iiThis report is available at no cost from the National Renewable Energy Laboratory (NREL) at www.nrel.gov/publications.
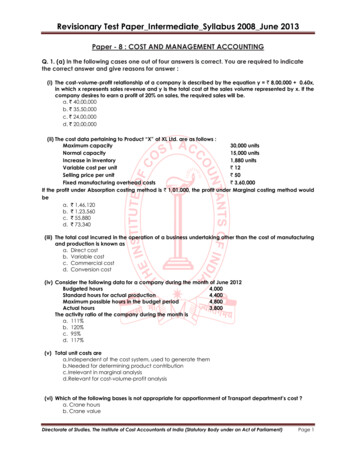
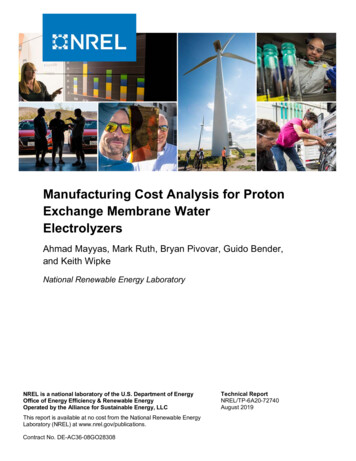
Executive SummaryHydrogen is produced by several means, including water electrolysis, in which water molecules are splitinto hydrogen and oxygen molecules. Low cost high-capacity electrolysis system is a key technologythat can support greater deployment of zero-carbon hydrogen for a variety of applications and representsa technology that can potentially facilitate integration of greater renewable electricity sources. Whilethere are several commercial electrolysis systems, proton exchange membrane (PEM) technology hasemerged as a development opportunity because of its versatility. High differential operating pressure,variable operating condition potential, high current densities, high power densities, and high efficienciesare among the advantages of the PEM electrolyzer over other commercial or near-commercialelectrolysis technologies. In this report, we discuss bottom-up manufacturing cost analysis for the PEMelectrolyzers across various power ratings at several annual production rates. We also study the impactof manufacturing economies of scale on the cost of the PEM electrolyzer and how this can be linked toreducing the cost of hydrogen production.Bottom up costing models were developed for the kay parts in the stack. Cost model results show thatdirect material costs dominate stack costs at high production volume (Figure ES-1). Stack cost for 1MW system can be reduced from 237/kW ( 10%) at annual production rate of 10 MW/yr (e.g., 1-MWsystems at a production rate of 10 unit/year) to about 101 ( 10%) at annual production rate of 1,000MW (e.g., 1-MW systems at a production rate of 1,000 unit/year). We expect smaller cost reductions inthe “balance of plant” cost because most parts are outsourced from suppliers that are manufacturing thecomponents for multiple markets and thus are at high volume already. Depending on the productionvolume, we found that CCM shares about 26%–47% for 200-kW PEM stack and about 36%–47% forthe 1-MW stack, with PTL contributing around 17%–25% of the stack cost, bipolar plates about 12%–21%, and end plates and assembly near 3%–13%. Parametric sensitivity analysis shows that the finalstack cost is sensitive to manufacturing process yields, power density of the cell, gold layer thickness onporous transport layer and bipolar plates and Pt loading in the catalyst coated membrane. Balance-ofplant cost for a 1-MW electrolyzer contribute to about two-thirds of the system cost, with powerelectronics contributing half the BOP cost, while the water circulation and hydrogen processingsubsystems each share about one-fifth of the BOP cost.We also analyzed several scenarios to study the effect of changing certain cell design parameters andmanufacturing process on the stack and system cost for PEM electrolyzers. These proposed scenariosrepresent cases for the future PEM system design and the potential cost reductions when more advancedmanufacturing processes are introduced and adopted in PEM electrolyzer production (Figure ES-2).Some scenarios we ran here include adoption of the high-throughput, automated manufacturingprocesses that have high process yields, such as roll-to-roll manufacturing of catalyst-coated membraneand advanced coating processes for metal plates which could reduce the cost for the PEM electrolyzerstack from 237/kW ( 10%) at a production volume of 10 MW (e.g., 1-MW systems at a productionrate of 10 units/year) to 69/kW ( 10%) at 1,000 MW (e.g., 1-MW systems at 1,000 unit/year). Systemcost of 1-MW electrolyzer, including stack and balance of plant, could also be reduced throughmanufacturing economies of scale – from 561/kW ( 10%) at 10 units/year to 265/kW ( 10%) at1,000 units/year. The base year for the analysis is 2015, so all cost numbers presented in this report areexpressed in 2015 dollars.In terms of the effect of the electrolysis system capital cost on hydrogen production cost, we found thatelectricity price in addition to the electrolyzer capital cost play key role in determining the cost ofiiiThis report is available at no cost from the National Renewable Energy Laboratory (NREL) at www.nrel.gov/publications.
hydrogen production via water electrolysis. Thus, any cost reduction in the electrolyzer cost will helpreduce the cost of hydrogen production process.Figure ES-1. 1-MW PEM electrolyzer system cost at different annual production rates(The annual production rate is the number of electrolyzer systems produced in one year)Figure ES-2. Waterfall charts showing areas where R&D can play a role in reducing the cost of the 1-MWelectrolysis systemAssumptions: improvement in power density ( 20%); Pt loading from 11 g/m2 to 1 g/m2, membrane cost (Nafion 117 vs.Solvay E98-09S), and power electronics (-20%). Economy of scale is the manufacturing cost of 10 units/yr vs. 100 units/yr vs.1,000 units/yr.ivThis report is available at no cost from the National Renewable Energy Laboratory (NREL) at www.nrel.gov/publications.
Table of Contents123Introduction . 1Electrolyzer Functional Specifications and System Design. 4Costing Approach and Considerations . 64Manufacturing Cost Model for PEM Electrolyzer . 105Results and Discussion. 163.13.2Modeling Approach . 6Parameters of the Manufacturing Cost Model . 84.14.24.34.44.5Catalyst-Coated Membrane . 10Porous Transport Layer . 11Membrane Electrode Assembly (MEA) and Frame/Seal . 12Bipolar and End Plates. 13Stack Assembly. 135.15.25.3Cost of the Stack Parts . 16Balance-of-Plant Cost . 24PEM Electrolyzer System Cost. 286 Sensitivity Analysis and Potential Cost Reductions . 327 Installed System Cost . 368 Effect of Electrolyzer Capital Cost on the Hydrogen Production Cost .389 Conclusions . 39References . 40vThis report is available at no cost from the National Renewable Energy Laboratory (NREL) at www.nrel.gov/publications.
List of FiguresFigure 1. Cell repeat unit showing key components in the PEM electrolyzer – additional units would be stacked tothe right and left of this repeating unit to form a PEM electrolysis stack . 2Figure 2. Schematic of the PEM electrolysis system showing stack and BOP parts . 5Figure 3. Process flow for catalyst deposition using spray coating . 11Figure 4. Process flow of the powder metallurgy process for producing titanium felts used as in the PTL12Figure 5. Process flow for producing metal bipolar plates . 13Figure 6. Process flow for semi-automatic assembly line . 15Figure 7. Manufacturing cost curves for CCM made via spray coating. 18Figure 8. Manufacturing cost curves for the titanium-based PTL . 19Figure 9. Cost of carbon cloth vs. Ti-based PTL. 20Figure 10. Manufacturing cost curves for the frame . 21Figure 11. Manufacturing cost curves for the stamped stainless-steel plates bipolar plates . 22Figure 12. Manufacturing cost analysis for stack assembly process . 23Figure 13. Cost breakdown for the BOP parts. 26Figure 14. Manufacturing cost curve for (a) 200-kW PEM electrolyzer stack, (b) manufacturing cost curve for 1MW PEM electrolyzer stack, (c) cost breakdown for 200-kW stack, and (d) cost breakdown for 1MW stack. 29Figure 15. Cost curves for (a) 200-kW and (b) 1-MW electrolyzer systems showing costs of stack and BOP, andcost breakdown for (c) 200-kW and (d) 1-MW electrolyzer systems at different annual productionrates. 31Figure 16. Impact of changing some manufacturing and cell design parameters on 200-kW PEM stack cost: (a) at100 units/yr, and (b) at 1,000 units/yr, and 1-MW stack cost at (c) at 100 units/yr, and (d) at 1,000units/yr . 34Figure 17. Waterfall charts showing areas where R&D can play a role in reducing the cost of the electrolysissystem for (a) 200 kW system and (b) 1-MW system . 35Figure 18. Installed system cost . 37Figure 19. Effect of the capital cost, capacity factor, and electricity price on the cost of hydrogen production(excluding compression, storage and dispensing CSD cost) . 38Figure A1. Functional cell dimensions . 43Figure A2. Example of the polarization curves for PEM electrolyzer cells . 44viThis report is available at no cost from the National Renewable Energy Laboratory (NREL) at www.nrel.gov/publications.
List of TablesTable 1. Functional Specifications of the PEM Electrolysis System (Appendix A reports details). 4Table 2. Scope of the Manufacturing Cost Models . 7Table 3. Manufacturing Cost Shared Parameters . 8Table 4. Some Parameters Used in Developing the Cost Model for PEM Electrolyzer Stack. 10Table 5. Cost of the Balance-of-Plant Parts . 27Table B.1. Cost Components and Their Mathematical Formulas . 50Table C.1. Manufacturing parameter for spray coating process of the catalyst coated membrane . 52Table C.2. Manufacturing parameter for Powder metallurgy of the Porous Transport Layer. 53Table C.3. Manufacturing parameter for injection molding of the Seal/Frame . 54Table C.4. Manufacturing parameter for stamped and coated bipolar plates . 55Table C.5. Manufacturing parameter for stack assembly process . 56viiThis report is available at no cost from the National Renewable Energy Laboratory (NREL) at www.nrel.gov/publications.
1 IntroductionAlthough hydrogen is abundant on the Earth in the form of water, it requires energy to split watermolecules into hydrogen molecules. Hydrogen can be made by several means, including waterelectrolysis, hydrocarbon reforming/gasification, renewable liquid hydrocarbon reforming, andfermentation of the biomass feedstocks (AFDC n.d.).Most of today’s anthropogenic hydrogen, both internationally and in the U.S., is produced bysteam methane reforming of natural gas (AFDC n.d.). The steam methane reforming processconsists of two process steps. In the first step, the major component of natural gas, methane(CH4), reacts with steam to form hydrogen and carbon monoxide. In the second step, water gasshift, carbon monoxide is reacted with steam to produce additional hydrogen and carbon dioxide(Air Products 2013). Pressure swing adsorption (PSA) technology is needed for hydrogenpurification in the steam-methane reforming (SMR) process, to get high purity hydrogen suitablefor fueling fuel cell electric vehicles (FCEVs). The PSA process involves the adsorption ofimpurities from a hydrogen rich feed gas onto a fixed bed of adsorbents at high pressure. Theimpurities are subsequently desorbed at low pressure into off-gas stream which results inproduction of an extremely pure hydrogen product (99.999%) (Howe-Baker, 2017). Steammethane reforming systems have high production rates, and need large investment to install,which makes them suitable for central production facilities that produce tons of hydrogen everyday.Water electrolysis is the second most common method of hydrogen production. Among thechallenges that face water electrolysis is the high system cost for electrolysis systems whichresulted in low penetrations of PEM electrolysis technology in the markets. Three major types ofelectrolyzers are either currently produced commercially or could be produced commercially inthe near future: Alkaline electrolyzers are a demonstrated water electrolysis technology at large scale, butthey tend to have lower system efficiency.Polymer electrolyte membrane (PEM) electrolyzers work at temperatures between 50 Cand 95 C. PEM electrolysis is a commercial technology that could still be improved throughadditional R&D.Solid oxide electrolyzers are still in early commercialization stage and still need more workto scale up into commercial systems.Alkaline electrolysis is considered a mature technology and has been marketed for decades. PEMelectrolysis technology, on the other hand, has positioned itself as a competitive technology, butPEM systems are still designed at lower capacities ( 1 MW) and have higher costs than alkalineelectrolyzers (Schmidt et al., 2017a, Bertuccioli et al., 2014). In the U.S., Proton (NEL) and Ginerand others have started to produce PEM electrolyzers because (1) manufacturing costs havedecreased significantly in the last few years and (2) PEM electrolyzers tend to have higher currentdensities ( 5X of the alkaline electrolyzers) and higher efficiencies (up to 6% higher than alkalineelectrolyzers (see Bertuccioli et al., 2014; Hamdan 2013; Ayers et al. 2012, Carmo et al., 2015).A PEM electrolyzer stack consists of repeating cells that are electrically connected in series andreactant water/product gas connected in parallel (Figure 1). Thick metal plates (called end plates)1This report is available at no cost from the National Renewable Energy Laboratory (NREL) at www.nrel.gov/publications.
from both ends are added to structurally hold these cells inside the stack. At the core of each ofthese modules is a polymer membrane with cathode and anode catalyst layers coated on the bothsides of the membrane to form what is called catalyst-coated membrane (CCM). The poroustransport layer (PTL) is a layer that enhances water diffusion and water splitting reaction on thesurface of the membrane in the electrolysis cells. Bipolar plates, as the name suggests, have acathodic side and an anodic side. Their main function is to separate cells in the stack, and theyhave channels that facilitate the transport of water, hydrogen, and oxygen inside the stack(Hamdan 2013; Ayers et al. 2012).Figure 1. Cell repeat unit showing key components in the PEM electrolyzer – additional unitswould be stacked to the right and left of this repeating unit to form a PEM electrolysis stackPEM electrolyzer stacks have many similar parts as PEM fuel cell stacks and—include the CCM,a gas diffusion layer, and bipolar plates. Many technoeconomic studies have revealed thatsignificant cost reductions are possible for manufacturing these parts for fuel cells andelectrolyzers with economies of scale (Contini et al. 2017; James et al. 2013; James and DeSantis2015; Wei et al. 2014).This document reports a detailed cost analysis of PEM electrolysis systems and identifies somepotential areas where cost reductions could be targeted. The results of this work could help directfuture research and development (R&D) for the PEM electrolysis manufacturing. Morespecifically, the objectives of this work include to: Develop detailed bottom-up manufacturing cost analysis for key systems and parts in thePEM water electrolysis systemIdentify cost drivers for the PEM electrolyzer and areas for potential cost reduction areasInvestigate effect of economies of scale and learning experience on the cost of the PEMelectrolysis systems and the impact of the system cost on hydrogen production cost.This report starts with a summary of some findings from previous technoeconomic studieson electrolyzers and fuel cells, which we used to estimate the parameters for the cell design andfunctional specifications for the water electrolysis system (Section 2). The report then proceedsin Section 3 to a discussion of the methods used to develop the manufacturing cost of PEMelectrolyzers. Sections 4 and 5 discuss manufacturing processes used to make the key parts in thePEM stack and the expected cost associated with the manufacturing of these parts in the stack2This report is available at no cost from the National Renewable Energy Laboratory (NREL) at www.nrel.gov/publications.
and the cost of the balance-of-plant (BOP) parts. Section 6 provides some sensitivity analysis forsome important cell design and manufacturing parameters that could play role in reducing thecost of the PEM stack. Section 7 expands on Section 5 by reporting total system cost estimatesincluding markup factor and installation cost. Section 8 addresses the impacts of the economiesof scale electrolyzer costs and translates those capital costs to levelized costs hydrogen.3This report is available at no cost from the National Renewable Energy Laboratory (NREL) at www.nrel.gov/publications.
2 Electrolyzer Functional Specifications andSystem DesignWe started this cost analysis study by defining the system diagram and determining the criticalcost components. Next, we used data from the literature, industry inputs, and product fact sheetsfor commercial PEM electrolysis systems to obtain functional and operational parameters at thestack and system levels. These functional and design parameters are often referred to asfunctional specifications. We then developed a bottom-up cost analysis for each of the criticalstack cost components (i.e., CCM, PTL, membrane electrode assembly [MEA] frame/seal,bipolar plate, and stack assembly). Finally, we sum the individual cost curves for each stack partto calculate the overall stack cost in /kW.Functional specifications for 200-kW and 1-MW electrolysis systems are shown in Table 1. Aschematic of the PEM electrolysis system is shown in Figure 2. The stack represents the coreof the system where electrochemical reactions take place. The “balance of plant” (BOP) iscomposed of several subsystems that provide secondary functions in the electrolyzer system. Themajor subsystems in the BOP and key parts in each system include: Power supply: AC/DC rectifier, DC voltage transducer, and DC current transducerDeionized water circulation system: oxygen separator tank, circulation pump, piping, valvesand instrumentation, and controlsHydrogen processing: dryer bed, hydrogen separator, tubing, and valves and instrumentationCooling: plate heat exchanger, cooling pump, valves and instrumentation, and dry coolerMiscellaneous: compressed air valve, ventilation and safety requirements (combustible gasdetector and exhaust ventilation).Table 1. Functional Specifications of the PEM Electrolysis System (Appendix A reports details)ParameterValueUnitStack power2001,000kWGross system power2201,100kWAverage hydrogen (H2) production rate30170Nm3/hrAverage H2 production rate80400kg/day0%–100%0%–100%Turndown ratioOperating Pressure0- 30barTotal plate area957cm2CCM coated area748cm2Single cell active area680cm29%Single cell amps1,156ACurrent density1.70A/cm2Reference voltage1.70VPower density2.89W/cm2Gross cell inactive area4This report is available at no cost from the National Renewable Energy Laboratory (NREL) at www.nrel.gov/publications.
ParameterValuePlatinum (Pt) loading- anode (g/m2)7.0g/m2Platinum-iridium loading- cathode (g/m2)4.0g/m21,965WSingle cell powerCells per systemUnit10251012102255cells525kWOther paras. Loads1575kWParasitic loss20100kWStacks per systemCells per stackWater pumpcellsstacksValues in italic are parasitic losses in the balance of plant (BOP) and represent average values from several sources.Figure 2. Schematic of the PEM electrolysis system showing stack and BOP parts5This report is available at no cost from the National Renewable Energy Laboratory (NREL) at www.nrel.gov/publications.
3 Costing Approach and ConsiderationsThis section describes the overall costing approach and the underlying assumptions used indeveloping cost models. Several cost components are included in the direct manufacturing costmodel to account for all cost incurred in the final products. These cost components includematerial, labor, capital, energy, maintenance, facility/building, and scrap costs. Thesecomponents represent direct manufacturing cost, excluding research and development cost, sales,general and administration cost, warranty cost or debt service cost. However, all these indirectcost components are combined in the markup factor, which was assumed to be 50% of the totaldirect manufacturing cost (James and DeSantis 2015; Saggiorato et al. 2017).Bottom up manufacturing cost models were developed for several parts in the stack: Catalyst coated membrane (CCM) Porous transport layer (PTL) Seal/Frame Bipolar plates Stack assembly and end platesCost values for BOP parts were collected from quotes we received from part suppliers for thecritical parts in the BOP and estimates in the literature for general purpose parts such as piping,pressure gauges, valves, water pumps, and other parts. Assembly and testing are the mainmanufacturing processes that take place in assembling BOP parts within the system. The directcost of BOP parts and their assembly and testing costs are then added to the direct manufacturingcost using bottom-up approach for the stack modules to estimate the final electrolyzer systemcost.A make-or-buy decision is based on whether the part is readily available as a commodity item, ifit is an off-the-shelf part, or if it is a special manufactured part that necessitates certain designand manufacturing routes, or if the parts are associated with proprietary manufacturing processes(e.g., Nafion membrane 1). If the product falls outside the scope of the regular business thatelectrolyzer manufacturers do (e.g., manufacture pumps, valves, tubes, and electroniccomponents), the decision was made to outsource these parts from suppliers and include theprice in the BOP cost analysis. In this analysis, BOP components are all assumed to beoutsourced from part vendors, while key stack parts are assumed to be largely manufactured inhouse.3.1 Modeling ApproachThis section describes the direct manufacturing cost modeling approach developed for the PEMelectrolyzer stack components and the cost analysis of the balance of plant (BOP). The first stepin the bottom-up costing analysis is to define the electrolyzer system configuration and key1Nafion is a registered trademark of DuPont.6This report is available at no cost from the National Renewable Energy Laboratory (NREL) at www.nrel.gov/publications.
subsystems in it. Next, literature reviews and industry inputs are used to obtain functional andoperational stack and system parameters (also known as functional specifications). The systemconfiguration and functional specifications are then used to define the system size, keysubsystems and system components, and stack and system performance specifications. Then, weuse these specifications and system functional parameters to develop the direct manufacturingcost model (Wei et al., 2014).The direct manufacturing cost analysis uses activity-based costing for the major manufacturingprocesses required to make the key components in the PEM stack. A machine rate thatcorresponds to annual production rates is computed and broken down by cost components thatcover capital, facilities, energy, and maintenance costs. To obtain the process cost permodule/part, one can multiply machine rates expressed in dollars per hours ( /hr) by the totaltime required to finish each part or batch of parts. Normalized manufacturing cost per part( /piece) is calculated by dividing machine rate ( /hr) over line throughput (piece/hr). Labor andmaterial costs are added to the normalized part cost ( /piece) to calculate the final part cost in( /piece). Overall manufacturing costs are then calculated as the sum of all modules or costcomponents normalized to the annual production rates in units per year 2.Several cost components are included in the direct manufacturing cost model to account for allcost incurred in the final products. These cost components include material, labor, capital,energy, maintenance, facility, and scrap costs. And, these components represent directmanufacturing cost, excluding any research and development cost, sales, general andadministration cost, warranty cost or debt service cost. However, all these indirect costcomponents are combined in the markup factor (Saggiorato et al. 2
1,000 units/year. The base year for the analysis is 2015, so all cost numbers presented in this report are expressed in 2015 dollars. In terms of the effect of the electrolysis system capital cost on hydrogen production cost, we found that electricity price in addition to the electrolyzer capital cost play key role in determining the cost of