Transcription
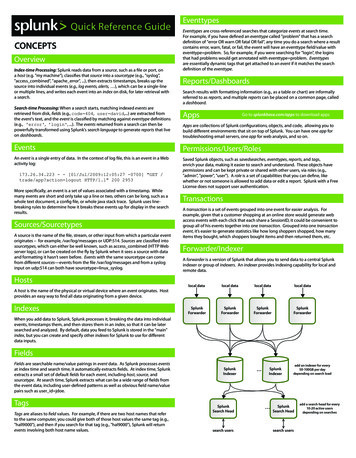
Quick Reference GuideCONCEPTSOverviewIndex-time Processing: Splunk reads data from a source, such as a file or port, ona host (e.g. "my machine"), classifies that source into a sourcetype (e.g., "syslog","access combined", "apache error", .), then extracts timestamps, breaks up thesource into individual events (e.g., log events, alerts, ), which can be a single-lineor multiple lines, and writes each event into an index on disk, for later retrieval witha search.Search-time Processing: When a search starts, matching indexed events areretrieved from disk, fields (e.g., code 404, user david,.) are extracted fromthe event's text, and the event is classified by matching against eventtype definitions(e.g., 'error', 'login', .). The events returned from a search can then bepowerfully transformed using Splunk's search language to generate reports that liveon dashboards.EventtypesEventtypes are cross-referenced searches that categorize events at search time.For example, if you have defined an eventtype called "problem" that has a searchdefinition of "error OR warn OR fatal OR fail", any time you do a search where a resultcontains error, warn, fatal, or fail, the event will have an eventtype field/value witheventtype problem. So, for example, if you were searching for "login", the loginsthat had problems would get annotated with eventtype problem. Eventtypesare essentially dynamic tags that get attached to an event if it matches the searchdefinition of the eventtype.Reports/DashboardsSearch results with formatting information (e.g., as a table or chart) are informallyreferred to as reports, and multiple reports can be placed on a common page, calleda dashboard.AppsGo to splunkbase.com/apps to download appsApps are collections of Splunk configurations, objects, and code, allowing you tobuild different environments that sit on top of Splunk. You can have one app fortroubleshooting email servers, one app for web analysis, and so on.EventsPermissions/Users/RolesAn event is a single entry of data. In the context of log file, this is an event in a Webactivity log:Saved Splunk objects, such as savedsearches, eventtypes, reports, and tags,enrich your data, making it easier to search and understand. These objects havepermissions and can be kept private or shared with other users, via roles (e.g.,"admin", "power", "user"). A role is a set of capabilities that you can define, likewhether or not someone is allowed to add data or edit a report. Splunk with a FreeLicense does not support user authentication.173.26.34.223 - - [01/Jul/2009:12:05:27 -0700] "GET /trade/app?action logout HTTP/1.1" 200 2953More specifically, an event is a set of values associated with a timestamp. Whilemany events are short and only take up a line or two, others can be long, such as awhole text document, a config file, or whole java stack trace. Splunk uses linebreaking rules to determine how it breaks these events up for display in the searchresults.Sources/SourcetypesA source is the name of the file, stream, or other input from which a particular eventoriginates – for example, /var/log/messages or UDP:514. Sources are classified intosourcetypes, which can either be well known, such as access combined (HTTP Webserver logs), or can be created on the fly by Splunk when it sees a source with dataand formatting it hasn’t seen before. Events with the same sourcetype can comefrom different sources—events from the file /var/log/messages and from a sysloginput on udp:514 can both have sourcetype linux syslog.HostsA host is the name of the physical or virtual device where an event originates. Hostprovides an easy way to find all data originating from a given device.IndexesWhen you add data to Splunk, Splunk processes it, breaking the data into individualevents, timestamps them, and then stores them in an index, so that it can be latersearched and analyzed. By default, data you feed to Splunk is stored in the "main"index, but you can create and specify other indexes for Splunk to use for differentdata inputs.FieldsFields are searchable name/value pairings in event data. As Splunk processes eventsat index time and search time, it automatically extracts fields. At index time, Splunkextracts a small set of default fields for each event, including host, source, andsourcetype. At search time, Splunk extracts what can be a wide range of fields fromthe event data, including user-defined patterns as well as obvious field name/valuepairs such as user id jdoe.TagsTags are aliases to field values. For example, if there are two host names that referto the same computer, you could give both of those host values the same tag (e.g.,"hall9000"), and then if you search for that tag (e.g., "hal9000"), Splunk will returnevents involving both host name values.TransactionsA transaction is a set of events grouped into one event for easier analysis. Forexample, given that a customer shopping at an online store would generate webaccess events with each click that each share a SessionID, it could be convenient togroup all of his events together into one transaction. Grouped into one transactionevent, it’s easier to generate statistics like how long shoppers shopped, how manyitems they bought, which shoppers bought items and then returned them, etc.Forwarder/IndexerA forwarder is a version of Splunk that allows you to send data to a central Splunkindexer or group of indexers. An indexer provides indexing capability for local andremote data.
SEARCH LANGUAGECOMMON SEARCH COMMANDSA search is a series of commands and arguments, each chained together with " "(pipe) character that takes the output of one command and feeds it into the nextcommand on the right.search-args cmd1 cmd-args cmd2 cmd-args .COMMANDchart/timechartdedupSearch commands are used to take indexed data and filter unwanted information,extract more information, calculate values, transform, and statistically analyze. Thesearch results retrieved from the index can be thought of as a dynamically createdtable. Each search command redefines the shape of that table. Each indexed eventis a row, with columns for each field value. Columns include basic information aboutthe data as well as columns that are dynamically extracted at search-time.At the head of each search is an implied search-the-index-for-events command,which can be used to search for keywords (e.g., error), boolean expressions(e.g., (error OR failure) NOT success), phrases (e.g., "databaseerror"), wildcards (e.g., fail* will match fail, fails, failure, etc.), field values (e.g.,code 404), inequality (e.g., code! 404 or code 200), a field having any valueor no value (e.g., code * or NOT code *). For example, the search:Returns results in a tabular output for (time-series) charting.Removes subsequent results that match a specified criterion.eval Calculates an expression. (See EVAL FUNCTIONS table.)fields Removes fields from search results.head/taillookupsourcetype "access combined" error top 10 uriReturns the first/last N results.Adds field values from an external source.rename Renames a specified field; wildcards can be used to specifymultiple fields.will retrieve indexed access combined events from disk that contain the term"error" (ANDs are implied between search terms), and then for those events,report the top 10 most common URI values.replaceSubsearchesrexA subsearch is an argument to a command that runs its own search, returning thoseresults to the parent command as the argument value. Subsearches are containedin square brackets. For example, finding all syslog events from the user that had thelast login error:Replaces values of specified fields with a specified new value.Specifies regular expression named groups to extract fields.search Filters results to those that match the search expression.sortsourcetype syslog [search login error return user]Note that the subsearch returns one user value, because by default the "return"command just returns one value, but there are options for more (e.g., return5 user).Relative Time ModifiersDESCRIPTIONSorts search results by the specified fields.stats Provides statistics, grouped optionally by fields.top/rare Displays the most/least common values of a field.Besides using the custom-time ranges in the user-interface, you can specify inyour search the time ranges of retrieved events with the latest and earliestsearch modifiers. The relative times are specified with a string of characters thatindicate amount of time (integer and unit) and, optionally, a "snap to" time unit:transaction[ -] time integer time unit @ snap time unit Optimizing SearchesFor example: "error earliest -1d@d latest -1h@h" will retrieve eventscontaining "error" that occurred from yesterday (snapped to midnight) to thelast hour (snapped to the hour).The key to fast searching is to limit the data that needs to be pulled off disk to anabsolute minimum, and then to filter that data as early as possible in the search sothat processing is done on the minimum data necessary.Time Units: specified as second (s), minute(m), hour(h), day(d), week(w),month(mon), quarter(q), year(y). "time integer" defaults to 1 (e.g., "m" is the same as"1m").Partition data into separate indexes, if you’ll rarely perform searches across multipletypes of data. For example, put web data in one index, and firewall data in another.Snapping: indicates the nearest or latest time to which your time amount roundsdown. Snaps rounds down to the latest time not after the specified time. Forexample, if it is 11:59:00 and you "snap to" hours (@h), you will snap to 11:00 not12:00. You can "snap to" a specific day of the week: use @w0 for Sunday, @w1 forMonday, etc.Communityask questions, find answers.download apps, share yours.splunkbase.com Groups search results into transactions.Search as specifically as you can (e.g. fatal error, not *error*)Limit the time range to only what’s needed (e.g., -1h not -1w)Filter out unneeded fields as soon as possible in the search.Filter out results as soon as possible before calculations.For report generating searches, use the Advanced Charting view, andnot the Flashtimeline view, which calculates timelines.On Flashtimeline, turn off ‘Discover Fields’ when not needed.Use summary indexes to pre-calculate commonly used values.Make sure your disk I/O is the fastest you have available.
SEARCH EXAMPLESFilter ResultsAdd FieldsFilter results to only include those with"fail" in their raw text and status 0. search fail status 0Remove duplicates of results with thesame host value. dedup hostKeep only search results whose " raw"field contains IP addresses in the nonroutable class A (10.0.0.0/8). regex raw "(? !\d)10.\d{1,3}\.\d{1,3}\.\d{1,3}(?!\d)"Group ResultsSet velocity to distance / time. eval velocity distance/timeExtract "from" and "to" fields usingregular expressions. If a raw eventcontains "From: Susan To: David", thenfrom Susan and to David. rex field raw "From:(? from .*) To: (? to .*)"Save the running total of "count" in afield called "total count". accum count as totalcount delta count as countdiffCluster results together, sort by their"cluster count" values, and then returnthe 20 largest clusters (in data size). cluster t 0.9showcount true sortlimit 20 -cluster countFor each event where 'count' exists,compute the difference between countand its previous value and store theresult in 'countdiff'.Group results that have the same "host"and "cookie", occur within 30 secondsof each other, and do not have a pausegreater than 5 seconds between eachevent into a transaction. transaction host cookiemaxspan 30s maxpause 5sKeep the "host" and "ip" fields, anddisplay them in the order: "host", "ip". fields host, ipGroup results with the same IP address(clientip) and where the first resultcontains "signon", and the last resultcontains "purchase".Remove the "host" and "ip" fields. transaction clientipstartswith "signon"endswith "purchase" fields - host, ipFilter FieldsOrder ResultsModify FieldsRename the " ip" field as "IPAddress". rename ip as IPAddressChange any host value that ends with"localhost" to "mylocalhost". replace *localhost withmylocalhost in hostReturn the first 20 results. head 20Reverse the order of a result set. reverseMulti-Valued FieldsSort results by "ip" value (in ascendingorder) and then by "url" value(in descending order). sort ip, -urlCombine the multiple values of therecipients field into a single value nomv recipientsReturn the last 20 results(in reverse order). tail 20Separate the values of the "recipients"field into multiple field values,displaying the top recipients makemv delim ","recipients top recipientsCreate new results for each value of themultivalue field "recipients" mvexpand recipientsFor each result that is identical exceptfor that RecordNumber, combine them,setting RecordNumber to be a multivalued field with all the varying values. fields EventCode,Category, RecordNumber mvcombine delim ","RecordNumberFind the number of recipient values eval to count mvcount(recipients)Find the first email address in therecipient field eval recipient first mvindex(recipient,0)Find all recipient values that end in .netor .org eval netorg recipients mvfilter(match(recipient,"\.net ") OR match(recipient,"\.org "))Find the combination of the values offoo, "bar", and the values of baz eval newval mvappend(foo, "bar", baz) eval orgindex mvfind(recipient, "\.org ")ReportingReturn events with uncommon values. anomalousvalueaction filter pthresh 0.02Return the maximum "delay" by "size",where "size" is broken down into amaximum of 10 equal sized buckets. chart max(delay) by sizebins 10Return max(delay) for each value of foosplit by the value of bar. chart max(delay) overfoo by barReturn max(delay) for each value of foo. chart max(delay) overfooRemove all outlying numerical values. outlierRemove duplicates of results with thesame "host" value and
Search commands are used to take indexed data and fi lter unwanted information, extract more information, calculate values, transform, and statistically analyze. The search results retrieved from the index can be thought of as a dynamically created table. Each search command redefi nes the shape of that table. Each indexed eventFile Size: 718KBPage Count: 6


