Transcription
Storage Evaluation GuideBasic VMware vSphere PerformanceProcess GuideAuthor: Leah SchoebNovember, 2012Enabling you to make the best technology decisions 2011 Evaluator Group, Inc. All rights reserved.
Basic VMware vSphere Performance Guide p. 1Leah Schoeb of 13Table of ContentsProcess Guide Overview . 2Performance Troubleshooting Methodology . 3Using Tools to Identify Bottlenecks . 4VMware Tools . 4Common Problems in a vSphere Environment . 4Key Metrics to Measure and Monitor . 4Basic Troubleshooting Process for a VMware ESXi Host . 4Processor (CPU & vCPU). 5Common Problems in a vSphere Environment . 5Key Metrics to Measure and Monitor . 5Basic Troubleshooting Process for a VMware ESXi Host . 6Resource Pool Saturation . 6Host Saturation . 6Virtual Machine (guest OS) Saturation . 6Only one vCPU is used in an SMP VM . 7High Ready Times for burst workloads . 7Memory Management . 7Common Problems in a vSphere Environment . 8Key Metrics to Measure and Monitor . 8Basic Troubleshooting Process for a VMware ESXi Host . 9High Memory Demand – Resource Pool . 9 2012 Evaluator Group, Inc. All rights reserved. Reproduction of this publication in any formwithout prior written permission is prohibited.
Basic VMware vSphere Performance Guide p. 2Leah Schoeb of 13High Memory Demand – ESXi Host . 9High memory Demand – Virtual Machine . 9VM Memory Swapping to disk . 9VM Swap Wait . 10Past VM Memory Swapping . 10Virtual Machine Memory Compression . 10Storage (I/O path). 11Common Problems in a vSphere Environment . 11Key Metrics to Measure and Monitor . 11Basic Troubleshooting Process for a VMware ESXi Host . 11To monitor the recommended metrics from vCenter . 12Slow Storage Device . 12Resolution . 12Network . 12Common Problems in a vSphere Environment . 12Key metrics to Measure and Monitor . 12Basic Troubleshooting Process for a VMware ESXi Host . 13Summary . 13Enabling you to make the best technology decisions 2012 Evaluator Group, Inc. All rights reserved. Reproduction of this publication in any formwithout prior written permission is prohibited.
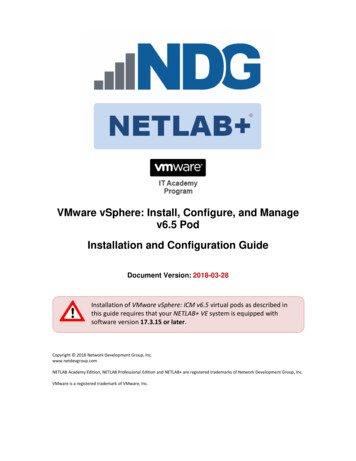
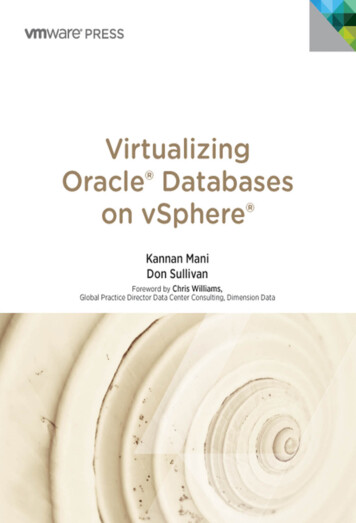
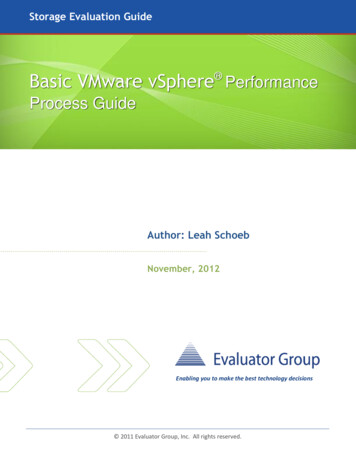
Basic VMware vSphere Performance Guide p. 3Leah Schoeb of 13Process Guide OverviewEvaluator Group’s VMware vSphere Performance Process Guide is part of a series of guides designed tohelp IT professionals evaluate performance. This Process Guide is designed to assist VirtualInfrastructure (VI) administrators understand the basics in resource optimization and troubleshootingVmware vSphere environments.What sets Evaluator Group’s Evaluation Guide series apart from other analyst firms and vendorsponsored whitepapers is the lack of vendor bias. Our Evaluation Guides are not sponsored by vendorsand are written for IT managers seeking a vendor neutral discussion of the design considerations behindnew products, technologies, and trends.Performance Troubleshooting MethodologyIdentifying and resolving bottlenecks in vSphere can be difficult without some direction. This documentwill take you through a process flow for identifying and resolving bottlenecks and tuning a vSphereenvironment at the ESXi level.Understanding supply and demand is very important. Knowing in the planning stages the amount ofperformance and throughput of your workload will make it easier to monitor the recommendedperformance thresholds. With this document you will be able to resolve basic performance bottleneckson existing virtual environments. This will help you stay within your SLAs.Figure 1: Methodology and Process Flow 2012 Evaluator Group, Inc. All rights reserved. Reproduction of this publication in any formwithout prior written permission is prohibited.
Basic VMware vSphere Performance Guide p. 4Leah Schoeb of 13The basic process flow for finding bottlenecks, reporting metrics, and tuning a vSphere environment isthe following:1.2.3.4.VMware Tools - Check the status of VMware ToolsProcessors – Check both CPUs and vCPUsMemory – Check the memory management architectureStorage – There is a limited view of the storage subsystem but the rest of the I/O stack in thehypervisor, VMFS, and guest OS should be available to check through vCenter.5. Network – There are rarely network problems but it good to monitor dropped packets andensure there are no aborts.Using Tools to Identify BottlenecksAll guidance in this document is using the performance tab in vCenter since that comes with mostlicenses. If a customer has decided to install vCenter Operations, it will give you much more graphicaldetail of the metrics talked about in this document. Other tools for advance tuning not covered in thisdocument are ESXtop. iSCSIstats or third party enterprise management, and data analytics.VMware ToolsCommon Problems in a vSphere EnvironmentBefore looking any place else for a performance problem first start check the status of VMware tools.Key Metrics to Measure and MonitorThere are two states to be aware of when checking the status of VMware Tools:Out of Date – Periodically there are updates to VMware Tools that correspond with various OS updates.VMware Tools must always be kept update for all VMs.Disabled – VMware tools on a guest OS are installed as a set of services for Windows or a set of devicedrivers on Linux or Solaris. Sometimes these services/drivers are disabled when performance reachescertain OS-level tasks. For Linux, if there are changes made to the kernel or the kernel has beenupdated this can cause a situation where VMware Tools can not load properly when restarting a LinuxVM.Basic Troubleshooting Process for a VMware ESXi Host1.2.3.4.In the vCenter select the host name.Select the Virtual Machines tab.Right-click on the header and select VMware Tools StatusIf the status is Out of date or Disabled for any of the VMs do the following: 2012 Evaluator Group, Inc. All rights reserved. Reproduction of this publication in any formwithout prior written permission is prohibited.
Basic VMware vSphere Performance Guide p. 5Leah Schoeb of 13a. Out of Date – download the latest VMware Tools from www.vmware.com and update allVMs.b. Disabled – First attempt to re-enable VMware Tools. For Linux, run the config-tools.plscript which will configure the tools or you may have to re-install VMware Tools.Processor (CPU & vCPU)Common Problems in a vSphere Environment1. The VMs CPU resource demands are higher than what a host, Resource Pool, or Virtual Machinecan provide.2. Only one vCPU is being used in an SMP VM. This happens when:a. A guest OS has been configured for uni-processor.b. An application in the guest OS is pinned to a single core.c. The application running in the guest OS is a single-threaded application.3. High Ready Times with bursty workloads has often been found when running Terminal Servicesor VDI applications.4. Too large a VM on too small a platforma. Rules of thumb: 1-4 vCPU on dual socket hosts, 4-8 vCPU on quad socket hosts. Changesas core counts increase.b. With 8 vCPU, ensure that at least vSphere 4.1 is installed5. Accidental limitsa. Reservations/limits on VMs and resources too small6. Continuing to expect high consolidation ratios (VM-to-host ration) with busy workloadsa. Virtualizing larger workloads require revisiting consolidation ratios.Key Metrics to Measure and Monitor CPU utilization (%CPU and %vCPU)Ready (%RDY)- % time a vCPU was ready to be scheduled on a physical processor but couldn’t due toprocessor contention- Recommended Threshold: 10% per vCPUCo-Stop (%CSTP)- % time a vCPU in an SMP virtual machine is “stopped” from executing, so that anothervCPU in the same virtual machine could be run to “catch-up” and make sure the skewbetween the two virtual processors doesn’t grow too large- Recommended Threshold: 3%Max Limited (%MLMTD)- % time the VM was ready to run but wasn’t scheduled because it would violate the CPULimit set.- Recommended Threshold: 0% 2012 Evaluator Group, Inc. All rights reserved. Reproduction of this publication in any formwithout prior written permission is prohibited.
Basic VMware vSphere Performance Guide p. 6Leah Schoeb of 13Basic Troubleshooting Process for a VMware ESXi HostResource Pool Saturation1. Resource Pool CPU utilizationa. Select Resource Pool Performance tab Advanced CPU Usage in MHz objectb. Right click on the Resource Pool and then click Edit Settings. Check to see if there is aCPU Limit set in the Resource Poolc. Is the Usage close ( 75%) to the CPU Limit? If it is, the next step is to check for possiblehigh CPU Ready Time.2. Ready Timea. Select the VM(s) that is exhibiting the slow performance Performance tab Advanced CPUb. Look at the Ready time for all objects (vCPU numbers for the VM). You may to ChangeChart Options to see the Ready metric.c. Is any object 2000ms.3. Resolutiona. In a DRS cluster possibly add a host to add additional CPU resources. DRS willautomatically rebalance the load.Host Saturation1. Host CPU utilizationa. Select the hostname Performance tab Advanced CPUb. Under the hostname object look at Usage to see if Usage is 75% or frequent spikes 90%2. Ready Timea. hostname Virtual Machines tab Host CPU click on the MHz header and theCPU usage will list from highest to lowest usage of the VMs.b. Then elect the VM(s) that is exhibiting the slow performance Performance tab Advanced CPUc. Look at the Ready time for all objects (vCPU numbers for the VM). You may have toChange Chart Options to see the Ready metric.d. Is any object 2000ms.3. Resolutiona. Reduce the number of VMs running on the host or power off non-critical VMs.b. Tune the efficiency of the VMs themselves. Use the usual best practices from OS vendorsplus look at using Large Memory Pages, increase memory, and/or reduce the timerinterrupt rate.Virtual Machine (guest OS) Saturation1. VM utilizationa. VMname Performance tab Advanced CPU 2012 Evaluator Group, Inc. All rights reserved. Reproduction of this publication in any formwithout prior written permission is prohibited.
Basic VMware vSphere Performance Guide p. 7Leah Schoeb of 13b. Look at the VMname CPU Usage. Under the hostname object look at Usage to see ifUsage is 75% or frequent spikes 90%2. Resolutiona. Add additional vCPUs to the VM.b. Migrate that VM to a host that has more resourcesOnly one vCPU is used in an SMP VM1. vCPU utilizationa. VMname Performance tab Advanced CPUb. In the MHz column look at vCPU objects2. Resolutiona. A guest OS has been configured for uni-processor. Upgrade the guest OS to an SMPkernel or HAL.b. An application in the guest OS is pinned to a single core. Adjust the OS level controls.c. The application running in the guest OS is a single-threaded application. The number ofvCPUs allocated to the VM should be reduced to one.High Ready Times for burst workloads1. CPU utilizationa. hostname Performance tab Advanced CPUb. If the hostname Usage above 60% check ready time2. Ready Timea. VMname Performance tab Advanced CPUb. Look at the Ready time for all objects (vCPU numbers for the VM). You may to ChangeChart Options to see the Ready metric.3. Resolutiona. The HatingIdleMsecPenalty parameter enforces fairness among the CPU time allocatedto the VM. If you need to change the fairness, you can check the VMware KB articlehttp://kb.vmware.com/kb/1020233 on how to change it.Memory ManagementRemember the ESXi memory management architecture and priority of use1. Ballooning – Can over-commit memory for a virtual machine by a pre-set parameter.2. Compression – compresses memory in a compression cache3. Hot cache – New in vSphere 5. This automatically detects Solid State Storage (SSS) on board inthe host and makes it available for swapping instead of swapping to disk.4. Swapping – Swaps to disk 2012 Evaluator Group, Inc. All rights reserved. Reproduction of this publication in any formwithout prior written permission is prohibited.
Basic VMware vSphere Performance Guide p. 8Leah Schoeb of 13Common Problems in a vSphere Environment Using SWmmu- If you have the option, hardware memory assist (HWmmu) reduces virtualizationoverhead for memory intensive workloads (eg: Tier 1)- If using ESX 3.5, AMD with RVI, 32 bit OS – check/force monitor modeNot monitoring for memory ballooning or swapping to disk- Ballooning is an early warning sign paging may occur- Paging to disk will negatively impact VM performance- Swap Wait - when host swapping issue is fixed ESXi does not automatically Swap Inmemory for VMs until a VM starts to utilize that memory againNot monitoring for swapping at guest- Under provisioning guest memory- Excessive memory over-commit- Memory over-commit with memory reservations- Disabling the balloon driver or disabling TPSTPS and Large Memory Pages- vCenter summary data shows high memory utilization since guest memory is backed by2Mb physical memory pages 1st, then TPS when required- Bad capacity planning metricKey Metrics to Measure and Monitor Balloon driver size (MCTLSZ)- the total amount of guest physical memory reclaimed by the balloon driver- Recommended Threshold: 1Swapping (SWCUR)- The current amount of guest physical memory that is swapped out to the ESX kernelVM swap file- Recommended Threshold: 1Swap Reads/sec (SWR/s)- The rate at which machine memory is swapped in from disk- Recommended Threshold: 1Swap Writes/sec (SWW/s)- The rate at which machine memory is swapped out to disk- Recommended Threshold: 1Swap In RateSwap Out RateTotal Active Memory (Memory Capacity – Memory Overhead) Total balloonable memory Savings from Memory Compression Page Sharing Savings 2012 Evaluator Group, Inc. All rights reserved. Reproduction of this publication in any formwithout prior written permission is prohibited.
Basic VMware vSphere Performance Guide p. 9Leah Schoeb of 13Basic Troubleshooting Process for a VMware ESXi HostHigh Memory Demand – Resource Pool1. Resource Pool - Performance Tab Advanced Memory2. Look at the Balloon Parameter for the Resource Pool object. If the Balloon parameter is 0 this isa sign that you are using more physical memory than the host has.3. If a VM is frequently ballooning you may need to add physical memory.4. Resolution – Memory shares can be set to ensure adequate memory available. In extreme casesmemory reservations can be set for a guarantee for mission critical applications with strict SLAs.High Memory Demand – ESXi Host1. hostname - Performance Tab - Advanced - Memory2. Look at the Balloon Parameter for the Resource Pool object. If the Balloon parameter is 0 this isa sign that you are using more physical memory than the host has.3. If a VM is frequently ballooning you may need to add physical memory.4. Resolution – Memory shares can be set to ensure adequate memory available. In extreme casesmemory reservations can be set for a guarantee for mission critical applications with strict SLAs.High memory Demand – Virtual Machine1. VMname Performance Tab Advanced Memory2. Look at the Balloon Parameter for the Resource Pool object. If the Balloon parameter is 0 this isa sign that you are using more physical memory than the host has.3. If a VM is frequently ballooning you may need to add physical memory.4. Resolution (you can do one or both)a. Configure additional memory for the VMb. Tune the application to reduce its demand on memory.VM Memory Swapping to disk1. Check for swapping at the ESXi hosta. hostname Performance tab Advanced Memoryb. Look at Swap In Rate and Swap Out Rate. You may have to Change Chart Options to viewthese parameters.c. If either of these parameters are 0 then the ESXi host is swapping.2. Check for swapping at the Virtual Machinea. VMname - Performance tab - Advanced - Memoryb. Use Change Chart Options to select Memory/Real-Time then change the Chart Type toStacked (per VM) and select all VMsc. Then check all VM’s one by one for their Swap In Rate and Swap Out Rate.d. If either of these parameters are 0 then that VM is swapping.3. Resolution (you call to do one, many or all) 2012 Evaluator Group, Inc. All rights reserved. Reproduction of this publication in any formwithout prior written permission is prohibited.
Basic VMware vSphere Performance Guide p. 10Leah Schoeb of 13a. Add physical memory to the ESXi hostb. Increase the limits of the resource poolc. Reduce the number of VMs running on the ESXi hostd. Increase available memory resources by adding the host to a DRS clustere. Maximize page sharingf. Enable the balloon driver on all VMsg. Reduce memory rese
Evaluator Group’s VMware vSphere Performance Process Guide is part of a series of guides designed to help IT professionals evaluate performance. This Process Guide is designed to assist Virtual Infrastructure (VI) administrators understand the basics in resource optimization and trou