Transcription
Sigurðsson and Briem Journal of Experimental 5-5(2019) 6:37RESEARCHJournal ofExperimental OrthopaedicsOpen AccessCluster analysis successfully identifiesclinically meaningful knee valgus momentpatterns: frequency of early peaks reflectssex-specific ACL injury incidenceHaraldur B. Sigurðsson*and Kristín BriemAbstractBackground: Biomechanical studies of ACL injury risk factors frequently analyze only a fraction of the relevant data,and typically not in accordance with the injury mechanism. Extracting a peak value within a time series of relevanceto ACL injuries is challenging due to differences in the relative timing and size of the peak value of interest.Aims/hypotheses: The aim was to cluster analyze the knee valgus moment time series curve shape in the earlystance phase. We hypothesized that 1a) There would be few discrete curve shapes, 1b) there would be a shapereflecting an early peak of the knee valgus moment, 2a) youth athletes of both sexes would show similarfrequencies of early peaks, 2b) adolescent girls would have greater early peak frequencies.Methods: N 213 (39% boys) youth soccer and team handball athletes (phase 1) and N 35 (45% boys) with 5 year followup data (phase 2) were recorded performing a change of direction task with 3D motion analysis and a force plate. The timeseries of the first 30% of stance phase were cluster analyzed based on Euclidean distances in two steps; shape-based mainclusters with a transformed time series, and magnitude based sub-clusters with body weight normalized time series. Groupdifferences (sex, phase) in curve shape frequencies, and shape-magnitude frequencies were tested with chi-squared tests.Results: Six discrete shape-clusters and 14 magnitude based sub-clusters were formed. Phase 1 boys had greater frequencyof early peaks than phase 1 girls (38% vs 25% respectively, P 0.001 for full test). Phase 2 girls had greater frequency of earlypeaks than phase 2 boys (42% vs 21% respectively, P 0.001 for full test).Conclusions: Cluster analysis can reveal different patterns of curve shapes in biomechanical data, which likely reflectdifferent movement strategies. The early peak shape is relatable to the ACL injury mechanism as the timing of its peakmoment is consistent with the timing of injury. Greater frequency of early peaks demonstrated by Phase 2 girls isconsistent with their higher risk of ACL injury in sports.Keywords: ACL, Biomechanics, Cluster analysis, Data mining, Injury riskBackgroundAnterior cruciate ligament (ACL) injuries result in considerable societal burden (Kiadaliri et al., 2016), explainingextensive and ongoing research efforts to prevent them.Cadaver studies have demonstrated that the ACL can beloaded through a knee valgus moment (VM) (Markolf etal., 1990), and that the VM is an important contributor to the multi-planar loads that produce clinically* Correspondence: harbs@hi.isResearch Centre for Movement Sciences, University of Iceland, Reykjavík,Icelandmeaningful injury patterns (Bates et al., 2018). Alandmark study by Hewett et al. (Hewett et al.,2005) revealed that the knee valgus moment was arisk factor for ACL injury, but had importantlimitations. The total number of injured players was low(N 9), leading to a high chance of false discoveries(Christley, 2010; Colquhoun, 2014). Furthermore, the studyused a bilateral drop-jump, a movement which typicallydoes not result in athletic ACL injuries (Montgomery et al.,2018; Walden et al., 2015). The Author(s). 2019 Open Access This article is distributed under the terms of the Creative Commons Attribution 4.0International License (http://creativecommons.org/licenses/by/4.0/), which permits unrestricted use, distribution, andreproduction in any medium, provided you give appropriate credit to the original author(s) and the source, provide a link tothe Creative Commons license, and indicate if changes were made.
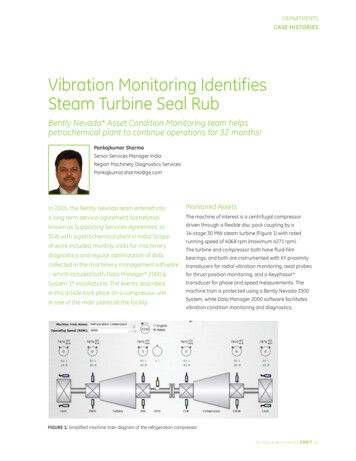
(2019) 6:37Sigurðsson and Briem Journal of Experimental OrthopaedicsTable 1 Descriptive StatisticsBoysPhase 1Phase 6.00.770.500No. of Trials1512Age15.80.812502Height180.79.11167.43.99 0.001Weight74.916.5464.010.270.054No. of Trials364419No. of Trials are the number of trials collected that entered the clusteranalysis processRecent studies using similar methodology (Krosshaug etal., 2016; Leppanen et al., 2017) have not replicated the results of the Hewett study (Hewett et al., 2005) and the observation has been made that biomechanical risk factorstudies seldom account for the ACL injury mechanisms intheir analyses (Dai et al., 2014) which may explain theirinconsistent results. While ACL injuries occur shortly aftercontact with the ground (Koga et al., 2010; Krosshaug etal., 2007), prospective studies have extracted peak valuesover the complete weight acceptance phase (Hewett et al.,2005; Krosshaug et al., 2016; Leppanen et al., 2017). Thetiming of global peaks occur during mid- to late weightacceptance phase, which is inconsistent with that of ACLinjury (Sigurethsson et al., 2018). A key difficulty in extracting the peak value of the knee VM during the critical earlycontact phase is the variability in the waveform of thecalculated VM signal, which doesn’t always have a discretepeak in the early phase (Sigurethsson et al., 2018).Fig. 1 Overview of the cluster analysis processPage 2 of 12Augmenting traditional biomechanical approacheswith machine learning tools, such as cluster analysis(Halilaj et al., 2018) has been suggested as a means foropening new avenues of research. Identifying a waveform consistent with the mechanism of ACL injury is aclassification problem that may be solved with clusteranalysis. To date, no method has been published thatclusters joint moment waveforms into different shapes.The primary aim of this study was to test the feasibilityof using cluster analysis to identify different shapes ofVM waveforms in the early weight acceptance phase of achange of direction task, a movement during which ACLinjuries occur (Walden et al., 2015). Our hypotheseswere; 1a) the waveforms may be classified into a smallnumber of categories, 1b) at least one of the resultingclusters will have an early peak consistent with thetiming of ACL injury (Krosshaug et al., 2007).A secondary aim was to compare the frequency of theearly peak waveform between the sexes before and afterpuberty. Our hypotheses were that; 2a) before adolescence, athletes will show an identical frequency of earlypeaks, 2b) after adolescence girls will have greaterfrequency of early peaks, consistent with the 2-3x greaterrisk of sports related ACL injuries reported in the literature (Montalvo et al., 2018; Nicholls et al., 2018).MethodsDesign and settingProspective cohort laboratory study.SubjectsAthletes were 9–12 years old at baseline (phase 1) and recruited from local soccer and team handball clubs. This
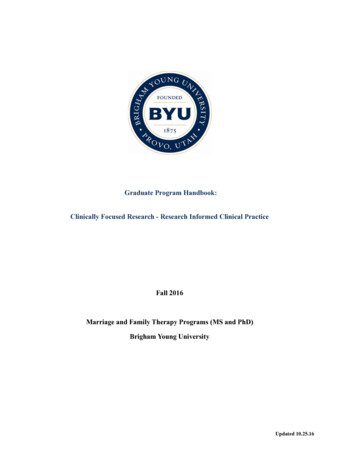
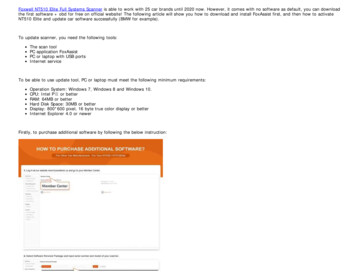
Sigurðsson and Briem Journal of Experimental Orthopaedics(2019) 6:37age range has been shown to have identical ACL injuryrates (Nicholls et al., 2018) in the country where thestudy is performed. At the follow up data collection(phase 2), these same athletes (some of whom havechanged, or departed from, sports) were aged 14–17years old for a mean time from baseline to follow upof 5 years. Athletes’ characteristics for phase 1 (N 213, 39% boys) and phase 2 (N 35, 45% boys) aresummarized in Table 1.Data collectionData collection methods have been previously describedby Briem et al. (Briem et al., 2017). In short, height andweight were measured before a short warm-up on aPage 3 of 12stationary bike. Strength testing of hip muscles in abduction and external rotation was performed.After strength testing, 46 reflective markers were placedon the subject, 4 on each foot, one per malleolus, a 4marker cluster on each shank, one per femoral condyle, a4 marker cluster on each thigh, a 3 marker cluster on thesacrum, one on each greater trochanter of the femur andon the highest point of each iliac crest, on bilateralanterior superior iliac spines, on the thorax (approximately t10-t12), on the c7, on the sternum, and on thelateral aspects of each scapular acromion.A static trial was recorded, and anatomical markerswere removed (trochanteric, malleolar, condylar, andiliac crests) before the dynamic movement trials.Subjects performed 5 repetitions of a change of directionFig. 2 Heat map of the Euclidean distances of the time series after reduction to the signs of the differenced curve. Two large solid red boxes arepresent, indicating a number of identical time series (distance 0)
Sigurðsson and Briem Journal of Experimental Orthopaedics(2019) 6:37task on each leg, and 5 repetitions of a bilateral dropjump from a 23 cm (youth) or 30 cm (adolescents) box.Movement tasks were repeated after a 5 min skateboardexercise protocol and all conditions were pooled for thisanalysis. The order of movement trials was randomizedwith an online randomizer in phase 2 (Random.org,2016), and a coinflip in phase 1.Data processing and statistical analysisAn 8 segment, 48 degree of freedom, musculoskeletalmodel was constructed in Visual3D (C-Motion) consistingof feet, shanks, and thighs of both lower extremities, inaddition to a pelvis and a trunk. Ankle joint centers weredefined as midway between malleolar markers, knee jointcenters as midway between femoral condyle markers, hipjoint centers as 25% of the distance between trochantericmarkers, and the pelvis-trunk joint as midway betweenthe iliac crest markers. Visual3D default settings wereused for all segment inertial parameters.Calculations of kinematics were performed using the 6degree-of-freedom method and inverse kinetics werecalculated for joint moments. Joint moments werenormalized by subject body weight, since the tensilestrength of the ACL ligament also scales with bodyweight (Chandrashekar et al., 2006). Time series data ofthe stance phase of a change of direction task wasexported from Visual3D (C-Motion) and imported intoFig. 3 C-Index plot of initial cluster analysis stepPage 4 of 12R (Team, 2018) for analysis. Video analysis of ACL injuries have revealed that ACL injuries occur in the initial50 ms after contact with the ground (Krosshaug et al.,2007). However, these descriptions of ACL injuries mostoften involve high level athletes (Koga et al., 2018) dueto the availability of match video recordings. With thatin mind, we observed that the fastest athletes in ourcohort who displayed an early peak knee VM did soclose to the 50 ms mark, which was generally within thefirst 25% of the stance phase. In order to ensure thatslopes on either side of the peak waveform would becaptured, data from the first 30% of stance were selectedfor the cluster analysis.Cluster analysisCluster analysis is a mathematical method which seeksto form groups of discrete data points such that they aremore similar to other members within the cluster thanthey are to those outside the cluster. How well a data sethas been clustered can be calculated as the C-Index(Hubert & Levin, 1976), which is the ratio of distanceswithin clusters divided by distances outside a cluster. Arequirement for cluster analysis is that the similarity ordissimilarity is calculated between each pair of observations. For the cluster analysis technique presentedhere (Fig. 1), each recorded trial entered the processseparately (at most 20 trials for each athlete and phase)
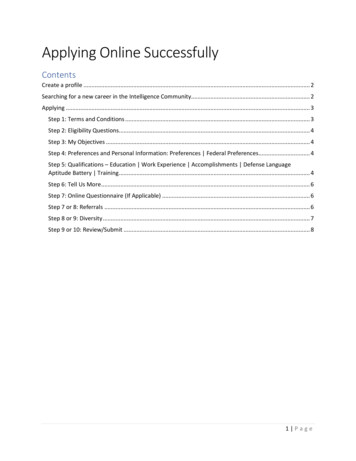
Sigurðsson and Briem Journal of Experimental Orthopaedics(2019) 6:37and the dissimilarity metric was calculated as theEuclidean distance (Montero & Vilar, 2014) between thewaveforms. The method requires that each time seriescontains equally many data-points, and thus each timeseries was first interpolated to lengths equal to thelongest series 2 frames.A transformation was then performed by calculatingthe lagged differences of the series and taking its sign.Thus, if a VM data point was higher than that found inthe prior frame it was given the value 1, whereas if thedata point was lower than that in the prior frame, avalue of 1 was given. Each time series was thereforereduced to its directional changes (increasing ordecreasing), representing its waveform. The Euclideandistances between the transformed waveforms werePage 5 of 12calculated (Montero & Vilar, 2014) and clustersformed using the Ward.D2 (Charrad et al., 2014;Murtagh & Legendre, 2014) method which producescompact spherical clusters.To decide on a number of clusters to produce, the CIndex (Hubert & Levin, 1976) was calculated for totalcluster numbers from 2 to 50 clusters. As there was nodistinct elbow in the C-Index plot, a number of clusterswas selected based on a C-Index cut-off value of 0.05.The resulting clusters were visually examined andassigned to groups based on similarities in their appearance. Individual curves within a cluster were examinedwhen the aggregated cluster appearance was unclear.In order to differentiate between different magnitudesof similar shapes of knee VM data, a second clusterFig. 4 Smoothed aggregate time series’ of the six basic shapes of the scaled knee valgus moment curves generated in the initial shape-basedcluster analysis. Each time series is individually scaled. The gray shaded area denotes the 95% confidence interval of the smoothing process
Sigurðsson and Briem Journal of Experimental Orthopaedics(2019) 6:37analysis step was performed. All curves within eachshape were interpolated and divided by bodyweight inkg. The Euclidean distances between them were calculated and using the Ward.D2 method (Murtagh &Legendre, 2014), 2–4 sub-clusters based on force magnitude were formed. The lowest C-Index value out of theresult was selected. Each of the resulting sub-clusterswere then examined and classified as either a small,medium, or a large magnitude.Statistical analysisNo specific cut-offs have been commonly accepted todetermine the quality of clusters formed with clusteranalysis. Instead, the cluster analysis process was visuallyinspected to confirm that the intended goal of discreteshapes in the VM waveform was reached. For thesecondary aims of determining sex- and age-dependentPage 6 of 12differences in the frequency of the early peak VM shape,a chi-square test was performed on the frequency distribution of the clusters by sex and maturity where eachindividual trial was the unit of study. Significance levelwas set at 0.05.ResultsAfter screening for errors in performing the side-stepmaneuver as well as removing trials with large artifacts,4903 attempts out of the 5080 collected were availablefor analysis.Clustering processAfter reducing each time series to the signs of a laggeddifference, a total of 1025 unique shapes were presentwith a median of 1 trials per shape but with two largegroups of identical shapes (Fig. 2). A total of 39 clustersFig. 5 Smoothed aggregates of the time series of the first 30% of the stance phase of all clusters generated with the two step cluster analysis.The gray shaded area denotes the 95% confidence interval from the smoothing process
Sigurðsson and Briem Journal of Experimental Orthopaedics(2019) 6:37Page 7 of 12Fig. 6 Smoothed aggregates of the time series of the whole stance phase of all clusters generated with the two step cluster analysis. The grayarea denotes the 95% confidence interval from the smoothing processwere formed in the initial cluster analysis step. No elbowwas observed in the C-Index plot and the C-Index for39 clusters was 0.049 (Fig. 3). From those 39 clusters, 6distinct shapes were identified (Fig. 4); early peaks,peaks, upslopes, downslopes, early troughs, and troughs.From the six basic shapes, a total of 14 magnitude basedsub-clusters were formed (Figs. 5 & 6).Chi-squared testThe chi-squared test for the six basic shapes revealedthat in phase 1, boys had a greater than expected frequency of early peaks, while girls had a lower than expected frequency (chi-square contributions of 26.4 and20.8, respectively). In phase 2, boys had a lower than expected frequency while girls had a greater than expectedfrequency of early peak shapes (chi-square contributionsof 10.2 and 18.9, respectively). The total Chi-Squarevalue of the test was 400.1 with P 0.001. The frequencies, expected frequencies and chi-square contributionsfor shapes are reported in Table 2.The relative frequency of the early peak shape overall was 32% in phase 1 and 32% in phase 2. The relative frequencies of the sexes were such that in phase1 boys showed an early peak in 38% of trials whilegirls showed an early peak in 25% of trials. In phase2 boys showed an early peak frequency of 21% (decreased from phase 1) while girls showed an earlypeak frequency of 42% (increased from phase 1). Therelative frequency of each shape by sex and phase areshown in Fig. 7.
(2019) 6:37Sigurðsson and Briem Journal of Experimental OrthopaedicsTable 2 The observed and expected frequencies of the sixshape-based clusters representing the knee valgus momentPhase 1 DownslopesEarly PeaksObserved (Expected)Chi-square contributionBoysBoysGirls0.01575 (464) 642 (768) 26.4020.76Early Troughs 42 (41)PeaksGirls276 (420) 698 (695) 49.460.042.40154 (149) 272 (247) 0.1480 (67)2.48Troughs160 (164) 278 (272) 0.110.14Upslopes305 (273) 532 (452) 3.6814.08Phase 2 Downslopes207 (101) 152 (116) 110.7710.8778 (112)178 (129) 10.2018.92Early Troughs 4 (10)3 (11)3.426.07Peaks38 (41)18.750.28Early Peaks10 (36)Troughs55 (40)28 (46)6.056.74Upslopes10 (66)20 (76)47.3141.01Chi-square contribution is the individual cell contribution to Chi-square valuefrom the chi square test. P-value for the Chi-Square test 0.001During further analysis of shape and magnitude basedclusters, expected frequencies for early troughs andsome groups of troughs were below 5 indicating that theassumptions of the Chi-square test are violated. AMonte-Carlo simulation procedure was used as a significance test (Adery, 1968) instead. Analyses focusing onthe knee VM demonstrated that phase 2 boys had fewerthan expected large early peaks, while phase 2 girls hadthe expected frequency (chi-square contributions of 17.1and 1.4, respectively). For small early peaks, phase 2boys had the expected frequency while phase 2 girls hadgreater than expected (chi-square contributions of 0.1and 51, respectively). The total Chi-Square value of thetest was 745 with P 0.001. The observed and expectedfrequencies with chi-square contributions for shapes andmagnitudes are reported in Table 3.DiscussionThe main results of this study are in line with hypothesis1a, i.e. that the two-step clustering process reported candifferentiate between six different curve shapes of theknee VM during the early stance phase, and 2–3 different magnitudes within each shape. Moreover, one ofthe shapes identified was the early peak, consistent withhypothesis 1b. In phase 1 boys had a greater relativefrequency of early peaks, in contrast to hypothesis 2a.However, consistent with hypothesis 2b, girls in phase 2did have a greater relative frequency of early peaks witha ratio of 2:1, consistent with the reported 2-3x higherincidence of ACL injuries for adult females (Montalvo etal., 2018; Walden et al., 2011).The Van Mechelen model of injury prevention is anestablished framework to guide preventative researchPage 8 of 12(van Mechelen et al., 1992). The model emphasizes theneed to first establish the aetiology and mechanisms ofinjury before implementing interventions. Extensive research has been conducted on the mechanism of injury,including cadaver models of ACL injuries (Bates et al.,2018), but very little work has been done to discoverhow components of injury mechanisms are manifestedin non-injury movements. This dearth of cross-sectionalresearch has resulted in prospective studies that arelargely exploratory (Hewett, 2019). The relatively lowincidence of ACL injuries (Montalvo et al., 2018) meansthat the ACL-injured cohort in pros
Keywords: ACL, Biomechanics, Cluster analysis, Data mining, Injury risk Background Anterior cruciate ligament (ACL) injuries result in con-siderable societal burden (Kiadaliri et al., 2016), explaining extensive and ongoing research efforts