Transcription
MultivariateAnalysis IAlboukadel KassambaraPractical Guide ToCluster Analysis in RUnsupervised Machine Learningsthda.comEdition 11 A. Kassambara2015
2Copyright 2017 by Alboukadel Kassambara. All rights reserved.Published by STHDA (http://www.sthda.com), Alboukadel KassambaraContact: Alboukadel Kassambara alboukadel.kassambara@gmail.com No part of this publication may be reproduced, stored in a retrieval system, or transmitted in any formor by any means, electronic, mechanical, photocopying, recording, scanning, or otherwise, without the priorwritten permission of the Publisher. Requests to the Publisher for permission shouldbe addressed to STHDA (http://www.sthda.com).Limit of Liability/Disclaimer of Warranty: While the publisher and author have used their best efforts inpreparing this book, they make no representations or warranties with respect to the accuracy orcompleteness of the contents of this book and specifically disclaim any implied warranties ofmerchantability or fitness for a particular purpose. No warranty may be created or extended by salesrepresentatives or written sales materials.Neither the Publisher nor the authors, contributors, or editors,assume any liability for any injury and/or damageto persons or property as a matter of products liability,negligence or otherwise, or from any use or operation of anymethods, products, instructions, or ideas contained in the material herein.For general information contact Alboukadel Kassambara alboukadel.kassambara@gmail.com .
0.1. PREFACE0.13PrefaceLarge amounts of data are collected every day from satellite images, bio-medical,security, marketing, web search, geo-spatial or other automatic equipment. Miningknowledge from these big data far exceeds human’s abilities.Clustering is one of the important data mining methods for discovering knowledgein multidimensional data. The goal of clustering is to identify pattern or groups ofsimilar objects within a data set of interest.In the litterature, it is referred as “pattern recognition” or “unsupervised machinelearning” - “unsupervised” because we are not guided by a priori ideas of whichvariables or samples belong in which clusters. “Learning” because the machinealgorithm “learns” how to cluster.Cluster analysis is popular in many fields, including: In cancer research for classifying patients into subgroups according their geneexpression profile. This can be useful for identifying the molecular profile ofpatients with good or bad prognostic, as well as for understanding the disease. In marketing for market segmentation by identifying subgroups of customers withsimilar profiles and who might be receptive to a particular form of advertising. In City-planning for identifying groups of houses according to their type, valueand location.This book provides a practical guide to unsupervised machine learning or clusteranalysis using R software. Additionally, we developped an R package named factoextrato create, easily, a ggplot2-based elegant plots of cluster analysis results. Factoextraofficial online documentation: http://www.sthda.com/english/rpkgs/factoextra
40.2About the authorAlboukadel Kassambara is a PhD in Bioinformatics and Cancer Biology. He works sincemany years on genomic data analysis and visualization. He created a bioinformaticstool named GenomicScape (www.genomicscape.com) which is an easy-to-use web toolfor gene expression data analysis and visualization.He developed also a website called STHDA (Statistical Tools for High-throughput DataAnalysis, www.sthda.com/english), which contains many tutorials on data analysisand visualization using R software and packages.He is the author of the R packages survminer (for analyzing and drawing survivalcurves), ggcorrplot (for drawing correlation matrix using ggplot2) and factoextra(to easily extract and visualize the results of multivariate analysis such PCA, CA,MCA and clustering). You can learn more about these packages at: ly, he published two books on data visualization:1. Guide to Create Beautiful Graphics in R (at: https://goo.gl/vJ0OYb).2. Complete Guide to 3D Plots in R (at: https://goo.gl/v5gwl0).
Contents0.10.20.30.40.50.6IPreface . . . . . . . . . . . . . . . . .About the author . . . . . . . . . . .Key features of this book . . . . . . .How this book is organized? . . . . .Book website . . . . . . . . . . . . .Executing the R codes from the PDF.Basics349101616171 Introduction to R1.1 Install R and RStudio . . . . . .1.2 Installing and loading R packages1.3 Getting help with functions in R .1.4 Importing your data into R . . .1.5 Demo data sets . . . . . . . . . .1.6 Close your R/RStudio session . .181819202022222 Data Preparation and R Packages2.1 Data preparation . . . . . . . . . . . . . . . . . . . . . . . . . . . . .2.2 Required R Packages . . . . . . . . . . . . . . . . . . . . . . . . . . .2323243 Clustering Distance Measures3.1 Methods for measuring distances . . .3.2 What type of distance measures should3.3 Data standardization . . . . . . . . . .3.4 Distance matrix computation . . . . .3.5 Visualizing distance matrices . . . . . .3.6 Summary . . . . . . . . . . . . . . . .252527282932335. . . . . . .we choose?. . . . . . . . . . . . . . . . . . . . . . . . .
6IICONTENTSPartitioning Clustering344 K-Means Clustering4.1 K-means basic ideas . . . . . . . . . . . . . . . .4.2 K-means algorithm . . . . . . . . . . . . . . . . .4.3 Computing k-means clustering in R . . . . . . . .4.4 K-means clustering advantages and disadvantages4.5 Alternative to k-means clustering . . . . . . . . .4.6 Summary . . . . . . . . . . . . . . . . . . . . . .363637384647475 K-Medoids5.1 PAM concept . . .5.2 PAM algorithm . .5.3 Computing PAM in5.4 Summary . . . . .48494950566 CLARA - Clustering Large Applications6.1 CLARA concept . . . . . . . . . . . . .6.2 CLARA Algorithm . . . . . . . . . . . .6.3 Computing CLARA in R . . . . . . . . .6.4 Summary . . . . . . . . . . . . . . . . .5757585863III. . .R. .Hierarchical Clustering7 Agglomerative Clustering7.1 Algorithm . . . . . . . . . . . . . . . . . . . . . . . . .7.2 Steps to agglomerative hierarchical clustering . . . . .7.3 Verify the cluster tree . . . . . . . . . . . . . . . . . . .7.4 Cut the dendrogram into different groups . . . . . . . .7.5 Cluster R package . . . . . . . . . . . . . . . . . . . . .7.6 Application of hierarchical clustering to gene expression7.7 Summary . . . . . . . . . . . . . . . . . . . . . . . . .64. . . . . . . . . . . . . . . . . . . . .analysis. . . . .67676873747777788 Comparing Dendrograms8.1 Data preparation . . . . . . . . . . . . . . . . . . . . . . . . . . . . .8.2 Comparing dendrograms . . . . . . . . . . . . . . . . . . . . . . . . .7979809 Visualizing Dendrograms9.1 Visualizing dendrograms . . . . . . . . . . . . . . . . . . . . . . . . .9.2 Case of dendrogram with large data sets . . . . . . . . . . . . . . . .848590. . . . . . . . . . .data. . .
CONTENTS9.39.47Manipulating dendrograms using dendextend . . . . . . . . . . . . . .Summary . . . . . . . . . . . . . . . . . . . . . . . . . . . . . . . . .10 Heatmap: Static and Interactive10.1 R Packages/functions for drawing heatmaps10.2 Data preparation . . . . . . . . . . . . . . .10.3 R base heatmap: heatmap() . . . . . . . . .10.4 Enhanced heat maps: heatmap.2() . . . . .10.5 Pretty heat maps: pheatmap() . . . . . . . .10.6 Interactive heat maps: d3heatmap() . . . . .10.7 Enhancing heatmaps using dendextend . . .10.8 Complex heatmap . . . . . . . . . . . . . . .10.9 Application to gene expression matrix . . . .10.10Summary . . . . . . . . . . . . . . . . . . .IV.Cluster Validation9797989810110210310310411411611711 Assessing Clustering Tendency11.1 Required R packages . . . . . . . . . . . .11.2 Data preparation . . . . . . . . . . . . . .11.3 Visual inspection of the data . . . . . . . .11.4 Why assessing clustering tendency? . . . .11.5 Methods for assessing clustering tendency11.6 Summary . . . . . . . . . . . . . . . . . .12 Determining the Optimal Number12.1 Elbow method . . . . . . . . . . .12.2 Average silhouette method . . . .12.3 Gap statistic method . . . . . . .12.4 Computing the number of clusters12.5 Summary . . . . . . . . . . . . .9496.119119120120121123127of Clusters. . . . . . . . . . . . . . . . . . . . . .using R . . . . . . . . . .128129130130131137.138139141142150.13 Cluster Validation Statistics13.1 Internal measures for cluster validation . . .13.2 External measures for clustering validation .13.3 Computing cluster validation statistics in R13.4 Summary . . . . . . . . . . . . . . . . . . .14 Choosing the Best Clustering Algorithms15114.1 Measures for comparing clustering algorithms . . . . . . . . . . . . . 151
8CONTENTS14.2 Compare clustering algorithms in R . . . . . . . . . . . . . . . . . . . 15214.3 Summary . . . . . . . . . . . . . . . . . . . . . . . . . . . . . . . . . 15515 Computing P-value for Hierarchical Clustering15.1 Algorithm . . . . . . . . . . . . . . . . . . . . .15.2 Required packages . . . . . . . . . . . . . . . .15.3 Data preparation . . . . . . . . . . . . . . . . .15.4 Compute p-value for hierarchical clustering . . .V.Advanced Clustering16 Hierarchical K-Means16.1 Algorithm . . . . .16.2 R code . . . . . . .16.3 Summary . . . . .156156157157158161Clustering163. . . . . . . . . . . . . . . . . . . . . . . . . . . . 163. . . . . . . . . . . . . . . . . . . . . . . . . . . . 164. . . . . . . . . . . . . . . . . . . . . . . . . . . . 16617 Fuzzy Clustering16717.1 Required R packages . . . . . . . . . . . . . . . . . . . . . . . . . . . 16717.2 Computing fuzzy clustering . . . . . . . . . . . . . . . . . . . . . . . 16817.3 Summary . . . . . . . . . . . . . . . . . . . . . . . . . . . . . . . . . 17018 Model-Based Clustering18.1 Concept of model-based clustering . . . .18.2 Estimating model parameters . . . . . .18.3 Choosing the best model . . . . . . . . .18.4 Computing model-based clustering in R .18.5 Visualizing model-based clustering . . .19 DBSCAN: Density-Based Clustering19.1 Why DBSCAN? . . . . . . . . . . . . . . . . .19.2 Algorithm . . . . . . . . . . . . . . . . . . . .19.3 Advantages . . . . . . . . . . . . . . . . . . .19.4 Parameter estimation . . . . . . . . . . . . . .19.5 Computing DBSCAN . . . . . . . . . . . . . .19.6 Method for determining the optimal eps value19.7 Cluster predictions with DBSCAN algorithm .20 References and Further 5186
0.3. KEY FEATURES OF THIS BOOK0.39Key features of this bookAlthough there are several good books on unsupervised machine learning/clusteringand related topics, we felt that many of them are either too high-level, theoreticalor too advanced. Our goal was to write a practical guide to cluster analysis, elegantvisualization and interpretation.The main parts of the book include: distance measures,partitioning clustering,hierarchical clustering,cluster validation methods, as well as,advanced clustering methods such as fuzzy clustering, density-based clusteringand model-based clustering.The book presents the basic principles of these tasks and provide many examples inR. This book offers solid guidance in data mining for students and researchers.Key features: Covers clustering algorithm and implementation Key mathematical concepts are presented Short, self-contained chapters with practical examples. This means that, youdon’t need to read the different chapters in sequence.At the end of each chapter, we present R lab sections in which we systematicallywork through applications of the various methods discussed in that chapter.
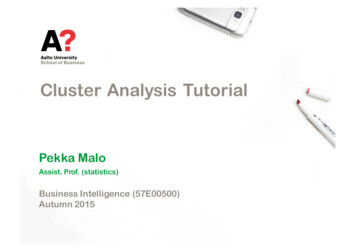
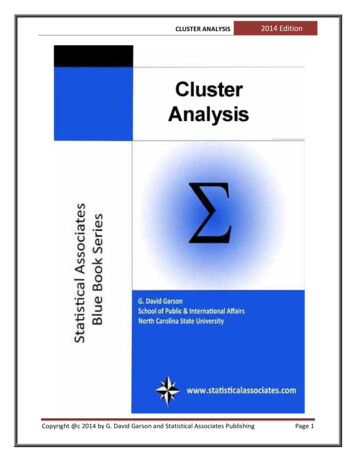
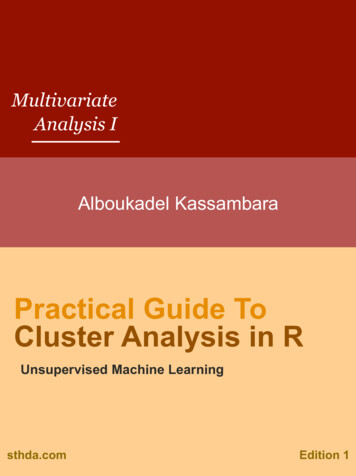
10CONTENTS0.4How this book is organized?This book contains 5 parts. Part I (Chapter 1 - 3) provides a quick introduction toR (chapter 1) and presents required R packages and data format (Chapter 2) forclustering analysis and visualization.The classification of objects, into clusters, requires some methods for measuring thedistance or the (dis)similarity between the objects. Chapter 3 covers the commondistance measures used for assessing similarity between observations.Part II starts with partitioning clustering methods, which include: K-means clustering (Chapter 4), K-Medoids or PAM (partitioning around medoids) algorithm (Chapter 5) and CLARA algorithms (Chapter 6).Partitioning clustering approaches subdivide the data sets into a set of k groups, wherek is the number of groups pre-specified by the analyst.
0.4. HOW THIS BOOK IS ORGANIZED?11Partitioning Clustering PlotMississippi2North CarolinaSouth CarolinaWest VirginiaArkansas South Dakota VermontMontana1AlabamaAlaskaTennessee Kentucky Idaho North DakotaLouisianaMaineMarylandNew MexicoWyomingNew HampshireFlorida0Michigan Missouri Virginia Indiana NebraskaDelawareTexasIowaOklahoma KansasIllinoisArizonaPennsylvania WisconsinOregonOhioMinnesota-1 Neva
In the litterature, it is referred as “pattern recognition” or “unsupervised machine learning” - “unsupervised” because we are not guided by a priori ideas of which variables or samples belong in which clusters. “Learning” because the machine algorithm “learns” how to cluster. Cluster analysis is popular in many fields .