Transcription
Instructions for UseCyAn ADPHigh-speed AnalyzerSummit 4.30000050GJune 2008Beckman Coulter, Inc.4300 N. Harbor Blvd.Fullerton, CA 92835
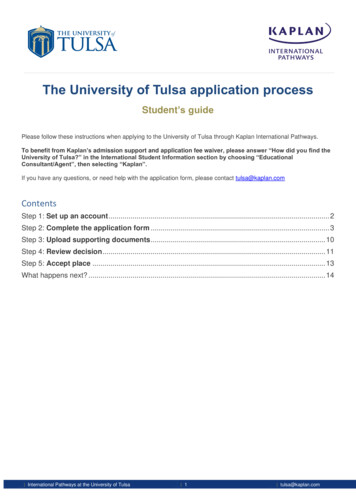
Summit Software OverviewOverviewSummit software is a Windows based application that has a series of menus, hot keys, and buttonswhich allow you to acquire, sort, and analyze flow cytometry data then save the data in FCS format.With Summit software you can monitor and control the instrument, define protocols, configurecompensation settings and workspaces, define batch protocol panels, reagents, and tubes, and autocompensate data.How to Open Summit Software1To open Summit software double-click the Shortcut icon on the Windows desktop. The Selectdatabase dialog box appears.Figure 3.1 Select a New Database2Select CYAN from the dropdown menu. This will allow you to interact with the instrument inreal time. It is also possible to work with Summit software offline to analyze previously savedFCS data files.Now you will either create a new database or open a previously saved database.0000050G3-1
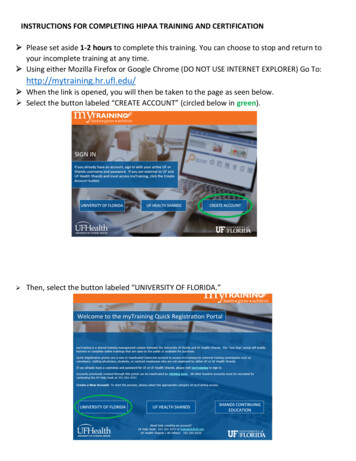
Summit Software OverviewOverviewSummit Software DatabaseA Summit software database is a collection of protocols, samples, and data. After you open a newdatabase a workspace appears in which to create histograms and dot plots. It is also possible to openexisting protocol files that may already contain histogram and dot plot forms.How to Create a New Database1Open Summit Software and click New.Figure 3.2 Create a New DatabaseThe Create Database dialog box appears.2Specify the folder in which you will save the database. Specify a name for the database and clickSave. The main Summit software screen will appear.How to Open an Existing Database1Open Summit Software.Figure 3.3 Browse to an Existing Database3-20000050G
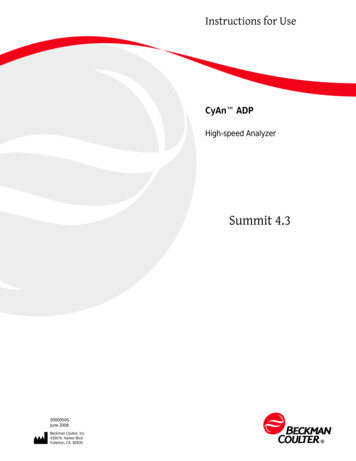
Summit Software OverviewOverview2Browse to the folder that contains the database you would like to open, select the file and clickOpen.Figure 3.4 Select an Existing Database0000050G3-33
Summit Software OverviewOverviewSummit Software Screen OverviewFigure 3.5 Summit Software Screen Overview1. Summit software Main Menu2. Protocol List3. Summit Control Panel (to gain access toadditional screens)4. Additional Menu5.6.7.8.Sample ListAdditional MenuWorkspace (with blank histograms)Toolbar IconsSummit Software Control PanelMost of the operations in Summit software can be accessed through the Summit Software ControlPanel. The panel is located on the left side of the screen and has a series of buttons across the top.You can select each of these buttons to get information related to a particular topic. Each tabcontains submenus that have options specific to that menu.Figure 3.6 Summit Software Control Panel (see number 3. on Figure 3.5)3-40000050G
Summit Software OverviewOverviewAcquisition TabThe Acquisition tab allows you to set the threshold at which an event will be detected by theinstrument, set the event triggering parameter, designate parameter names, specify the data typesthat will be collected, and set the voltage and gain to be applied to each parameter. From Acquisitiontab you can also set up specific sample run information and view sample run statistics.Figure 3.7 Acquisition Tab0000050G3-53
Summit Software OverviewOverviewAcquisition Sample PanelThe Acquisition Sample Panel can be customized to display, and later save, information specific toa sample run.Figure 3.8 Acquisition Sample PanelHow to Edit Information Specific to a Sample Run1To view editable fields, click the blue additional menu icon and select Edit View. The fields thatare editable will activate.Figure 3.9 Acquisition Sample - Accessing Edit ViewFigure 3.10 Acquisition Sample - Editing ExampleNOTE To return to the previous view click Edit View again.3-60000050G
Summit Software OverviewOverview2Change the information in the Value fields as desired.NOTE To individually change a field, double-click in that field, enter the change, and click awayfrom the field.3To add a new Name and Value to the panel select Add Keyword. The Edit Keyword dialog boxappears. For more information on keywords see page 3-19.4Enter the new information, and click OK.How to Change Acquisition SettingsIMPORTANT Before data can be acquired, data type parameters must be enabled. See Figure 3.10How to Change Acquisition Settings1To set the Threshold percentage at which an event will be detected by the instrument, click theup or down arrows in the Threshold % field Figure 3.11. To change the event Trigger parameter,choose an item from the Trigger dropdown list Figure 3.12.Figure 3.11 Set Event Threshold Percentage20000050GFigure 3.12 Set Event Trigger ParameterTo change the name of a parameter, double-click the name of the parameter in the Namecolumn, type a new name Figure 3.13, and then press ENTER.3-73
Summit Software OverviewOverviewFigure 3.13 Change Parameter NameHow to Enable Data Type Parameters1Click the Acquisition tab and locate the Acquisition Parameters panel. Double click in the Peak/Area/Log field. Select the check box that pertains to the data type you want to acquire. SeeFigure 3.10NOTE This can also be done by entering edit mode. To enter edit mode, click on the menu icon in theacquisition parameters tab and select edit mode.3-80000050G
Summit Software OverviewOverviewHow to Change Voltage and Gain for a Parameter1Click the Acquisition screen tab and locate the Acquisition Parameters panel. Double click in theVoltage field. Type a new value or click and drag the slider until the desired value is reached.Figure 3.14 Set Voltage for a ParameterFigure 3.15 Set Gain for the VoltageLoading an Existing ProtocolHow to Load an Existing Protocol1To load a previously saved protocol select File Protocol Load.2A list of previously saved protocol (.plo) files appears. Select the desired file and click Open.Creating ProtocolsWhen you open a new database there is a workspace in which to create histograms and dot plots.The histograms and dot plots that you create become Protocol 1. It is possible to create additionalnew protocols for this database, or load additional pre-existing protocols.How to Create a New Protocol0000050G1To create a new protocol, go to the main menu and select File Protocol New. A newworkspace appears in which to create dot plots and histograms for the new protocol.2Ensure that you have enabled the desired parameters. See figure Figure 3.10.3-93
Summit Software OverviewOverview3Create dot plots and histograms. See page 3-21.Switching ProtocolsTo change protocols in Summit software, go to the Protocols toolbar and select a new protocol fromthe drop down menu.NOTE Only the protocols that you have loaded into the current database or that you have recently createdwill appear in this list.Acquiring Data in Summit SoftwareWhen you have enabled parameters and created or loaded a protocol you may acquire data.How to Start or Stop Data Acquisition1Click the Acquisition pull-down menu and select Start (or press (F2) ).Figure 3.16 Start Acquiring Data2To stop data acquisition, click Stop (or press (F2) ).Saving Acquired DataAfter you acquire data in Summit software you can save the information in FCS format.How to Save Acquired Data13-10Click the Acquisition pull-down menu and select Save (or press F3).0000050G
Summit Software OverviewOverview2Select a folder in which to save the data. Enter a file name and select an FCS file type.3Click Save.Cycle ModeThe Cycle Mode cycles events through a buffer to display only the most recent data. This is usefulduring alignment activities. The number of data events displayed at any one time is adjustable.How to Display the Most Recent Data During Alignment Activities1Click on the Acquisition pull-down menu.2Select Cycle Amount. Set the number of events that should be reached before the data cycles.Figure 3.17 Setting the Cycle Amount for Cycle Mode0000050G3Click OK.4From the Acquisition pull-down menu, select Cycle or click the Cycle Mode icon on the rightside of the screen.3-113
Summit Software OverviewOverviewFigure 3.18 Enabling Cycle Mode53-12After you set the Cycle Mode, restart data acquisition for the Cycle Mode to become effective.0000050G
Summit Software OverviewOverviewSample TabThe Sample tab displays the parameters of the selected sample file, and allows you to change the listof parameters visible on screen. From this tab you can also compensate data.Figure 3.19 Sample TabAuto Load from SampleWhen you compensate data, the Compensation Matrix is established and can be saved with the FCSfile. Selecting the Auto Load from Sample option located on the Sample tab, causes theCompensation Matrix to automatically display when you load a data file for analysis.Figure 3.20 Auto Load Compensation Matrix from FCS File0000050G3-133
Summit Software OverviewOverviewAuto Compensation Wizard for Single Positive ControlsSummit software provides an automatic method to obtain a full compensation matrix for multicolor analysis. The compensation matrix is calculated from single stained controls by the autocompensate function.The following procedure describes how to use the Summit software Auto Compensation featurewithin single stained controls. Although this feature provides an automatic method to compensatedata, compensation can still be adjusted, fine-tuned, or performed manually or via thecompensation matrix.NOTE Additional information regarding compensation can be found in APPENDIX C, CompensationBackground Information.How to use the Auto Compensation Wizard for a Single Stained Control1Acquire the first single-control sample required for your experiment. The first control sampleshould include an unstained or isotype control for which you will set PMT voltages. From theresulting dot plot, you can determine gating if required. Any gates that you want to use must beset before you apply Auto Compensation.NOTE During the Auto Compensation operation, adjustments to only the size and placement of regionsare allowed.3-142Run the remaining single control samples and save the data files.3Load all control sample files into an experiment folder.4Click the Sample tab.5Identify or create a dot plot that will be used to adjust compensation. Ensure that the parameterfor which you are compensating is on the x-axis.6In the Sample Compensation panel, click the small, blue icon in the upper-left corner and selectAuto Compensate from the list.0000050G
Summit Software OverviewOverviewFigure 3.21 Select Auto Compensate7The Auto Comp Sample dialog box appears.Figure 3.22 Auto Comp Sample Dialog8Select a gate from the Gate list, if applicable.9From the Experiment list, select the experiment folder that contains your control samples10 Select all of the single control samples included in the experiment.11 Click OK.0000050G3-153
Summit Software OverviewOverviewIMPORTANT If you click Cancel at any point in the auto compensation process, you will clear thecompensation matrix and the AutoComp Workspace.12 A new Workspace labeled AutoComp is created and the first set of dot plots is displayed. Eachdot plot places the control parameter on the x-axis and a parameter to compensate against onthe y-axis. Default auto compensation Dim and Bright regions are displayed and, if a gate wasselected, it is applied to each dot plot. The Auto Compensate wizard appears.Figure 3.23 Auto Compensate WizardFigure 3.24 Single Control Sample Dot Plots3-160000050G
Summit Software OverviewOverview13 Examine the % Hist statistics for each histogram. If either the Dim or Bright region contains lessthan 5% of the data for the dot plot, click-and-drag the region until greater than 5% of the dataappears in both the Dim and Bright regions.14 When all regions on all plots contain greater than 5% of the data, Click Next on the AutoCompensate dialog box. The next set of dot plots will appear.15 Repeat step 13 until all single-control samples have been compensated. When autocompensation is complete, the compensation matrix contains the appropriate values and theAutoComp workspace is removed.Applying VisiCompTo help you better visualize the results of compensation, Summit software includes a scalingalgorithm called VisiComp that displays 0 and negative values. VisiComp provides a good way toverify the results of the Summit software Auto Compensation feature, and allows you to fine tuneand make adjustments to compensation.How to Use VisiComp to Visualize Compensation Results1Pre-load all necessary samples (Listmode.fcs files) that are required to perform compensation.2Create all plots, regions, and gates.3On the Sample tab, click the Compensation panel icon and select VisiComp.Figure 3.25 Apply VisiComp40000050GUse either the auto compensation wizard to set up plots, or manually set up all of the plots thatyou want to use for compensation analysis.3-173
Summit Software OverviewOverviewFigure 3.26 VisiComp Example5To adjust the width of the VisiComp linear region click the Sample icon in the upper left portionof the window and select Adjust VisiComp. Use the slider tool, or enter a specific value tocomplete the adjustment.Figure 3.27 Adjust VisiCompNOTE The adjusted width of the VisiComp linear region applies to all plots and histograms that displaycompensated parameters in any one sample template. Because of this, it is important to display alldata before you adjust the width. What is ideal for one parameter pair may not be perfect for another.Therefore, adjust the width to display the best compromise across all plots.3-180000050G
Summit Software OverviewOverviewIMPORTANT If you turn off VisiComp, any regions that extend into the negative area of the VisiComp scalewill be moved where they can be displayed on the log scale. Any regions that were entirely in the negativearea will have a 0 width and 0 height.6Create regions and gates to complete your analysis.NOTE If you created regions and gates before you applied VisiComp, you will need to verify the locationof the regions.FCS KeywordsTo customize your view of sample data you can add and remove Keywords.How to Add or Remove Keywords1Click the blue menu icon and select Add/Remove Keywords.Figure 3.28 Add/Remove Keywords 120000050GSelect the check boxes next to the Keywords you would like to display, and click OK.3-193
Summit Software OverviewOverviewFigure 3.29 Add/Remove Keywords 23-200000050G
Summit Software OverviewOverviewHistogram TabHistograms and dot plots (bivariate histograms) are created in the Histogram tab. The CreateHistograms panel displays all of the parameters that are enabled in the Acquisition tab.Figure 3.30 Histogram TabCreating Histograms and Dot PlotsYou must create histograms and dot plots in order to display the data you acquire. Prior to creatingdot plots and histograms you must enable the parameters you would like to collect. See page 3-7.How to Create a Histogram or Dot Plot10000050GCreate dot plots and histograms by selecting the Histogram tab in the Summit Software Controlpanel (see #1. in Figure 3.31). The histograms and dot plots that you create will build a Protocolthat you can elect to save.3-213
Summit Software OverviewOverviewFigure 3.31 Creating Histograms and Dot Plots1. Histogram Tab2. X-axis Parameters23. Y-axis ParametersSelect one of the following: To create a single parameter histogram, double-click on the X-axis parameter for thehistogram you would like to create. The frame for the histogram will appear in theWorkspace on the right of the screen. To create a dual parameter dot plot, click once on the X parameter and twice on the Yparameter. The newly created frame for the dot plot will appear in the Workspace.Maximize Dot Plots and HistogramsTo maximize dot plots and histograms double-click on the title bar. This option is useful to bettersee the data, create regions, or set gates. Double-click the title bar again to restore the image.Change Axis ParametersTo change the displayed parameter in a dot plot or histogram, right-click on the axis you want tochange and select a new parameter from the menu. The options in the list include the parametersthat were collected with the current data file.3-220000050G
Summit Software OverviewOverviewFigure 3.32 Change Axis ParametersChange Axis LabelsTo change the label that is displayed on the X or Y axis of a histogram or dot plot, right-click on theaxis you want to change and select Parameter Properties from the menu. You can enter additionalfluorochrome, marker, or antibody information in the field labeled Long Name. The informationentered in this field will be the label displayed along the axis.View Statistics in HistogramsTo view statistics in histograms, click the additional menu icon within the histogram and selectShow.Figure 3.33 Show Statistics in Histograms0000050G3-233
Summit Software OverviewOverviewEdit Statistics Displayed in HistogramsTo select the statistics that will be displayed in histograms, click the additional menu icon withinthe histogram and select Edit Display.The check boxes that are selected will appear in the statistics window below the histogram or dotplot. You can also drag and drop to change the order of statistics. Click OK to apply these settings toall histograms by selecting the check box at the bottom of the dialog.Figure 3.34 Edit Statistics Displayed in HistogramsFigure 3.35 Edit Statistics Displayed in Histograms3-240000050G
Summit Software OverviewOverviewCreate Regions in HistogramsTo create bar regions in single parameter histograms right-click in the histogram and select Barfrom the menu. In a dual parameter histogram, right click to create a rectangle, ellipse, polygon, orquadrants. Once created, you can click and drag to resize and reposition the region. Once you havecreated regions, the statistics for those regions will appear in the status window below thehistogram. As you move regions the statistics will update in real time. To delete a region right-clickand select Delete.Figure 3.36 Create a Region in a Bivariate HistogramRenaming RegionsRegions can be renamed to reflect the population inside the region. To rename a region right-clickin the region you want to rename and select Properties. A dialog box appears. Enter a new name forthe region in the upper-left text field and click OK.Copy and Paste RegionsYou can copy all regions from histograms and dot plots and paste into another histogram or dotplot. Right-click inside the region and select Copy, go to the next histogram or dot plot, right-clickand select Paste.0000050G3-253
Summit Software OverviewOverviewManually Scaling DataTo manually rescale data within a dot plot or histogram, click the scale up or down buttons on theright side of the screen.Figure 3.37 Manually Scaling DataContouring DataTo Enable Contouring, go to the main dot plot menu and select Display Contour. Select the Enablecontours check box. The dropdown menu directly below the check box lists the available contouringalgorithms. The dialog box contains additional options for maximizing data and smoothing thecontouring.Exporting Histograms to WordTo export a dot plot or histogram to Word, go to the main histogram menu and select Copy Windowas Bitmap. Open Word and paste the histogram image into the document. The Copy as Graphicoption does not include the histogram frame or statistics.Multi File Display It is possible to display more than one data file or sample. Select the Sample tab in the SummitSoftware Control panel. Click the menu icon and select Duplicate. This will copy the existing dotplots and histograms in the protocol.NOTE All copied versions will be indicated with a different color. You can manually arrange the dot plots and histograms, or you can right-click on the whitesheet, select Arrange Windows and select the desired option. To load additional samples, go to the Summit Software Main Menu and select New Samples.Click on a sample name and drag and drop to load additional samples into the templates.3-260000050G
Summit S
CyAn ADP High-speed Analyzer Summit 4.3. . which allow you to acquire, sort, and analyze flow cytometry data then save the data in FCS format. With Summit software you can monitor and control the instrument, define protocols, configure compensation settings and workspaces, define b