Transcription
Mission NotAccomplished:Teen Safe Driving,the Next Chapter
CONTENTSExecutive Summary.1Introduction.3What the Data Reveal.4Comparing Younger and Older Teens, Male and Female Teens. 5Seat Belt Use by Teen Drivers. 7Alcohol-Impaired Teen Drivers. 8Distracted Teen Drivers. 9Speeding Teen Drivers.11ACKNOWLEDGMENTSPam Fischer, Principal,Pam Fischer Consulting,researched and wrote the report.Richard Retting, Sam SchwartzTransportation Consultants,conducted the data analysis.Amadie Hart, Hart StrategicMarketing, LLC, and MadisonForker, GHSA, edited the report.Jonathan Adkins, ExecutiveDirector, GHSA, and Kara Macek,Communications Director, GHSA,oversaw the report.Creative by Winking Fish.The views and recommendationsin this publication do not necessarilyreflect those of the Ford MotorCompany Fund or GHSA.Addressing the Findings/Recommendations. 13Expand GDL to include all teen drivers under 21 years of age. 13Require all novice drivers to complete driver education and training. 16Actively promote the benefits of older teen drivers completinga defensive driving and/or behind the wheel program. 17Provide relatable and relevant impaired driving informationto older teens during license transactions. 19Send an early warning letter when an older teen receives his/her first moving violation. 20Enact a primary seat belt law that covers all motor vehicle occupants in all seating positions.2 1Educate parents about the importance of continuing to coachand monitor their older teen drivers. 22Partner With Colleges to Promote Safe Driving. 25Partner with graduating high school peer leaders to help themcontinue their traffic safety outreach in college. 29Partner with law enforcement to conduct high visibility enforcementcoupled with school-based education and earned/paid media. 30Capitalize on the popularity of music and sports with teensto disseminate safe driving information/ messages.32Conclusion. 34References. 35Endnotes. 38Mission Not Accomplished: Teen Safe Driving, the Next Chapterii
Executive SummaryGHSA analyzed 10 years of fatal crash data (2005–2014) involvingteen drivers 15 to 20 years of age from the National HighwayTraffic Safety Administration’s (NHTSA) Fatality Analysis ReportingSystem (FARS) for the purpose of answering the followingquestions: How have the characteristics of fatal crashes involving a teendriver changed over this time period?Are there differences in fatal crash characteristics betweenyoung teen drivers (ages 15 to 17) and older teen drivers (18 to20 years of age)?Are there differences in crash characteristics between maleand female teen drivers?The data revealed that teen driver involvement in fatal crashesfell 48 percent from 7,500 in 2005 to 3,885 in 2014. This, in turn,resulted in a 51 percent decrease in teen driver deaths, as well asdeclines of 59 and 44 percent, respectively, in teen driver seriousand minor injuries. When comparing fatal crashes per 100,000licensed drivers, the rate for teens fell 44 percent, whereas it fell 27percent for a comparison group of adult drivers 35 to 40 years ofage. The difference in fatal crash rates between these two subsetsof drivers has narrowed considerably, from 27.1 per 100,000 driversin 2005 to 9.5 in 2014 – a 65 percent decline. However, taking intoaccount licensing rates for teens and the adult comparison group,teens are still 1.6 times more likely to be involved in a fatal crash.When the teen crash data is segmented by young and older teendrivers, the decline in fatal crashes is larger for younger (56%) thanolder teens (44%). The fatal crash rates per 100,000 licensed driversMission Not Accomplished: Teen Safe Driving, the Next ChapterWhen the teen crash data is segmentedby young and older teen drivers, thedecline in fatal crashes is larger foryounger (56%) than older teens (44%).for the two groups also showed better improvement for youngversus older teens, at 51 percent and 40 percent, respectively. Forboth teen driver age groups, the rate is twice as high for males as itfor females. A closer examination of the data by age also revealedthat 19-year-olds accounted for the greatest number of teen driverskilled during this 10-year period, followed by 20- and 18-year-olds.There is a disparity among young and older teen drivers as to thetime of day when fatal crashes occur, with older teens twice as likelyas their younger counterparts to be involved in a fatal crash betweenmidnight and 6 a.m. This is likely due to states enacting graduateddriver licensing (GDL) laws, which ban young teens from late nightdriving. When it comes to seat belt use, all female teen drivers hadseat belt use rates that were an average of 15 percent higher than forall male teen drivers. However, female teens were more likely than1
male teens to be reported as being distracted at the time of the fatalcrash, but less likely than males to be speeding.While most teen drivers involved in fatal crashes were either nottested for alcohol or had no alcohol in their system, nearly 10 percentof the young teens and 20 percent of the older teens involved infatal crashes had blood alcohol concentration (BAC) levels of 0.01%or higher. The percentage of males in both the young and older teendriver age groups that had BAC test results of 0.08% (the legal limitfor drivers over 21) or higher was roughly double that of their femalecounterparts.Recognizing the impact GDL has had on reducing crashes involvingyoung teen drivers (overall reductions of 10 to 30 percent), statesshould expand GDL laws to include all novice drivers under 21years of age. Currently, New Jersey is the only state where its GDLprovisions apply to all new drivers under 21 years of age. Since teensin nearly every state age out of GDL at 18, and many wait to obtaina license until reaching that age or older, it is critical to ensure theyreceive the lifesaving benefits of this proven countermeasure.Unfortunately, the recent decline in fatal teen crashes may becoming to an end. Data released by NHTSA in August indicate thatfatalities in crashes involving teen drivers increased 10 percent in2015 (overall motor vehicle deaths increased 7.2%), the first upticksince 2006. While this year over year change is concerning andbears monitoring by the states and teen driving advocates, it is tooearly to suggest that the downward trend line has fully reversedcourse.Mission Not Accomplished: Teen Safe Driving, the Next ChapterBased on the results of this latest data analysis and the 2015 FARSdata, GHSA recommends the following: Expand GDL requirements to include all teens under 21 years ofage.Require all novice drivers to complete driver education andtraining.Actively promote the benefits of older teen drivers completing adefensive driving and/or behind-the-wheel program.Send an early warning letter addressing the impact of engagingin unsafe driving behaviors to an older teen following receipt ofhis/her first moving violation.Enact a primary seat belt law that covers all motor vehicleoccupants in all seating positions.Educate parents about the importance of continuing to coach andmonitor their older teen (18-20-year-old) drivers.Partner with colleges to promote safe driving.Partner with graduating high school peer leaders to help themcontinue their traffic safety outreach in college.Partner with law enforcement to conduct high visibilityenforcement coupled with high school- and college-basededucation and earned/paid media.Capitalize on the popularity of music and sports with teens todisseminate safe driving information/messages.2
IntroductionTeens today have never licked a postage stamp, the Internet hasalways existed, and if you say around the turn of the century, theymay ask, which one? Despite growing up in a world that is fardifferent from that of previous generations, there is one constant – aheightened risk of being involved in a car crash. Certainly, advancesin vehicle technology coupled with policies that put limits on theyoungest novice drivers are driving down fatalities. But mile for mile,teens continue to have the highest crash risk of any age group onthe road (Insurance Institute for Highway Safety [IIHS], 2012).Why? It’s not that teens are necessarily bad drivers; they simply donot have the skills or experience to anticipate or recognize a hazardand take corrective action. While it is common for people to assumethat teen crashes are caused by risk-taking behaviors, driver error(e.g., inadequate scanning, driving too fast for conditions) accountsfor more than half of these incidents (Curry et al., 2011). At the sametime, the part of the brain that controls impulse inhibition, decisionmaking and judgment is not fully developed until the early to mid20s (Paus, as cited in Shope, 2006). That may explain why teensand young adults are more likely than their older counterparts to beimpulsive and not consider the costs of engaging in a potentiallydangerous behavior behind the wheel (Atchley & Warden, 2012, &Hayashi et al., 2015, as cited in Delgado et al., 2016).Unfortunately, that need for instant gratification can prove deadly.Just how deadly, which teens are most likely to be involved, and whatstates and others working in teen driver safety can do to mitigatethat risk is the focus of this report. Using the National HighwayTraffic Safety Administration’s (NHTSA) Fatality Analysis ReportingSystem (FARS), which provides a consistent and complete nationalperspective on drivers involved in the most serious crashes, thisreport examines 10 years of fatal crash data (2005-2014) involvingteen drivers1 between the ages of 15 to 20 to answer three questions: How have the characteristics of fatal crashes involving a teendriver changed over this time period?Mission Not Accomplished: Teen Safe Driving, the Next Chapter Are there differences in fatal crash characteristics between youngteen drivers (ages 15 to 17) and older teen drivers (18 to 20 yearsof age)?Are there differences in crash characteristics between male andfemale teen drivers?The analysis, which was conducted by Richard Retting of SamSchwartz Transportation Consultants, also examined injury severityamong teen drivers, when the crash occurred, crash characteristicswith a particular focus on causation factors (e.g., impairment,speeding), seat belt use, and environmental conditions. To allowfor identification of trends specific to teen drivers, rather than thepotential influence of external factors that impacted the crashpopulation as a whole, a comparison group of adult drivers 35 to 40years of age was included in the analysis.Following this analysis, the Governors Highway Safety Association(GHSA) surveyed State Highway Safety Offices (SHSOs) to identifysafe driving initiatives expressly targeted at older teen drivers and/or their parents. (GHSA has previously surveyed states to learn aboutteen safe driving initiatives, but not those focusing on older teens.)Input was received from 10 states and telephone interviews weresubsequently conducted with select state officials and programproviders along with online research. These findings are discussedin the recommendations section of this report.Funding for this report was provided by the Ford Motor CompanyFund. Working in partnership with GHSA and its members since 2003,the Ford Motor Company Fund’s Driving Skills for Life (Ford DSFL)program is positively influencing thousands of teen drivers throughoutthe U.S. By the end of 2016, Ford DSFL will have reached more thanone million teens and their parents through its free, behind-the-wheeltraining programs, online education, school-based programs, and safedriving campaigns in all 50 states and 33 countries.3
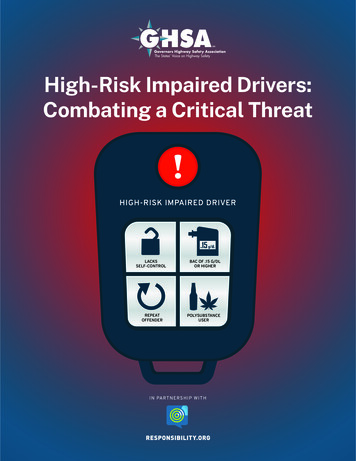
30%23%20%What the Data Reveal10%12%16%10%21%13% 15%9%0%When it comes to teen driving, the dominant headline for years hasbeen “car crashes are the leading cause of death for U.S. teens”(Centers for Disease Control, [CDC], 2015). But the storyline has takena dramatic turn over the past decade. GHSA’s analysis of FARS datafound that from 2005 to 2014, fatalities among 15 to 20-year-oldsdeclined 51 percent, while serious and minor injuries fell 59 percentand 54 percent respectively. This positive change is the result ofteen-involved fatal crashes decreasing 48 percent, from 7,500 in2005 to 3,885 in 2014.When comparing the fatal crash rates per 100,000 licensed drivers,the decrease is greater for teen drivers (44%) than for drivers 35 to40 years of age (27%).FIGURE 1: Rate of Teen Drivers in Fatal Crashesper 100,000 Licensed Drivers6059.653.144.338.8403035.531.430.62005 2006200734.535.732.532.227.324.020MaleYoung Teen (15–17)FatalSeriousWhat is driving the downward trend in fatal teen crashes and theresulting injuries and fatalities? Graduated driver licensing (GDL)is credited with reducing crashes among young teens by 10 to 30percent (McCartt et al., 2010). The three-stage licensing systemis designed to delay full licensure while allowing teen drivers togain experience under lower risk conditions. The crash reductionsprompted by GDL are even higher when key provisions of statelaws – namely the nighttime driving and passenger restrictions –are taken into account.Possible Inju57.75032.5FemaleA closer looks reveals even more good news – the difference in thefatal crash rate between these two subsets of drivers has narrowedconsiderably, from 27.1 per 100,000 licensed drivers in 2005 to 9.5in 2014. That equates to a 65 percent decline. However, taking intoaccount licensing rates for teens and the older driver comparisongroup, teens are still 1.6 times more likely than 35- to 40-year-olds tobe involved in a fatal crash. That rate is down from 1.8 in 2005, but upslightly from 1.3 in 2013.2008 2009Teens dults (35–40)Mission Not Accomplished: Teen Safe Driving, the Next ChapterThis decline can also be attributed to the fact that fewer teensare getting a driver’s license (Shults et al., 2015). The drop in teenlicensure, however, has not been influenced by stricter licensinglaws or the ability to interact with friends via social media, which hasbeen reported by some media outlets. Instead, it’s economics, pureand simple. Numerous studies confirm that teens were negativelyimpacted by the recession, making the cost of owning and operatinga vehicle a hardship. Additionally, if a teen’s parents were impactedby the economic downturn, it was unlikely they were able or willingto subsidize these costs, further de-incentivizing teen licensure(Highway Loss Data Institute [HLDI], 2013).4
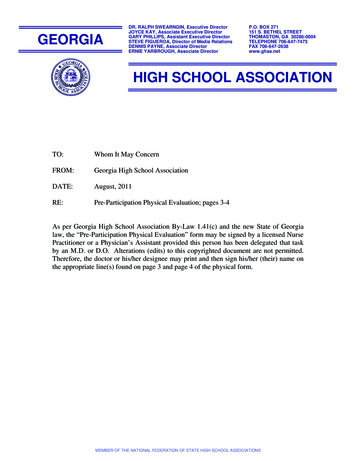
The decrease in fatal teen crashes, however, may be coming to anend. Data released by NHTSA in August indicate that fatalities incrashes involving teen drivers increased 10 percent in 2015 (overallmotor vehicle deaths increased 7.2%), the first uptick since 2006(NHTSA, 2016a; NHTSA, 2016b). While this year over year changeis concerning and bears monitoring by the states and teen drivingadvocates, it is too early to suggest that the long-term downwardtrend has fully reversed course.FIGURE 2: Teen Drivers in Fatal Crashes by Age Group6,0005,0005,1855,2344,2204,0003,7812,315The recent increase in teen driver fatal crashes is troubling, andstates and teen safe driving advocates are keeping a watchful eyeon the data. But also troubling is what the GHSA analysis uncoveredregarding younger (15- to 17-year-old) and older (18- to 20-year-old)teen drivers, as well as male and female teen drivers. While fatalcrashes involving young teen drivers fell 56 percent from 2005 to2014, the decline was actually 11 percent lower (45%) for their oldercounterparts during this same time period (see Figure 19861,0092012201320142,1031,6651,3891,00002005 200620072008 2009Young Teen (15–17)Older Teen (18–20)Comparing the rate of fatal crashes per 100,000 licensed teendrivers, there is less distinction between the two age groups. Evenso, the decline over the 10-year period was still steeper for youngteens (51%) than for older teens (40%), as illustrated in Figure 3.FIGURE 3: Rate of Teen Drivers in Fatal Crashes per 100,000Licensed Drivers by Age Group807067.260.060PercentComparing Younger and Older Teens,Male and Female Teens3,2903,0002,000What may be sparking the jump in fatal crashes is an increase in thenumber of teens who are driving. A July 2016(a) Insurance Institutefor Highway Safety/Highway Loss Data Institute (IIHS/HDLI) analysisof teen and adult drivers found that while teens, as a proportion of allinsured drivers, dropped during the recession and bottomed out at3.8% in 2012, that rate is once again on the rise, climbing to 4.1% at theend of 2014. (The adult insured rate also dropped during the sametime period, but the drop was significantly less than that of 201320141002005 200620072008 2009Teens (15–17)Mission Not Accomplished: Teen Safe Driving, the Next Chapter2010Older Teens (18–20)5
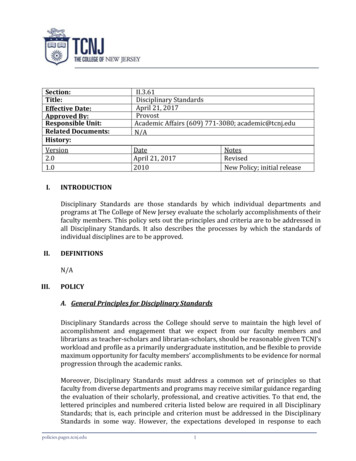
FIGURE 5: Teen Drivers in Fatal Crashesby Driver Injury Severity, 2010-2014When the fatal crash data is segmented by sex, the rate ofinvolvement in fatal crashes per 100,000 licensed drivers is twiceas high for males as it is for females for both young and olderteens (see Figure 5048.54047.72010020102011Young Teen (15–17)Female47.746.9231225211613 1510Female9MaleYoung Teen (15–17)111410Female2210137MaleOlder Teen 2014Older Teen (18–20)Male403006047423820107030PercentFIGURE 4: Rate of Teen Drivers in Fatal Crashes per 100,000Licensed Drivers by Sex & Age Group40FemaleMaleTeen drivers in both age groups were also more likely to suffer fatalinjuries (as compared to older drivers 35 to 40 years of age), butolder teens accounted for a greater proportion of those deaths from2010 through 2014. Both young and older teen males were slightlymore likely to suffer fatal injuries than their female counterparts (seeFigure 5).Mission Not Accomplished: Teen Safe Driving, the Next ChapterSerious InjuryPossible InjuryMinor InjuryNo InjuryThis last finding is not surprising, since male drivers of all ages areinvolved in more fatal crashes than females and more die on U.S.roadways as a result of collisions. For every year from 1975 to 2014,more than twice as many men died in motor vehicle crashes thanwomen, with males accounting for 71 percent of all passenger vehicledriver deaths in 2014. Females, however, are starting to catch up, asmale deaths have declined 29 percent while female deaths have onlydeclined 20 percent since 1975 (IIHS, 2016b). Why? Even though mentypically drive more miles than women and are more likely to engagein risky behaviors, female drivers are traveling 89 percent fartherthan they did four decades ago. Men, on the other hand, are goingonly 33 percent farther. Regardless, men are still likely to be on theroad more often than women (Sivak, as cited in University of MichiganNews, 2012). The GHSA analysis of teen-involved fatal crashes foundthat the gap between male and female drivers has remained relativelyconstant over the past decade, with males accounting for an averageof 70 percent of the crashes and females 30 percent.6
The time of day when teen-involved fatal crashes occur is alsonoteworthy. The 10-year data analysis found that for each timeblock, the trend generally follows that of teen driver involvement infatal crashes overall, with crashes falling an average of 47.5%. Thegreatest decline occurred during the 12:00-3:00 a.m. time block(57%), followed by 12:00-3:00 p.m. (50%) and 3:00-6:00 a.m. and3:00-6:00 p.m. (which both declined 49%)This decline during the late night/early morning hours is likely due tostates enacting GDL laws that include nighttime driving restrictionsor strengthening an existing late night provision for young drivers.However, a closer look at the data for 2010 through 2014 found thatolder teen drivers – who are not impacted by GDL in all but onestate (New Jersey) – were twice as likely as young teen drivers tobe involved in fatal crashes during the hours between midnight and6:00 a.m. (see Figure 6).FIGURE 6: Teen Drivers in Fatal Crashesby Time of Day, 6:p.m.a.m.a.m.a.m.5:59a.m3:00–:59Young Teen (15–17).40–21716169:PercentWhile teens have historically had lower seat belt use rates thanadults, the number of teens who rarely or never buckle up hasdeclined 20 percent since 1991 (CDC, 2016). According to NHTSA(2016c), of the teen drivers involved in fatal crashes in 2014, 54percent who died were restrained, which compares to 53 percentof all drivers who died. However, of the teen drivers that survived afatal crash, 84 percent were restrained, compared to 90 percent ofall surviving drivers.19131515:00Seat belt use in the U.S. reached 88.5% (for all ages) in 2015,continuing a slow but steady climb since 2000 (NHTSA, 2016b).States with primary seat belt laws that allow law enforcement officersto ticket a driver or passenger for not wearing a seat belt withoutany other traffic offense taking place (currently 35) continue to havehigher use rates than states with secondary or no seat belt laws,at 91.2% versus 78.6%, respectively. At the same time, the rate ofunrestrained passenger vehicle occupant fatalities (all ages) declinedfrom 51.6% in 2000 to 40.3% in 2014 (2015 rates are not yet available)(NHTSA, 2016b).222012Seat Belt Use by Teen DriversOlder Teen (18–20)Mission Not Accomplished: Teen Safe Driving, the Next Chapter7
When segmenting teen drivers involved in fatal crashes by ageand sex for this study, the GHSA analysis found that from 2010 to2014, seat belt use by females in both the 15- to 17-year-old and 18to 19-year-old age groups was 15 percent and 20 percent higher,respectively, than that of their male counterparts (see Figure 7).GHSA’s analysis of FARS data for teen drivers involved in fatalcrashes found that a majority were either not tested for BAC or hada BAC of 0.00%. Among teens who were tested, however, nearly10 percent of the young teens and 20 percent of the older teensinvolved in fatal crashes had BAC test results of 0.01% or higher(see Figure 8).FIGURE 7: Teen Drivers in Fatal Crashesby Restraint Use, 2010-2014FIGURE 8: Teen Drivers in Fatal Crashesby BAC Test Result, emalePercent70MaleFemaleYoung Teen (15–17)87MaleOlder Teen lted423840.01–0.07%660.08% Not Tested7UnknownUnknown/NAYoung Teen (15–17)Alcohol-Impaired Teen DriversAll states and the District of Columbia (D.C.) have 21-year-oldminimum drinking age laws, which are credited with saving 30,323lives (all ages) since 1975. While the number of teen drivers involvedin fatal crashes who had blood alcohol concentration (BAC) levelsof 0.01 grams per deciliter (or 0.01%) dropped 48 percent between2005 and 2014, the rate of teen drivers with a 0.01% BAC or higherremained the same, at 22 percent (NHTSA, 2016b).Mission Not Accomplished: Teen Safe Driving, the Next ChapterOlder Teen (18–20)A closer look at the teen-involved fatal crash data by age for themost recent year for which complete FARS data is available (2014),indicates that 19-year-olds accounted for the greatest number of teendrivers killed and that 29 percent of those drivers had alcohol in theirsystem at the time of the crash. As Table 1 (see next page) illustrates,alcohol involvement among teens killed in fatal teen crashesincreases with age (NHTSA, 2016b).8
Distracted Teen DriversTABLE 1: Teen Drivers Killed by Age and Percentagewith BAC 0.01 or Higher, 2014Percentageof DriversWith BAC .01 g/dLTotalNumber ofDrivers KilledAge (Years)Percentageof DriversWith BAC .08 9%24%2044233%28%Distraction caused by cell phones, passengers and other things(e.g., inattention, mind wandering, eating/drinking) negativelyimpacts all drivers, but particularly teens. To ensure that the teendriver was distracted and not the non-teen driver of another vehicleinvolved in the fatal crash, the GHSA analysis considered onlysingle vehicle crashes. From 2010 through 2014, nearly two-thirds ofboth young and older teen drivers as well as the adult comparisonage group were not distracted at the time of the fatal crash. Theremaining drivers – approximately 10 percent in each age group –were distracted, as shown in Figure 10.FIGURE 10: Drivers in Single Vehicle Fatal Crashesby Distraction, 2010-2014When the data is segmented by sex, the percentage of males inboth the young and older teen driver age groups that had BAC testresults of 0.08% or higher was roughly double that of their femalecounterparts (Figure 44390423838341623FemaleMaleYoung Teen ng Teen (15–17)Electronics14131114Female7 77MaleOther Occupants11511611FemaleOlder Teen (18–20)Eating, Drinking, Smoking108463545030646060PercentFIGURE 9: Teen Drivers in Fatal Crashes by BAC Test Resultby Sex, 2010-201480638-MaleAdults (35–40)Internal ControlsExternal DistractionOther Distraction42FemaleMaleOlder Teen (18–20)0.08% This is consistent with the most recent NHTSA analysis of FARS data(2014) that indicate that 10 percent of the youngest drivers (15- to 19-yearolds)2 involved in fatal crashes were distracted at the time of the crash.Not TestedMission Not Accomplished: Teen Safe Driving, the Next Chapter9
However, among all age groups, teens had the largest proportion ofdistracted drivers, followed by 20- to 29-year-olds (NHTSA, 2016d).and older teen female drivers, respectively, were 2.5 and two timesmore likely to be distracted by an electronic device than 35- to 40-yearold female drivers.Figure 10 also illustrates that between half and three-quarters ofdistractions for each age group and sex were categorized as OtherDistractions, which include eight distractions such as lost in thought/daydreaming, inattention, and details unknown. Distraction by electronics(cell phones) was two times higher for all female teen drivers than for allmale teen drivers, but highest among the young female drivers whencomparing them to their older teen counterparts. Meanwhile, youngChanges in the rate of driver distraction from 2010 to 2014 were alsoconsidered in the GHSA analysis. There was no significant changefor any of the distraction categories for any age group, as shown inTable 2. Distraction categories were grouped based on the commonfocus of teen driver education and outreach programs – electronics(cell phones), other occupants and other distractions.TABLE 2: Distraction in Fatal Crashes by Age and Distraction Type, 2010-2014DistractionAge GroupYoung Teen (15–17)Older Teen (18–20)Adult (35–40)Crash YearNot Distracted201066%Electronics2%Other Occupants1%Other DistractionUnknown/Not 7%26%201365%1%1%6%27%201465%1%1%6%27%Mission Not Accomplished: Teen Safe Driving, the Next Chapter10
A closer look at these findings reveals that passengers were presentin 34 percent of all of the crashes (84 percent of the passengerswere between 16 and 19 years of age) and the teen driver was talkingor interacting with these passengers in 15 percent of the crashes. Incrashes involving a cell phone, the teen driver was either operatingor looking at the device (9% of crashes) or talking or listening to it (3%of crashes) (Cher et al, 2016).The AAA Foundation study also examined how teen cell phone usevaried based on crash type. Twenty-eight percent of road-departurecrashes involved the teen driver opera
young teen drivers (overall reductions of 10 to 30 percent), states should expand GDL laws to include all novice drivers under 21 years of age. Currently, New Jersey is the only state where its GDL provisions apply to all new drivers under 21 years of age. Since teens in nearly every state age out of GDL at 18, and many wait to obtain