Transcription
2021 Co-opEconomic OutlookJoe Goodenbery, Lead Economist, NRECAMark Santero, President & CEO, Homestead Funds
Contact Technical Support If you are listening through your computerspeakers, please emailNRECA@commpartners.com. If you are listening over the phone, pleasepress *0. Pg. 2
Submit Your QuestionsStep 1: Type in your question.Step 2: Click the Send button. Pg. 3
Download Today’s Files1. Click here in the Resources box toopen the presentation slides orhandout.2. Click on an icon to print or save thefile.February 16, 2021 Pg. 4
2021 Co-opEconomic OutlookJoe Goodenbery, Lead Economist, NRECAMark Santero, President & CEO, Homestead Funds
Today’s SpeakersRobbin ChristiansonSenior Manager, Engagement& Strategy, NRECAJoe GoodenberyLead Economist, NRECAMark SanteroPresident & CEO,Homestead Funds
Agenda The Pandemic Recession Indicators Unemployment The Path ForwardPg. 7
The Pandemic Recession - Which Path Forward?Real Gross Domestic Product (GDP)Billions of Chained 2012 DollarsV-Shape 19,5004% Growth 19,000ReverseSq. Root 18,500 18,000 17,500RecessionW-Shape 17,000 16,500 16,000*Pg. 8
The Pandemic RecessionDaily COVID-19 InfectionsDaily COVID-19 Infections per 100k7-Day Moving Average807060U.S. TotalElec Co-op Areas50403020100Source: CDCSource: NRECA analysis of data from usafacts.orgPg. 9
U.S. Vaccination ProgressDoses AdministeredDoses Administered Per 100,000Daily and Cumulative1,600,0001,400,000Daily Doses 7-Day AvgReceived 2nd Dose 7-Day AvgCumulative Total DosesCumulative 2nd 0010,000,0000Source: CDCPg. 10
IndicatorsCOVID-19 Community Mobility ReportDiners: Online, Phone, Walk-in ReservationsPercent Change from Baseline – 7-Day AvgPercent Change from Previous Year – 7-Day Avg20100-10-20-30TransitRetail & 0*Pg. 11
IndicatorsTravelers Through TSA CheckpointsPercent Change from Previous Year0%-20%-40%-60%-80%-100%-120%Pg. 12
Indicators*Pg. 13
UnemploymentMillionsCivilian Unemployment2520151050Source: U.S. Bureau of Labor Statistics (BLS)MillionsInitial Claims forUnemployment Insurance 20207654RegularPandemic UnemploymentAssistance3210Source: U.S. Department of LaborPg. 14
Unemployment in Electric Co-op AreasUnemployment Rate15%14%13%12%11%10%9%8%7%6%5%4%3%2%1%0%National RateCo-op Area 4.4%12.7%10.6%8.3%7.8%6.4%5.9%5.2%5.2%5.4%Source: NRECA analysis of data from the U.S. Bureau of Labor Statistics (BLS)Pg. 15
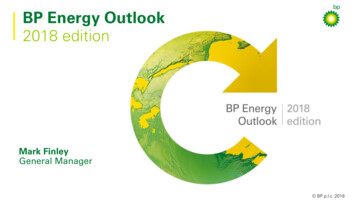
Unemployment in Electric Co-op AreasUnemployment Rate in Co-op Counties by Primary IndustryM IN IN G/E XTR AC TIONDec-20 (Preliminary)GOVE R N M E N TM AN U FAC T U R IN GFAR M IN -204.1%6.0%5.7%4.7%6.3%6.6%11.4%4.0%6.3%5.7%4.8%R EC R EATIONApril-2012.0%16.6%Feb-20N ON S PEC IAL IZ E DSource: NRECA analysis of data from the U.S. Bureau of Labor Statistics (BLS) and USDA Economic Research Service (ERS)*Pg. 16
Uneven Unemployment PersistsServicesIncome*Pg. 17
Creighton University Economic IndicesIndexValue100Rural Mainstreet 101000Mid-American EconomyBusiness Conditions IndexSource: Creighton UniversityPg. 18
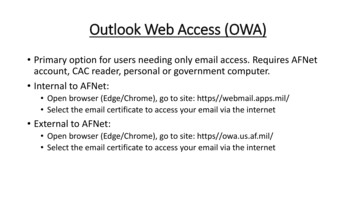
GDP GrowthQ4 2019 100115CBO Economic Outlook1101051009590Source: Congressional Budget Office, Economic Outlook Feb 2021Pg. 19
Unemployment Outlook* Pg. 20
SummaryPandemic Recession GDP – 3.5% decline in 2020 Services – Impacts but uneven, greatest declines in retail,leisure/hospitality, and recreationEmployment (co-op areas) Recreation/tourism initial and continuing impacts Manufacturing initial impact but signs of recovery Agriculture stronger relative to other sectorsOutlook GDP – recovery to pre-pandemic level in 2021 (Q3/Q4) Employment impacts may linger into 2023 or 2024Pg. 21
Q&A
Submit Your QuestionsStep 1: Type in your question.Step 2: Click the Send button.February 16, 2021 Pg. 23
Thank YouIdeas &CommentsWelcomeJoe Goodenbery, NRECAJoseph.Goodenbery@nreca.coopMark Santero, Homestead FundsMark.Santero@homesteadfunds.comRobbin Christianson, NRECARobbin.Christianson@nreca.coop
2021 Co-op Economic Outlook. Joe Goodenbery, Lead Economist, NRECA