Transcription
The Global Automotive OutlookOpportunity Identification in a Disruptive MarketFebruary 20, 2019Joseph McCabe, President855.734.4590 ext. 1001Data that drives tomorrow.February 2019
Data that drives tomorrow.February 2019
Competing in a Disruptive Global MarketMarket Drivers, Enablers & Constraints Consumer preference vs. market direction Shareholder valueEconomicRecovery Supply chain importance to the VM strategyOwnership& OperatingCost Innovation in product and strategy Investment strategiesFinancialMarketsMarketDirection &the need forInnovation Regulations, incentives, and standards Geo-political impact on globalizationGov’tInvestmentTechnologyPrice Effects Future playersAuto SupplyChain Minimize risk and maximize opportunities Defend core operations and identify areas for growth3Data that drives tomorrow.February 2019
4Data that drives tomorrow.February 2019
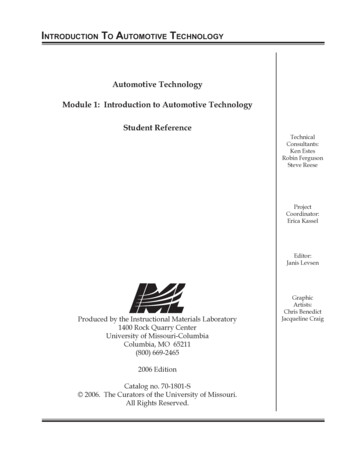
NA Growth Outlook and OEM Group ContributionNorth America Y-O-Y Production Volume Impact18Millions17.671717.1117.1617.03Production Volume Change by OEM 00,000-900,000-900,0002017 2018 2019 2020 2021 2022 2023 2024 2025 2026Calendar YearD3EUAPEVTotal YOY ChangeSource: AutoForecast Solutions – January 20195Data that drives tomorrow.February 2019
NA Production by OEM Parent Base LocationNorth America Light Vehicle 41Millions14121086427.056.996.770APD3EUEVSource: AutoForecast Solutions – January 20196Data that drives tomorrow.February 2019
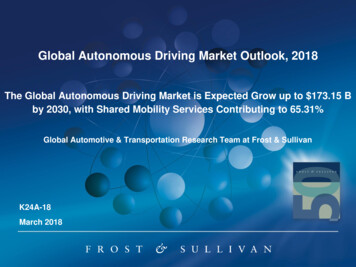
North America: Passenger Car Segment ContributionAnnual Volume2018 5.3M2026 4.2M D3 reduce car footprint by 625K EV5%D316% Korean OEMs reduce 90K4%2018 European OEMs gain 120K25%Korea14%52%12%Japan54% Japanese OEMs reduce by 490K 8%EU10%JapanEuropean EV – primarily Tesla – reduce 8KKoreaD3EVSource: AutoForecast Solutions – January 20197Data that drives tomorrow.February 2019
North America: Crossover Vehicle Segment Contribution European OEMs add 400K unitsAnnual Volume2018 6.1M2026 7.4M Japanese OEMs add nearly 485K unitsEV2%D340%43%20261% Korean OEMs down 10K201835%Korea3%4% EV group – adding about 135KJapan36%17% D3 add 310K (but loses market share?) Consider these imported models EU19%JapanEUKoreaD3EV Jeep Renegade from Italy – 100K Buick Encore from Korea – 90K Ford EcoSport from India – 50K paceChinaSource: AutoForecast Solutions – January 20198Data that drives tomorrow.February 2019
North America Production Highlights U.S. Sales growth in 2018 Import Substitution Over 17 million for 4th straight year Subaru Impreza Lexus ES and RX BMW passenger cars in Mexico Growing mid-sized Pickups NOT cannibalizing fullsized trucks (yet) Ford Ranger, expanded Jeep lineup, Ram entries Global Export Hub SUV resurgence Ford Bronco and Jeep Wrangler 4-door Jeep Wagoneer / Grand Wagoneer to take onEscalade and Navigator Strong move for FCA VW Atlas (both 2 and 3-row variants)VW AtlasSubaru AscentAudi Q5BMW CUVs Mexico to offset slow selling Passat GM portfolio adjustment Product mix and plant utilization9Strong export hubMultiple global free trade agreementsEstablished supply baseStrong government supportData that drives tomorrow.February 2019
10Data that drives tomorrow.February 2019
U.S. Light Vehicle Sales U.S. light vehicle sales peaked in 2016 17.46 million 2018 marked the forth straight year over 17 millionunits Slowdown expected in 2019 and 2020 17 million not expected to return until 2024 2% decline in 2019 Market being driven by light truck growth squeezing car share to near 27% in 2019 heading toward under 20% by 2023 Import substitution offsetting future salescontributionsSource: AutoForecast Solutions – January 201911Data that drives tomorrow.February 2019
Recession RiskWhen long-term and short-termtreasury rates bonds converge,the odds increase for a recessionRecessions Recent recessions, including 20072009, 2001, and 1990-1991, coincidedwith the bond rate convergence Convergence typically leads to arecession within 12-18 months Rates converged in late ‘18 and early‘19, pointing toward a recession inearly- to mid-2020Source: United States Department of the Treasury/AutoForecast Solutions – February 201912Data that drives tomorrow.February 2019
13Data that drives tomorrow.February 2019
Domestic Investment Opportunity Nissan Rogue Mazda CX-5 Sourced from Japan, South Korea, and the U.S. Two-thirds of U.S. derived from imports Top selling Mazda product Sourced from Japan Toyota RAV4 Hyundai Tucson Nearly 250,000 expected from Japan this year Among the best selling Hyundai models Sourced from South Korea Toyota 4Runner Kia Soul Potential for North American sourcing Not enough factory space for 150,000 Sourced from South Korea Low-cost hampers North American sourcing Subaru Forester Honda Civic Only made in Japan Subaru U.S. plant running at full speed Strained production capacity in Japan Specialty models imported from U.K. BREXIT - production justification still valid? Subaru Crosstrek Jeep Renegade Related to the U.S. sourced Impreza U.S. plant running at full-speed Strained production capacity in Japan Globally sourced from Italian plant Shares plant with related Fiat 500X1414Data that drives tomorrow.February 2019
15Data that drives tomorrow.February 2019
Global Light Vehicle Production(2010 – 2026)Volume Growth (2010 – 2026)MillionsGLOBAL LIGHT VEHICLE PRODUCTION-2610ASIA-PACIFIC10095.3EASTERN EUROPE141815.6101.280Millions22.66059.9MIDDLE EAST/AFRICA1.3405.7NORTH AMERICA20SOUTH AMERICA-0.40WESTERN EUROPE1.8Source: AutoForecast Solutions – January 201916Data that drives tomorrow.February 2019
Global Segment AnalysisSegment Growth2026 vs. 2018Global Segment 0%4%15%Pickup-5.31%2010PC40%SUV3.24%59%CUV23.50%PC -3.87%CUV38%Source: AutoForecast Solutions – January 201917Data that drives tomorrow.February 2019
“1 Million Unit Club” Brand Owner Analysis (2018 vs. 2026)MILLION UNITS OF GLOBAL PRODUCTIONRANKING BASED ON 2026 POSITION0246810Toyota MotorRenault-Nissan-MitsubishiVolkswagenHyundai MotorFord MotorGeneral MotorsFCAHonda MotorGroupe PSADaimlerGeely GroupBMWSAIC-GM-WulingMazda MotorMaruti SuzukiTataSuzuki MotorChangan AutoSubaruGreat Wall Automobile122090%Brand Owners in2026 producingOVER 1 Millionunits/yearPer cent ofTotal GlobalProductionTop 10 Brand Owners73% of total marketInductees Since 2010Beijing Automotive GroupGreat Wall AutomobileGeely Group (with Volvo)Tata2026Subaru2018Source: AutoForecast Solutions – January 201918Data that drives tomorrow.February 2019
China – Vehicle Production OutlookVehicle Manufacturers in China by yearChina Vehicle Production3071% 16.815Brand Owners in China by year10202651059120182010075Source: AutoForecast Solutions – January 201919Data that drives tomorrow.February 2019
China: Fractured Decision HER51%50%% of TotalProductionin China byBrand5%5%4%5%5%2%4% 4%FordToyota 4%Nissan 4%3%Honda5%Baojun4%Wuling4%Buick4%Navigating the Decision Making ProcessGeography, leadership, politics, regulation, languageSource: AutoForecast Solutions – January 201920Data that drives tomorrow.February 2019
21Data that drives tomorrow.February 2019
Global Light Vehicle Production by Fuel Type2010Diesel18.92%2020Other Fuels0.45%BEV0.03%Hybrid - Gas0.94%Diesel18.00%EREV0.19%Fuel Cell0.01%Hybrid - Gas4.02%Other Fuels0.45%EREV0.00%Gas79.64%Hybrid - Diesel0.01%2017Diesel18.53%Hybrid - Gas2.69%Fuel Cell0.00%Fuel Cell0.00%Hybrid - Diesel0.31%Gas74.53%BEV2.50%2026Other Fuels0.45%Diesel16.69%EREV0.24%Hybrid - Gas5.39%Fuel Cell0.01%EREV0.17%Gas77.15%Other Fuels0.62%Hybrid - Diesel0.19%Gas72.19%BEV0.82%Hybrid - Diesel0.32%BEV4.54%Source: AutoForecast Solutions – January 201922Data that drives tomorrow.February 2019
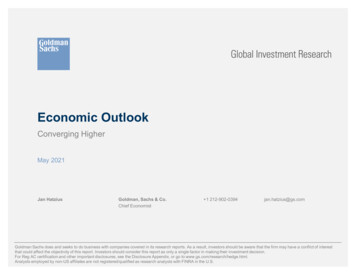
EV Market Sizing12BEV Market OutlookAFS Forecast vs. VM Announced Plans48% 10Millions862026 BEV MarketAFS 4.6 MillionAnnounced Plans 6.4 MillionOptimist View 10.4 MillionVariance toOptimistViewpointVariance toOutlookBattery Price Parity4BEVOptimist Viewpoint180% Start-Up (Plan Variance)25% Legacy (Plan Variance)64Start-Up (AFS Forecast)281Legacy VM (AFS Forecast)Production2Outlook0EVEN AN OPTIMISTIC VIEW REQUIRES NEARLY 90% OFVEHICLES TO HAVE AN ENGINESource: AutoForecast Solutions – January 201923Data that drives tomorrow.February 2019
Electric Platform Production Volume5.04.5VW MEBPlatform4.0Daimler’s EVA 202120222023202420252026Source: AutoForecast Solutions – January 201924Data that drives tomorrow.February 2019
Differing OEM ViewpointsThe ResistanceElectrification Adopters Mazda Renault/Nissan Reluctantly adding EVs and hybrids Rather refine current technologies CIDI gasoline engines Growing diesel volumes Nissan Leaf and NV200 EVs Renault Kangoo, Zoe and Twizy EVs Volkswagen New direction to avoid past diesel issues Creating ID sub-brand to Volkswagen “Electrifying” Audi, Porsche, and Bentley FCA Losing money on each hybrid and EV Marchionne came out said not to buy Fiat 500EVs Recently started adding EV and hybrid programs Most Chinese Manufacturers Adding EVs BAIC, BYD, Changan, Chery, Dongfeng, Geely,Jianghuai, Jiangling, SAIC, Zotye Adding PHEVs BYD, Chery, Dongfeng, FAW, GAC, Geely, SAIC Toyota – Sort of Fully embracing hybrids Avoiding EVs as much as possible China forcing production25Data that drives tomorrow.February 2019
China BEV Market SizingManufacturers Adding BEVs BAIC Motor (10) BAIC-Yinxiang (2) Beijing Benz (4) Beijing Hyundai (1) Beiqi Foton (2) Blue Sky NEV (5) BMW Brilliance (5) Brilliance Jinbei (1) BYD (5) BYD Daimler (1) CH Auto (1) Changan Auto (7) Changan Ford (1) Changan PSA (1) Chehejia (1) Chery (6) Chery-JLR (1) Chongqing Lifan (2) Dongfeng Honda (2) Dongfeng Limited (5) Dongfeng Motors (3) Dongfeng Nanchong (1) Dongfeng PSA (7) Dongfeng PV (1) Dongfeng Yu’an (1) Dongfeng Yueda Kia (1) Dongfeng –Luxgen (1) FAW Car (2)FAW Haima (1)FAW Jiqing (1)FAW Toyota (5)FAW Volkswagen (11)FDG Electric Vehicles (1)Fujian New Longma (1)Future Mobility (3)GAC Changfeng (3)GAC Honda (2)GAC Motor (5)GAC Toyota (6)Geely Group (23)Great Wall Automobile (3)Greenwheel (2)Guojin Auto (3)Haima Zhengzhou (2)Hawtai (2) HK Motors (1)Honda China (2)Hozon Auto (3)Jianghuai (7)Jiangjuai-VW (1) Jiangling Holdings (6)Kandi Electric Vehicles (1)LeapMotors (1)LeEco (1)Link Your (1)Nanjing Iveco (1)NEVS (2)NIO (2)Qoros (2)SAIC Commercial (3)SAIC GM (2)SAIC GM Dongyue (2)SAIC Motor (2)SAIC VW (10)SAIC-GM-Wuling (2)Shanghai Maple (3)Sichuan Auto (3)South-east Automobile (3) Tesla (2)WM Motor (2)Xiapeng (1)Youngman Lotus (1)Youxia (1)Yudo Auto (2)Zotye Auto (3)Zotye-Ford (4)262192026 BEV ModelsRed Entries are OEMSonly producing EVsSome nameplatesbuilt bymore than one OEMData that drives tomorrow.February 2019
Data that drives tomorrow.February 2019
NAFTA (2026)Light Vehicle Platforms containing NAFTA production and at least one other country in ROWGLOBAL PLATFORMSNAFTA 14%GlobalNA A Platforms14.4 MillionNAFTA North AmericaVolumeNAFTA 80%Source: AutoForecast Solutions – January 201928Data that drives tomorrow.February 2019
NAFTA Opportunity/Risk (2026)GLOBAL NAFTA PRODUCTION52.4 MillionNAFTANAFTA Global VolumeROW72%37.6 MillionGLOBAL LESS NA PRODUCTIONNAFTA 43%ROWNAFTA volumeProduced OUTSIDENorth AmericaSource: AutoForecast Solutions – January 201929Data that drives tomorrow.February 2019
30Data that drives tomorrow.February 2019
Disruption: The Fine Line Between Risk and OpportunityBalancing a fickle consumer with an impatient shareholderAll players are jockeying for position in a race with no clear finish lineThe goal is to understand the opportunities,develop a value proposition to defend core operations,and identify areas for growth.31Data that drives tomorrow.February 2019
AutoForecast Solutions (AFS) provides vehicle, powertrain, anddrivetrain production forecasting and advisory services to theglobal automotive industry.AFS ForecastAFS PortfolioGlobal Automotive BusinessIntelligence Solutions & AdvisoryServicesAFS PlanningAFS ScenarioAFS helps our customer Understand the opportunitiesDevelop a value proposition to defend coreoperationsIdentify areas for growth.32Data that drives tomorrow.February 2019
33Data that drives tomorrow.February 2019
Alternative Propulsion ApplicationsA. BAS: Belt Alternator Starter (BAS) or Belt StarterGenerator (BSG)B. Central: Battery Electric Vehicle’s (BEV) tractionmotor in place of a traditional ICEELECTRIFICATION LIGHT VEHICLEPACKAGINGFull HEV25%2026C. Crankshaft: Traction motor mounted on thetransmission side of the crankshaft2020D. ISG: Traction motor mounted on the transmissioninput shaft2018BEV43%30%E. eTrans: Traction motor placed in or on thetransmission housing, acting on the gearset43%3%9% 15%F. eDriveshaft: Traction motor propels the outputshaft or driveshaft via drive chains or gearsG. eAxle (Reduction Gear): Traction motor added to,or integrated with, the differentialH. eAxleDD: Traction motor provides direct drive,attaching directly to the axle(s)I. Hub: Traction motor mounted in wheel hub drivingthe wheel directly34Mild HEV9%PHEV21%eREV2%Source: AutoForecast Solutions – January 2019Data that drives tomorrow.February 2019
The Global Automotive OutlookOpportunity Identification in a Disruptive MarketFebruary 20, 2019Joseph McCabe, President855.734.4590 ext. 1001Data th
Japan 54% EU 10% Korea 14% D3 16% EV 5% Japan European Korea D3 EV Annual Volume 2018 5.3M 2026 4.2M D3 reduce car footprint by 625K Korean OEMs reduce 90K European OEMs gain 120K Japanese OEMs reduce by 490K EV –primarily Tesla –reduce 8K 7 North America: Passenger Car Segment Contribution 2018 Source: AutoForecast Solutions –January 2019. Data that drives