Transcription
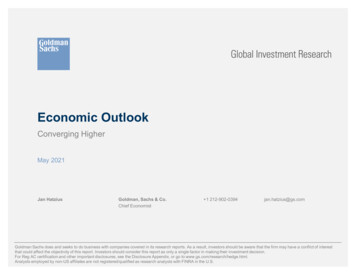
API IndustryOutlookFirst Quarter 2021R. Dean Foreman, Ph.D.March 18, 2021
Key pointsU.S. petroleumdemand18.7 mb/dStrong global economic rebound broadly expected this year and in 2022oLed by emerging markets, 3rd party consensus estimates for global realGDP growth have risen to 4.7% y/y in 2021 and 4.0% y/y in 2022Quarterly increaseQuarterly decrease5-year rangeRevenues 486 BRecord global oil demand growth could stretch supply – EIA projectsrecord two-year demand growth of 5.3 mb/d in 2021 and 3.8 mb/d in 2022 –and new global highs by Q4 2022U.S. refinerythroughput14.4 mb/doOPEC & Russia could redeploy 4.6 mb/d of capacity by Q4 2022 per EIAoThe U.S. could add 3.0 mb/d of liquids production for a record-high of 20.8mb/d by Q4 2022 per EIANatural gas – Strong productivity helped sustain production despitehistorically low drilling activityoU.S. solid (regionally disparate) winter demand; record natural gas exportsoNatural gas remains integral to planned U.S. power generation capacityadditions, but global coal-fired power additions could outpace itU.S. oil & gasproduction31.2 mb/doeU.S. drillingactivity311 rigsCapitalexpenditures 42 BQ4 2020 averagesBrent 44.62/bblWTI 42.57/bblNGL composite 5.19/mmBtuHenry Hub 2.48/mmBtu Financial compilation based on API 200 companies with shares listed onU.S. stock exchanges.sources: EIA; API Monthly Statistical Report; Bloomberg and companyreports; Baker Hughes; API Team analysisNetincome (15) B
Industry capital expenditures remained historically low in Q4 2020, and thebacklog of U.S. projects under construction has fallen by 50 billion y/yThe industry invested 42.1 billion in Q4 2020, compared with 70.5 billion in the same quarter one year agoAcross the energy value chain, API is monitoring 77 oil & gas-related projects currently under construction worth 194 billionCapital expenditures by industry segment 194 billion in current U.S. energyinfrastructure investmentsBillion dollars (2021 )140120Downstream and PetrochemcialEquipment & ServicesUpstream194 billionMidstreamGlobal integratedin estimated industry projectsunder construction (February 2021,7 LNG 84 B100down from 344 billion in Q1 2020)8023PetChem 69 B6017 Refineryexpansions 18 B21Pipelines 23 B4020020089 Gasstorage 119 M20112014* All other oil & gas industry companiessources: Bloomberg; publicly-available company reports; BLS20172020sources: S&P Market Intelligence; Oil &Gas Journal; American Chemistry Council;API Team calculations as of Feb. 2021
GlobalEconomy
Global real GDP outlookReal GDP growth (percentage points, year-on-year)WorldOECDNon-OECD63rdLed by emerging markets,party consensus estimates arefor global real GDP growth of 4.7% y/y in 2021 and 4.0% y/yin 20223Avg.2000-20200-3-62019Russia / Caspian50China-5Middle East 10Europe550-5U.S.0-5AfricaLatin America& Caribbean50-550-550-5sources: IMF; Bloomberg50Dev. APex-China1050-5* Market exchange rate basis202020212022Every region is expected to grow in 2021and 2022, but China and the rest ofDeveloping Asia Pacific economies haveremained on a greater scale with relativelymild 2020 recessions and strong resumedgrowthChina could overtake the U.S. as theworld’s largest economy by 2028 perBloomberg
Recent U.S. dollar depreciation has correlated with increased oil pricesGlobal oil prices have historically been inversely correlated with the U.S. dollar’s broad foreign exchange valueThree quarters after the onset of the Great Financial Crisis in 2008, the U.S. dollar appreciated, and oil prices fell. Bycontrast with the 2020 COVID-19 recession, the U.S. dollar depreciated, and oil prices roseTwo perspectives on Brent crude oil spot prices and the U.S. dollar’s foreign exchange valueIndex (Jan 2006 100)130Dollars per barrel (2021 )160FRB broad nominal dollar indexReal Brent crude oil spot 4201620182020Dollars per barrel (2021 )175Q2 2008150125100Q1 2009Q1 2021754050202500Q2 202080859095 100 105 110 115 120Nominal dollar broad index (Jan. 2006 100)sources: Federal Reserve Board; Bloomberg; U.S. Bureau of Labor Statistics125
What we’re watching nowAlthough uncertainties on the path of global recovery remain, natural gas and oil demand is generally expected to be led byemerging markets. Central Bank Digital Currencies may present a credible threat to the U.S. dollar’s global statusGlobal economy on firmer ground,but with divergent recoveries amidhigh uncertaintyReady, steady, go? Results of the 3rd Improved outlook. Upgraded 2021 and 2022GDP forecasts by 0.8% and 0.2%, respectively Central banks collectively representing a fifth ofthe world’s population are likely to issue a centralbank digital currency (CBDC) in the next threeyears --- a transparent and stable version ofblockchain-based cryptocurrency The global oil market “changes dramatically inthe latter half of this year as nearly 2 mb/d ofextra supply may be required to meet expecteddemand growth - even after factoring in theannounced ramp-up of OPEC production” In emerging market and developing economies,financial inclusion and payments efficiencyobjectives motivate the shift towards CBDCsIEA upgraded its world oil demand growthprojection to 5.7 mb/d in 2021 due to “robustprompt indicators” Divergent impacts. Disproportionate losses incountries reliant on tourism, commodity exportsand those with “limited policy space to respond” High uncertainty remains with the health crisis Policy priorities vary by country but generallyshould boost productive capacity, foster efficientresource allocations, and scale back gradually(“avoid sudden cliffs”)BIS survey on central bank digital currency IEA expects flat U.S. oil production in 2021International Energy Agency, April 2021C. Boar and A. Wehrli, Bank of International Settlements, Jan. 2021International Monetary Fund, April 2021Oil Market Report, April 2021
Oil Markets
Global oil demand recovery in 2021 and 2022 could become the largest twoyear increase on record since 1950EIA projects global oil demand was 96.7 mb/d in February - within 1.0% of its February 2020 level of 97.7 mb/d – and could rise by a total of 9.1mb/d this and next year (5.3 mb/d in 2021 and 3.8 mb/d in 2022)Global oil demandMillion barrels per day120EIA estimatesDouble-dip recession,front-wheel drive andCAFE standards(1980-1982)1008020222021Great FinancialCrisis rket exchange rate basissources: IEA; EIA; Bloomberg197019801990Real GDP (Trillion 2010 )200020102020
Global oil demand could set a new record-high by the end of 2022 per EIAEIA projects global oil demand of 102.4 mb/d in Q4 2022, with similar increases (Q1 2021 to Q4 2022) by developed ( 3.4 mb/d) and emergingeconomies ( 3.9 mb/d)For global supply by Q4 2022, EIA projects OPEC and Russian & Caspian producers to redeploy 4.7 mb/d of spare capacity, while U.S. productioncould rise by 1.7 mb/d by Q4 2021 and add another 1.4 mb/d to reach a new high for U.S. liquids production of 20.8 mb/d in Q4 2022Global oil demandEIAestimatesMillion barrels per day100Non-OECD75Global oil supplyEIAestimatesMillion barrels per day100Russia & Caspian75(Emerging economies)OPEC5050United States2525OECD(Developed economies)Other Non-OPEC0020162017201820192020202120222016source: EIA STEO (March 2021)201720182019202020212022
Strong sustained U.S. oil well productivity has kept downward pressureon estimated breakeven pricesEIA reported solid well productivity even as companies have begun to re-deploy rigs and crews that were idledBTU Analytics estimated breakeven prices were below recent market prices among major U.S. oil producing basinsU.S. oil well productivity – new production per rigMillion barrels per day oil-equivalent4BakkenEagle Ford3Oil estimated breakeven prices*0PermianDJ NiobraraBakkenDollars per barrel ( /Bbl.)204060WTI month-aheadFeb. 2021Feb. 2020futures priceMar. 16, 2021Eagle Ford - WestEagle Ford - East2DJ Niobrara1Permian - Delaware0Permian - Midland201620172018source: EIA Drilling Productivity Report201920202021*Half cycle breakevens assuming 10% discount factor. sources: BTU Analytics; CME Group
EIA projects U.S. liquid fuels consumption could return to its 2019 levels bythe second half of 2021Indicators of industrial and chemical production, daily flights and mobility statistics, and vehicle miles traveled tracking show broad recovery fromQ2 2020 lows, but ongoing year-on-year declines as of Q1 2021EIA projects Q2 2021 total consumption for refined products to reach that of pre-COVID levels, with the strongest recoveries in motor and jet fuelsRefined product key U.S. demand indicators, As of March 2021 YoYU.S. liquid fuel consumption by fuelMillion barrels per day25EIA estimates20Passenger VMTTruck VMTTotal Flights-10% 6% -13% 20%Apple MobilityDAT Spot LoadsOther (naphtha/gasoil; HGLs)ManufacturingTSA PassengersResidual fuel oil15Jet fuelDistillates/diesel fuel10Chemicals 5% 72% -56% 3%5Motor gasoline0source: U.S. Federal Highway Administration; FlightRadar24; ISM PMI; ACC; TSA; Apple; DAT2016sources: EIA; API MSR201820202022
U.S. refinery capacity utilization could recover gradually, but U.S. crude oiltrade is projected to revert to net imports in Q2 2021 per EIAEIA expects refinery capacity, domestic demand and refined product exports to re-strengthen over the next year, but lower U.S. drilling andproduction could set back U.S. crude oil exportsU.S. liquid fuel consumption and refinery throughputMillion barrels per day25Refinery crudedistillation unitcapacity utilizationrate%EIA estimates 1002075505Million barrels per day6EIA estimatesRefined products42Net exports01510U.S. petroleum net tradeU.S. liquid fuelTotalU.S. liquid fuelconsumptionconsumptionTotal petroleum-2-425-6-800201620172018sources: EIA; API MSR2019Net imports202020212022Crude oil-1020162017sources: EIA; API MSR20182019202020212022
Natural Gas
Natural gas market recovery in Asia Pacific and Europe has keyed record tradeand U.S. liquefied natural gas (LNG) exportsAsia and Europe have consistently led in LNG imports, while the U.S. has emerged as an exporter with new infrastructureFollowing weakness in mid-2020, robust global growth LNG trade and record U.S. exports appeared in Q1 2021DutchTTFUK NBPJapanKoreaMarkerHenry HubRegional gas hub pricingGlobal LNG trade by region 2021 per mmBtu, monthlyUK Benchmark (NBP)16Dutch Benchmark (TTF)14Asian Benchmark (JKM)Henry Hub12Billion cubic meters600Asia PacificLatin AmMiddle EastImports20006Exports8North Am400Q1 Asian cold snap10Europe-2004-40020-60020162017sources: Bloomberg; Quandl; EIA20182019202020212016201720182019sources: API Team analysis; BP; IEA; ICIS; EIA20202021
Recent natural gas futures prices have exceeded estimated breakevenprices among top producing regionsDedicated drilling for dry gas sustained solid productivity gains per EIAEstimated natural gas breakeven prices moved in different directions by producing region but generally remained belowrecent natural gas futures pricesNatural gas well productivity –production per rigNatural gas estimated breakeven pricesDollars per million Btu (mmBtu)0123Million cubic feet per day nat. gas-equivalent35Haynesville3025Feb 2021Feb. 2020Appalachia20Appalachia - Northeast PA15Haynesville10Appalachia - Southwest PA5Henry Hub month-0Appalachia - Ohio2016201720182019source: EIA Drilling Productivity Report20202021*Half cycle breakevens assuming 10%discount factor and play-specific costssources: BTU Analytics; CME Groupahead futures priceMar. 16, 2021
U.S. natural gas exports could grow while supply and demand recede from 2019highs per EIA, despite cold winter seasonalityQ1 2021 brought a polar vortex and polarizing effects on gas demand for power by region, with large gains/losses as power competed with other fuelsCOVID-driven 2020 declines in demand and dry gas production could be extend into 2021 before broadly recovering per EIAU.S. power sector gas consumptionYear-to-date through March 1st, y/y%Northwest-3.8%SWP-21.5%CAISO 4.2%Southwest-23.2%ISO-NE 9.7%U.S. natural gas consumption and productionby sector, Trillion cubic feetproductionISO-NY 17.3%30MISO-20.5%PJM 4.2%EIA estimates40 Dry natural gasNet ExportsElectricPower20IndustrialERCOT 2.7%Southeast-9.8%10Res /Comm0sources: EIA Hourly Grid Monitor; FERC20202021sources: EIA AEO 2021202220232024
While the U.S. is poised to add 190 GW of gas and renewable power through2024, global coal capacity is expected to increase by over 200 GWNatural gas has remained competitive in the mix of U.S. electricity capacity additions with a 30% share through 2024By comparison, 209 GW of added coal capacity could come online by 2024 in emerging per the Global Energy Monitor estimatesGlobal coal capacity additions vs. U.S. net generation capacity alNatural GasWind & SolarOtherAdditionsGlobal coal additions by 2024 209 GW0U.S. natural gas and renewables-20Retirements-4020202021sources: Global Energy Monitor; IEA WEO 2020; EIA AEO 2021Projects listed as under construction or permitted202220232024 190 GW
API economics resources available at www.api.org
Across the energy value chain, API is monitoring 77 oil & gas-related projects currently under construction worth 194 billion Capital expenditures by industry segment * All other oil & gas industry companies sources: Bloomberg; publicly-available company reports; BLS Billion dollars (2021 ) in estimated industry projects under construction (February 2021, down from 344 billion in Q1 2020 .
![API Ballot: [Ballot ID] – API 510 & API 570, Deferrals, Rev05](/img/5/api510andapi570deferralsrev5.jpg)