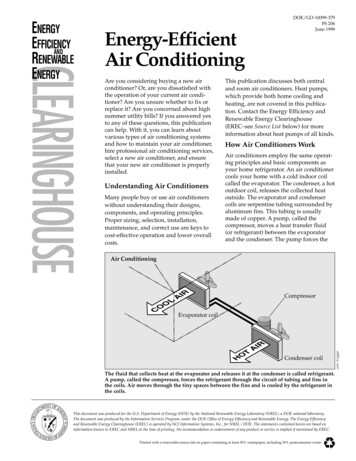
Transcription
BP Energy Outlook2018 editionMark FinleyGeneral Manager BP p.l.c. 2018
Alternative scenariosCarbon emissionsPrimary energy consumption by fuelBillion toe20Billion tonnes s15Oil10501970 1980 1990 2000 2010 2020 2030 204002016 ETICE Less RE FTban gas pushswitchEvolving transition (ET)Internal combustion engine ban (ICE ban)Less gas switchingRenewables push (RE push)Faster transition (FT)Even faster transition (EFT)EFT2 BP p.l.c. 2018
Three windows on the energy transitionPrimary energy demandEnd-use sectorBillion ldingsOtherAfricaOther ydroNuclearCoalGasOil BP p.l.c. 2018
Regional energy demandPrimary energy consumption by regionPrimary energy growth and regionalcontributions% per annumBillion toe2015103.0%OtherAfricaOther 970 1980 1990 2000 2010 2020 2030 20402000-2010 2010-2020 2020-2030 2030-20404 BP p.l.c. 2018
Three windows on the energy transitionPrimary energy demandEnd-use sectorBillion ldingsOtherAfricaOther ydroNuclearCoalGasOil BP p.l.c. 2018
Global energy by fuelPrimary energy consumption by fuelShares of primary energyBillion CoalHydroGasNuclearRenewables30%20%510%0%01970 1980 1990 2000 2010 2020 2030 20401970 1980 1990 2000 2010 2020 2030 20406 BP p.l.c. 2018
Diversified fuel mixShares of primary 201940196019807200020202040 BP p.l.c. 2018
Five key questions What have we learnt about electric cars and the mobility revolution? When is global oil demand likely to stop growing? Just how fast will renewable energy grow? How resilient is the outlook for natural gas? Is the transition to a lower carbon energy system happening fast enough?8 BP p.l.c. 2018
Five key questions What have we learnt about electric cars and the mobility revolution? When is global oil demand likely to stop growing? Just how fast will renewable energy grow? How resilient is the outlook for natural gas? Is the transition to a lower carbon energy system happening fast enough?9 BP p.l.c. 2018
Electric cars, shared mobility and autonomyCar kilometres by fuel typeNew mobility share of VkmTrillion km40Electricity35Gas30Liquids40%Private - autonomousShared - autonomousShared - human 020161020202025203020352040 BP p.l.c. 2018
Liquid fuel demand from passenger carsChanges in liquids demand from cars: 2016-2040Mb/dSwitch to EVs45402.5Other gains in fuel wth inTightening in vehicledemand for travel efficiency standards11Shared mobilityEVs2040 BP p.l.c. 2018
Global ban on internal-combustion engine (ICE) carsShareElectric car salesas a share of total car salesShareShare of total passenger Vkmpowered by electricity100%100%Evolving transitionEvolving transition80%80%ICE CE ban201612202020302040 BP p.l.c. 2018
Impact of ICE banCarbon emissions from energyPassenger cars liquids demandMb/dBillion tonnes CO224Evolving transition4020ICE ban353016251220Evolving transition158Even faster transition1040520162016Evolving transition204001990ICE ban1320002010202020302040 BP p.l.c. 2018
Impact of ICE banCarbon emissions from energyPassenger cars liquids demandMb/dBillion tonnes CO224Evolving transition4020ICE ban353016251220Evolving transitionICE banEven faster transition1581040520162016Evolving transition204001990ICE ban1420002010202020302040 BP p.l.c. 2018
Five key questions What have we learnt about electric cars and the mobility revolution? When is global oil demand likely to stop growing? Just how fast will renewable energy grow? How resilient is the outlook for natural gas? Is the transition to a lower carbon energy system happening fast enough?15 BP p.l.c. 2018
Demand for oil and other liquid fuelsLiquids demandLiquids demand growthMb/dMb/d, average annual 002010202020302005- 2010- 2015- 2020- 2025- 2030- 20352010 2015 2020 2025 2030 2035 2040204016 BP p.l.c. 2018
Demand for oil and other liquid fuelsLiquids demandMb/d1201008060Evolving transitionICE ban40Faster transition2001970Even faster transition198019902000201017202020302040 BP p.l.c. 2018
Demand for oil and other liquid fuelsLiquids demandMb/d1201008060Evolving transitionICE banFaster transitionEven faster transitionSupply with no investment(3% decline rate)402001970198019902000201018202020302040 BP p.l.c. 2018
US tight oil: alternative scenariosUS tight oil productionNumber of US oil rigs(in the four main producing 20302035020102040192015202020252030*Permian, Eagle Ford, Bakken and Niobrara20352040 BP p.l.c. 2018
US tight oil: alternative scenariosUS tight oil productionNumber of US oil rigs(in the four main producing 1060086400Early peak4Early 5020102040202015202020252030*Permian, Eagle Ford, Bakken and Niobrara20352040 BP p.l.c. 2018
US tight oil: alternative scenariosUS tight oil productionNumber of US oil rigs(in the four main producing regions*)Mb/d181200Greater resource16Greater ly peak4Early 5020102040212015202020252030*Permian, Eagle Ford, Bakken and Niobrara20352040 BP p.l.c. 2018
Five key questions What have we learnt about electric cars and the mobility revolution? When is global oil demand likely to stop growing? Just how fast will renewable energy grow? How resilient is the outlook for natural gas? Is the transition to a lower carbon energy system happening fast enough?22 BP p.l.c. 2018
Rapid growth in renewable energyPace of power market penetrationGrowth of renewable powerTWh, average annual growthLargest gains in market share over 25 years, 200%02000-20162016-20302030-204023 BP p.l.c. 2018
‘Renewables push’ scenarioRenewables share of power nRenewablespush24 BP p.l.c. 2018
‘Renewables push’ scenarioRenewables share of power growth2016-2040Change in carbon intensity of ition25RenewablespushEvenfastertransition BP p.l.c. 2018
Five key questions What have we learnt about electric cars and the mobility revolution? When is global oil demand likely to stop growing? Just how fast will renewable energy grow? How resilient is the outlook for natural gas? Is the transition to a lower carbon energy system happening fast enough?26 BP p.l.c. 2018
Growth in natural gas demandGas consumption by regionGas consumption by sectorBcf/d700600Bcf/dN AmericaChinaMiddle EastAfrica700EuropeIndia & Other 040272040 BP p.l.c. 2018
Possible risks to the outlook for natural gasGas demand increase2016-2040Billion nLess gasswitch28 BP p.l.c. 2018
Possible risks to the outlook for natural gasGas demand growth2016-2040Gas demand increase2016-2040% per annum-1%Billion 0%1%2%Evolvingtransition1.5Less gas switchSwitching1.0Renewables push0.5Faster transitionOthereffectsEven fastertransition0.0EvolvingtransitionLess gasswitch29 BP p.l.c. 2018
LNG continues to growLNG exportsLNG importsBcf/dBcf/d807060504080Middle EastN 0100199020002010ChinaOther AsiaIndiaOECD 2040 BP p.l.c. 2018
Five key questions What have we learnt about electric cars and the mobility revolution? When is global oil demand likely to stop growing? Just how fast will renewable energy grow? How resilient is the outlook for natural gas? Is the transition to a lower carbon energy system happening fast enough?31 BP p.l.c. 2018
Carbon emissions continue to rise in the ET scenarioCarbon emissionsBillion tonnes CO2Carbon emissions in 2040:EFT versus ET scenarioBillion tonnes CO2404030302020EnergyintensityCCUSPowerEvolving transition10Fuelswitching10Faster transitionOthersectorsEven faster transition001970 1980 1990 2000 2010 2020 2030 2040Evolvingtransition32Even fastertransition BP p.l.c. 2018
Impact of faster transition on global energy systemReductions in carbon emissions:EFT versus ET scenarioPrimary energy consumption underdifferent scenariosBillion tonnes CO2 in 2040024Billion GasOilIndustry &Buildings5Transport0201633ETFTEFT BP p.l.c. 2018
Conclusion Some aspects of energy transition seem relatively likely: global energy demand continues to grow – driven by increasingprosperity slower growth as we learn to do more with less increasing abundance and diversification of energy supplies renewable energy growing in importance oil and gas continue to play a central role in the global energy system Other aspects remain far more uncertain: impact of EVs and autonomy in reshaping transport sector role of natural gas and renewables in lower carbon transition how will we achieve a more decisive break from past to achievesharp fall in carbon emissions?34 BP p.l.c. 2018
BP Energy Outlook2018 editionMark FinleyGeneral manager BP p.l.c. 2018
The role of US in global energy marketsUS shares of global productionRegional oil/gas imbalancesBillion toe50%40%43RenewablesUSS & C AmericaAfricaAsiaOther NMiddle timporters-30%1990-420002010* Includes crude and NGLs202020301970 1980 1990 2000 2010 2020 2030 20402040362018 BP Energy Outlook BP p.l.c. 2018
EFT versus ET scenario Impact of faster transition on global energy system Billion toe 0 5 10 15 20 2016 ET FT EFT Renew. Hydro Nuclear Coal Gas Oil 2040