Transcription
TQMP 2015 vol. 11 no. 1Hierarchical Cluster Analysis:Comparison of Three Linkage Measures andApplication to Psychological DataOdilia Yim , a, Kylee T. Ramdeen a, b, cSchool of Psychology, University of OttawaLaboratoire de Psychologie et Neurocognition, Université de Savoiec Centre National de la Recherche Scientifique, Laboratoire de Psychologie et Neurocognition, Unité Mixte de Recherche 5105,Grenoble, FranceabAbstract Cluster analysis refers to a class of data reduction methods used for sorting cases, observations, or variables of a givendataset into homogeneous groups that differ from each other. The present paper focuses on hierarchical agglomerative clusteranalysis, a statistical technique where groups are sequentially created by systematically merging similar clusters together, asdictated by the distance and linkage measures chosen by the researcher. Specific distance and linkage measures are reviewed,including a discussion of how these choices can influence the clustering process by comparing three common linkage measures(single linkage, complete linkage, average linkage). The tutorial guides researchers in performing a hierarchical cluster analysisusing the SPSS statistical software. Through an example, we demonstrate how cluster analysis can be used to detect meaningfulsubgroups in a sample of bilinguals by examining various language variables.Keywords Cluster analysis; Hierarchical cluster analysis; Agglomerative, linkage; SPSS odilia.yim@uottawa.caIntroductionIn everyday life, we try to sort similar items togetherand classify them into different groups, a natural andfundamental way of creating order among chaos.Among many scientific disciplines, it is also essential touncover similarities within data to constructmeaningful groups. The purpose of cluster analysis isto discover a system of organizing observations wheremembers of the group share specific properties incommon. Cluster analysis is a class of techniques thatclassifies cases into groups that are relativelyhomogeneous within themselves and relativelyheterogeneous between each other (Landau & ChisSter, 2010; Norusis, 2010). Cluster analysis has a simplegoal of grouping cases into homogeneous clusters, yetthe choice in algorithms and measures that dictates thesuccessive merging of similar cases into differentclusters makes it a complex process. Although anappealing technique, cluster solutions can be easilymisinterpreted if the researcher does not fullyunderstand the procedures of cluster analysis. Mostimportantly, one must keep in mind that cases willalways be grouped into clusters regardless of the truenature of the data. Therefore, the present paper aims toprovide researchers a background to hierarchicalcluster analysis and a tutorial in SPSS using an examplefrom psychology.Cluster analysis is a type of data reductiontechnique. Data reduction analyses, which also includefactor analysis and discriminant analysis, essentiallyreduce data. They do not analyze group differencesbased on independent and dependent variables. Forexample, factor analysis reduces the number of factorsor variables within a model and discriminant analysisclassifies new cases into groups that have beenpreviously identified based on specific criteria. Clusteranalysis is unique among these techniques because itsgoal is to reduce the number of cases or observations1by classifying them into homogeneous clusters,identifying groups without previously knowing groupmembership or the number of possible groups. Clusteranalysis also allows for many options regarding thealgorithm for combining groups, with each choice1 The present paper focuses only on the grouping of cases orobservations, but cluster analysis can also be used to reducethe number of variables in a dataset.The Quantitative Methods for Psychology8
TQMP 2015 vol. 11 no. 1resulting in a different grouping structure. Therefore,cluster analysis can be a convenient statistical tool forexploring underlying structures in various kinds ofdatasets.Cluster analysis was initially used within thedisciplines of biology and ecology (Sokal & Sneath,1963). Although this technique has been employed inthe social sciences, it has not gained the samewidespread popularity as in the natural sciences. Ageneral interest in cluster analysis increased in the1960s, resulting in the development of several newalgorithms that expanded possibilities of analysis. Itwas during this period that researchers began utilizingvarious innovative tools in their statistical analyses touncover underlying structures in datasets. Within adecade, the growth of cluster analysis and itsalgorithms reached a high point. By the 1970s, thefocus shifted to integrating multiple algorithms to forma cohesive clustering protocol (Wilmink &Uytterschaut, 1984). In recent decades, there has beena gradual incorporation of cluster analysis into otherareas, such as the health and social sciences. However,the use of cluster analysis within the field of psychologycontinues to be infrequent (Borgen & Barnett, 1987).The general technique of cluster analysis will first bedescribed to provide a framework for understandinghierarchical cluster analysis, a specific type ofclustering. The multiple parameters that must bespecified prior to performing hierarchical clusteringwill be examined in detail. A particular focus will beplaced on the relative impact of three common linkagemeasures. The second part of this paper will illustratehow to perform a hierarchical cluster analysis in SPSSby applying the technique to differentiate subgroupswithin a group of bilinguals. This paper will discuss thestatistical implications of hierarchical clustering andhow to select the appropriate parameters in SPSS toallow researchers to uncover the grouping structurethat most accurately describes their multivariatedataset.Hierarchical Cluster AnalysisDue to the scarcity of psychological research employingthe general technique of cluster analysis, researchersmay not fully understand the utility of cluster analysisand the application of the clustering technique to theirdata. There are two main methods: hierarchical stering combines cases into homogeneous clustersby merging them together one at a time in a series ofsequential steps (Blei & Lafferty, 2009). Nonhierarchical techniques (e.g., k-means clustering) firstestablish an initial set of cluster means and then assigneach case to the closest cluster mean (Morissette &Chartier, 2013). The present paper focuses onhierarchical clustering, though both clustering methodshave the same goal of increasing within-grouphomogeneity and between-groups heterogeneity. Ateach step in the hierarchical procedure, either a newcluster is formed or one case joins a previously groupedcluster. Each step is irreversible meaning that casescannot be subsequently reassigned to a differentcluster. This makes the initial clustering steps highlyinfluential because the first clusters generated will becompared to all of the remaining cases. The alternatemethod of non-hierarchical clustering requires theresearcher to establish a priori the number of clustersin the final solution. If there is uncertainty about thetotal number of clusters in the dataset, the analysismust be re-run for each possible solution. In thissituation, hierarchical clustering is preferred as itinherently allows one to compare the clustering resultwith an increasing number of clusters; no decisionabout the final number of clusters needs to be made apriori.Hierarchical cluster analysis can be conceptualizedas being agglomerative or divisive. Agglomerativehierarchical clustering separates each case into its ownindividual cluster in the first step so that the initialnumber of clusters equals the total number of cases(Norusis, 2010). At successive steps, similar cases–orclusters–are merged together (as described above)until every case is grouped into one single cluster.Divisive hierarchical clustering works in the reversemanner with every case starting in one large clusterand gradually being separated into groups of clustersuntil each case is in an individual cluster. This lattertechnique, divisive clustering, is rarely utilized becauseof its heavy computational load (for a discussion ondivisive methods, see Wilmink & Uytterschaut, 1984).The focus of the present paper is on the method ofhierarchical agglomerative cluster analysis and thismethod is defined by two choices: the measurement ofdistance between cases and the type of linkage betweenclusters (Bratchell, 1989).Distance MeasureThe definition of cluster analysis states it is a techniqueused for the identification of homogeneous subgroups.Therefore, cluster analysis is inherently linked to theThe Quantitative Methods for Psychology9
TQMP 2015 vol. 11 no. 1concept of similarity. The first step a researcher musttake is to determine the statistic that will be used tocalculate the distance or similarity between cases. Bothmeasures may be thought to mirror one another; as thedistance between two cases decreases, their similarityshould respectively increase. However, an importantdistinction must be made: whereas both measuresreflect the pattern of scores of the chosen variables,only the distance measure takes into account theelevation of those scores (Clatworthy, Buick, Hankins,Weinman, & Horne, 2005). For example, if we wish toseparate bilinguals who switch between their twolanguages frequently from those who do not switchlanguages often, the difference in the actual scores onmultiple language measures must be taken intoaccount. In this case, a distance measure must beselected. However, if we wish to assess the efficacy of alanguage intervention program, then the actuallanguage scores may not be of importance. In this case,we would be assessing the pattern of language scoresover time (i.e. from before to after intervention) toidentify the clusters of people that improved, worsened,or did not change their language skills afterintervention. In this situation, a similarity measure suchas the Pearson correlation, would be sufficient to assessthe pattern of scores before and after interventionwhile ignoring the raw language scores. An addeddifficulty of using a correlation coefficient is that it iseasy to interpret when there are only one or twovariables, but as the number of variables increases theinterpretation becomes unclear. It is for these reasonsthat distance measures are more commonly used incluster analysis because they allow for an assessment ofboth the pattern and elevation of the scores in question.Of course, there is not only one statistic that can beused as a distance measure in cluster analysis. Thechoice of the distance measure will depend primarilyon whether the variables are continuous ordichotomous in nature. Many chapters on clusteranalysis simply overlook this question and discussmeasures applicable to continuous variables only.Although this paper will focus on applying clusteranalysis to continuous data, it is important to note thatat least four measures exist for calculating distancewith dichotomous data (see Finch, 2005).The most commonly used distance measure forcontinuous variables is the squared Euclidean distance,. In the equation, a and b refer to thetwo cases being compared on the j variable, where k isthe total number of variables included in the analysis(Blei & Lafferty, 2009). This algorithm allows for thedistance between two cases to be calculated across allvariables and reflected in a single distance value. Ateach step in the procedure, the squared Euclideandistance between all pairs of cases and clusters iscalculated and shown in a proximity matrix (discussedbelow). At each step, the pair of cases or clusters withthe smallest squared Euclidean distance will be joinedwith one another. This makes hierarchical clustering alengthy process because after each step, the fullproximity matrix must once again be recalculated totake into account the recently joined cluster. Thesquared Euclidean distance calculation is straightforward when there is only one case per cluster.However, an additional decision must be made as tohow best to calculate the squared Euclidean distancewhen there is more than one case per cluster. This isreferred to as the linkage measure and the researchermust determine how to best calculate the link betweentwo clusters.Linkage MeasureThe problem that arises when a cluster contains morethan one case is that the squared Euclidean distancecan only be calculated between a pair of scores at atime and cannot take into account three or more scoressimultaneously. In line with the proximity matrix, thegoal is still to calculate the difference in scores betweenpairs of clusters, however in this case the clusters donot contain one single value per variable. This suggeststhat one must find the best way to calculate an accuratedistance measure between pairs of clusters for eachvariable when one or both of the clusters contains morethan one case. Once again, the goal is to find the twoclusters that are nearest to each other in order to mergethem together. There exist many different linkagemeasures that define the distance between pairs ofclusters in their own way. Some measures define thedistance between two clusters based on the smallest orlargest distance that can be found between pairs ofcases (single and complete linkage, respectively) inwhich each case is from a different cluster (Mazzocchi,2008). Average linkage averages all distance valuesbetween pairs of cases from different clusters. Singlelinkage, complete linkage, and average linkage will eachbe fully detailed in turn.Single linkage. Also referred to as nearest neighbour orminimum method. This measure defines the distancebetween two clusters as the minimum distance foundbetween one case from the first cluster and one caseThe Quantitative Methods for Psychology10
TQMP 2015 vol. 11 no. 1from the second cluster (Florek, Lukaszewiez, Perkal,Steinhaus, & Zubrzchi, 1951; Sneath, 1957). Forexample, if cluster 1 contains cases a and b, and cluster2 contains cases c, d, and e, then the distance betweencluster 1 and cluster 2 would be the smallest distancefound between the following pairs of cases: (a, c), (a, d),(a, e), (b, c), (b, d), and (b, e). A concern of using singlelinkage is that it can sometimes produce chainingamongst the clusters. This means that several clustersmay be joined together simply because one of theircases is within close proximity of case from a separatecluster. This problem is specific to single linkage due tothe fact that the smallest distance between pairs is theonly value taken into consideration. Because the ersible, this chaining effect can have disastrouseffects on the cluster solution.Complete linkage. Also referred to as furthest neighbouror maximum method. This measure is similar to thesingle linkage measure described above, but instead ofsearching for the minimum distance between pairs ofcases, it considers the furthest distance between pairsof cases (Sokal & Michener, 1958). Although this solvesthe problem of chaining, it creates another problem.Imagine that in the above example cases a, b, c, and dare within close proximity to one another based uponthe pre-established set of variables; however, if case ediffers considerably from the rest, then cluster 1 andcluster 2 may no longer be joined together because ofthe difference in scores between (a, e) and (b, e). Incomplete linkage, outlying cases prevent close clustersto merge together because the measure of the furthestneighbour exacerbates the effects of outlying data.Average linkage. Also referred to as the UnweightedPair-Group Method using Arithmetic averages(UPGMA)2. To overcome the limitations of single andcomplete linkage, Sokal and Michener (1958) proposedtaking an average of the distance values between pairsof cases. This method is supposed to represent anatural compromise between the linkage measures toprovide a more accurate evaluation of the distancebetween clusters. For average linkage, the distancesbetween each case in the first cluster and every case inthe second cluster are calculated and then averaged.2 The average linkage presented here is referred to as averagelinkage between groups in SPSS and other resources. It shouldnot be confused with an alternate method, average linkagewithin groups, which takes into account the variability foundwithin each cluster. For a contrast between linkage measures,see Everitt, Landau, Leese, and Stahl (2011).This means that in the previous example, the distancebetween cluster 1 and cluster 2 would be the average ofall distances between the pairs of cases listed above: (a,c), (a, d), (a, e), (b, c), (b, d), and (b, e). Incorporatinginformation about the variance of the distances rendersthe average distance value a more accurate reflection ofthe distance between two clusters of cases.Each linkage measure defines the distance betweentwo clusters in a unique way. The selected linkagemeasure will have a direct impact on the clusteringprocedure and the way in which clusters are mergedtogether (Mazzocchi, 2008). This will subsequentlyimpact the final cluster solution. In the next section, ahierarchical cluster analysis will be performed on apreviously published dataset using SPSS.SPSS Tutorial on Hierarchical Cluster AnalysisThe following tutorial will outline a step-by-stepprocess to perform a hierarchical cluster analysis usingSPSS statistical software (version 21.0) and how tointerpret the subsequent analysis results. The researchdata in the following example was part of a largerresearch dataset from Yim and Bialystok (2012) whichexamined bilinguals and their language use. Thepresent example includes 67 Cantonese-Englishbilingual young adults. The participants completedlanguage proficiency tests in both languages andquestionnaires regarding their daily language use.Participants had to indicate how often they use bothEnglish and Cantonese daily (“I use English andCantonese daily”) on a scale from 0 (none of the time)to 100 (all of the time). Language proficiency wasassessed using the Peabody Picture Vocabulary Test-III(PPVT-III; Dunn & Dunn, 1997) in both Cantonese andEnglish, measuring receptive vocabulary. This samplewas chosen because it is an apt example to demonstratethe applicability of cluster analysis on psychologicaldata. Bilinguals are loosely defined as individuals whoregularly use two (or more) languages, yet many issuesremain in the research field; for example, there is stillno consensus as to what criteria determine thatsomeone is bilingual (Grosjean, 1998). High proficiencybilinguals are often viewed as a homogenouspopulation; however, there can be within-groupdifferences in language usage and language proficiency.The goal of a hierarchical cluster analysis on this data isto examine possible subgroups in a sample of highlyproficient bilinguals.33To practice with a dataset, please contact the correspondingThe Quantitative Methods for Psychology11
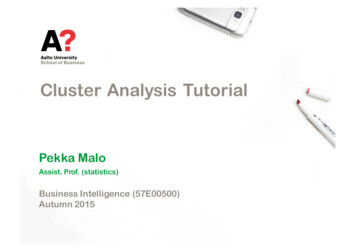
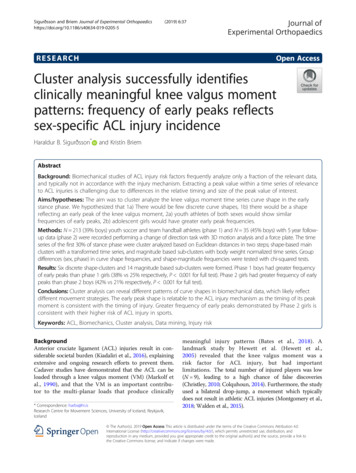
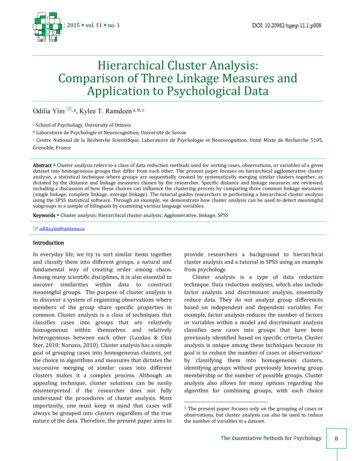
TQMP 2015 vol. 11 no. 1Figure 1 Running a hierarchical cluster analysis.Step 1: Choosing Cluster VariablesThe researcher first has to identify the variables thatwill be included for analysis. Any number of variablescan be included, but it is best to include variables thatare meaningful to the research question. In thisexample, we use three variables for the cluster analysis:bilinguals’ proficiency scores in both languages andtheir self-report of their daily use of both languages.These three variables target proficiency and daily use,two dimensions commonly used to assess bilingualism.The variables included in this example are allcontinuous variables.been moved into the Variables box. There is also anoption to label cases. If a researcher has a variablewhich can be used to identify the individual cases, thevariable can be brought over to the box named LabelCases By
cluster analysis and a tutorial in SPSS using an example from psychology. Cluster analysis is a type of data reduction technique. Data reduction analyses, which also include factor analysis and discriminant analysis, essentially reduce data. They do not analyze group diff