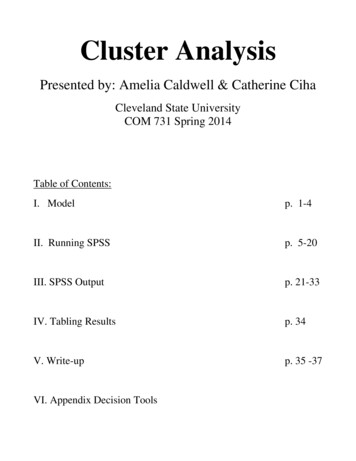
Transcription
Cluster Analysis TutorialPekka MaloAssist. Prof. (statistics)Business Intelligence (57E00500)Autumn 2015
Learning objectives Understand the concept of cluster analysisExplain situations where cluster analysis can be appliedDescribe assumptions used in the analysisKnow the use of hierarchical clustering and K- meanscluster analysis Know how to use cluster analysis in SPSS Learn to interpret various outputs of cluster analysis
What is cluster analysis?
Cluster analysis is known by manynames
Purpose: Find a way to group data ina meaningful mannerCluster Analysis (CA) method for organizing data(people, things, events, products, companies, etc.) intomeaningful groups or taxonomies based on a set ofvariables that describe the key features of theobservationsCluster a group of observations, which are similarto each other and different from observations in otherclusters
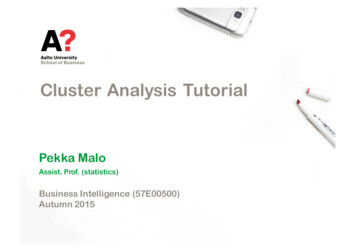
Objectives in Cluster AnalysisBetween- Cluster Variation MaximizeWithin- Cluster Variation MinimizeSource: Hair et al. (2010)
Within- groups vs. Between- groups Within- groups property: Each group is homogenouswith respect to certain characteristics, i.e. observationsin each group are similar to each other Between- groups property: Each group should bedifferent from other groups with respect to the samecharacteristics, i.e. observations of one group shouldbe different from the observations of other groups
How many clusters and how do youcluster ?
How many clusters and how do youcluster?
What we can do with clusteranalysis? Detect groups which are statistically significant– Taxonomy description: Natural groups in data– Simplification of data: Groups instead of individuals Identify meaning for the clusters– Which relationships can be identified? Explain and find ways how they can be used
Clustering vs. classification Classification– We know the “groups” for at least some of the observations– Objective is to find a rule / function which correctly assignsobservations into groups– Supervised learning procedure Clustering––––We don’t know the groups a prioriObjective group together points “which are similar”Identify the underlying “hidden” structure in the dataUnsupervised learning procedure (i.e. no labeled data fortraining)
Clustering “post hoc”segmentation Any discrete variable is a segmentation– E.g., gender, geographical area, etc. A priori segmentation– Use existing discrete variables to create segments Post hoc segmentation– Collect data on various attributes– Apply statistical technique to find segments
Cluster Analysis withSPSSTechniques used: Hierarchical Clustering with Ward’smethod k-Means Clustering ANOVA and cross-tabulations
Example data: Luxury consumptionand customer satisfactionhttp://www.afranko.com/2013/09 /luxury- logos- 2014/
Data View in SPSS
Sample size considerations Representativeness: The sample used for obtaining thecluster analysis should be representative of thepopulation and its underlying structure (in particular thepotential groups of interest) Minimum group sizes based on relevance to researchquestion and confidence needed in characterization ofthe groups
Phases of ClusteringChoice of variablesSimilarity MeasuresTechnique (Hierarchical / Nonhierarchical)Decision regarding the number of clustersEvaluation of significance
Step 1. Goals and choice of variables:Cluster by customer satisfaction
General note on choice of variables No theoretical guidelines Driven by the problem and practical significance– Do the variables help to characterize the objects?– Are the variables clearly related to the objectives? Warning:– Avoid including variables “just because you can”– Results are dramatically affected by inclusion of even one or twoinappropriate or undifferentiated variables
Step 2: Choice of similarity measureInterobject similarity is an empirical measure ofcorrespondence, or resemblance, between objects to beclustered.How close or similar are two observations?
Types of similarity measures Distance (or dissimilarity) Measures––––Euclidean DistanceMinkowski MetricEuclidean Distance for Standardized DataMahalanobis Distance Association Coefficient Correlation Coefficient Subjective Similarity
Distance Measures Minkowski metric between cases i and j:Di,j pXk 1 xikxjk s!1/sXik measurement of ith case on kth variables 2 : Euclidean Distances 1 : City- block Distancep number of variables
Euclidean Distance: Example
Standardization of variables Note: Euclidean distance depends on the scale of thevariables! Variables with large values will contributemore to distance Standardization of variables is commonly preferred toavoid problems due to different scales Most commonly done using Z- scores If groups are to be formed based on respondents’response styles, then within- case or row- centeringstandardization can be considered
Distance Measures . C covariance matrix between variables Euclidean Distance for Standardized Data: Mahalanobis (or Correlation) Distance
Standardized Euclidean Distance:Example
Step 3: Choice of clusteringprocedureSource: Verma, J.P. (2013)
Hierarchical Clustering with SPSS
Agglomerative vs. DivisiveSource: Hair et al. (2010)
Hierarchical Clustering Centroid method Linkage methods Nearest- neighbor or single- linkage method Farthest- neighbor or complete- linkage method Average linkage method Variance methods Ward method
How agglomerative approaches work?Start with all observations as their own clusterUse selected similarity measure to combinetwo most similar observations into a newcluster of two observationsRepeat the procedure using the similaritymeasure to group together the most similarobservations or combiniations of observationsinto another new clusterContinue until all observations are in a singlecluster
Example: Single Linkage Method Principle– The distance between two- clusters is represented by theminimum of the distance between all possible pairs of subjectsin the two groups
Example: Single- Linkage MethodSingle Linkage252015Points105005101520253035
Linkage methodsSingle- linkageComplete- linkageAverage linkage
Example: Ward’s method (variancelinkage) Minimize variance within cluster Biased towards forming clusters ofsimilar shape and size
Choice of hierarchical approachPros and cons Single- linkage– Most versatile, but poorly delineated cluster structures in adataset may lead to snakelike cluster- chains Complete- linkage– No chaining, but impacted by outliers Average linkage– Considers average similarity of all individuals in a cluster– Tends to generate clusters with small within- cluster variation– Less affected by outliers
Choice of hierarchical approach (cont’d)Pros and cons Ward’s method– Uses total sum of squares within clusters– Most appropriate when equally sized clusters are expected– Easily distorted by outliers Centroid linkage– Considers difference between cluster centroids– Less affected by outliers
Choosing the number of clusters No single objective procedure Evaluation based on following considerations:– Occurrence of single- member of extremely small clusters is notacceptable and should be eliminated– Ad- hoc stopping rules in hierarchical methods based on the rateof change in total similarity measure as the number of clustersincreases or decreases– Clusters should be significantly different across the set ofvariables– Solutions must have theoretical validity based on externalvalidation
Measures of heterogeneity change Percentage changes in heterogeneity– E.g. use of agglomeration coefficient in SPSS, which measuresheterogeneity as distance at which clusters are formed– E.g. within- cluster sum of squares when Ward method isconsidered Measures of variance change– Root mean square standard deviation (RMSSTD) square rootof the variance of the new cluster formed by joining two clusters,where the variance is computed across all clustering variables– Large increase in RMSSTD indicates joining of two dissimilarclusters
Visualization of solutionDendrogram isconvenient, whennumber ofobservations is notvery high
Use agglomeration schedule todecide number of clustersSeek for demarcation point
Step 4: Refine solution withNonhierarchical ClusteringProcedures Sometimes a combination of hierarchical andnonhierarchical methods is considered:– Use hierarchical method (e.g., Ward) to choose number ofclusters and profile cluster centers that serve as initial seeds– Use nonhierarchical method (e.g., k- Means) to cluster allobservations using the seed points to provide more accuratecluster membership
Hierarchical vs. non- hierarchical Choose hierarchical method when– Wide range (possibly all) cluster solutions are to be examines– Sample size is moderate (under 300- 400), no more than 1000 Choose nonhierarchical method when– Number of clusters is known– Initial seed points can be specified by practical, objective ortheoretical basis– Results are less susceptible to outliers, distance measure orinclusion of irrelevant variables– Works on large datasets
Simple k- Means algorithmGiven an initial seed, the algorithm alternates betweenthe following steps:1. Assignment step: Add each observation to the cluster, whose mean leads to the leastwithin- group sum of squares (Squared Euclidean distance)1. Update step: Compute new cluster means and use them as centroids forobservations in the updated cluster
K- Means in SPSS
Save solution and examine output
Assumptions Variables should be independent of each other Data needs to be standardized if the range or scale ofone variable is much larger or different from others In case of non- standardized data, Mahalanobis distanceis preferred
Step 5: Evaluation of cluster solutionsSource: Marketing research (Winter 2010)
How informative is your solution?Segmentation is information compression. Good segmentation conveyskey information about the important variables or attributes. Generalizability: Are the segments identifiable in a largerpopulation? Substantiality: How sizeable are the segments whencompared to each other? Accessibility and actionability: How easily can thesegments be reached? Can we execute strategies usingthe solution? Stability: Is the solution repeatable (if newmeasurements are done)?
Statistical vs. practical criteria Statistical:– Do the segment profiles differ in a statistically significant manner?– What attributes contribute most to the group differences?– Are the groups internally homogeneous and externallyheterogeneous? Practical:–––––Are the segments substantial enough for making profit?Is the solution stable?Can we reach the segment in a cost- effective manner?Is it useful for decision making purposes?Do the segments respond consistently to stimulus?
Dash of criticism Conceptual vs. empirical support Descriptive, atheoretical, non- inferential? Clusters always produced regardless of empiricalstructure? Solution not generalizable due to dependence onvariables used for defining similarity measure?
Comparison of profilesSource: Rencher: Methods of Multivariate Analysis
Profiling the cluster solutions Once clusters are identified, objective is to describe thecharacteristics of each cluster and how they differ onrelevant dimensions Utilize data not included in the cluster procedure toprofile the characteristics of each cluster– Demographics, psychographics, consumption patterns, etc. Often done using Discriminant Analysis to compareaverage score profiles for the clusters– Dependent variable (categorical) cluster membership– Independent variables Demographics Psychographics
Analysis of Variance in SPSS
Analysis of VarianceA special case of multiple regression, where the objectiveis to compare differences between two or more groups forsingle metric dependent variable.Example: Consumers shown different advertising messages:Which message is more likely to lead to purchase? A company has several customer segments: Do thesegments differ in terms of customer satisfaction?
Univariate One- Way ANOVA
Univariate One- Way ANOVA - modelDo the means between the different groups 1 to k differ?H0: μ1 μ2 μkH1: one or more of the groups has a different mean
Source: Wikipedia
Validation Vary similarity measure, clustering procedure Cross- validation:– Create sub- samples of the dataset (random splitting)– Compare cluster solutions for consistency (number of clustersand profiles)- Very stable solution would be produced with less than 10 % of observationsassigned differently- Stable solution is when 10- 20% of observations are assigned to a differentgroup- Somewhat stable solution when 20- 25% are assigned to a different cluster Using relevant external variables:– Examine differences on variables not included in the clusteranalysis but for which there is a theoretical and relevant reasonto expect variation across the clusters
Review Questions What is the objective of cluster analysis? What is the difference between hierarchical and non- hierarchical clustering techniques (e.g., Ward’s methodvs. K- means)? What criteria can you use when choosing the number ofclusters? How does an agglomerative approach work? Why do you use ANOVA after assigning cases toclusters?
Thank you!
R – give it a spin!
Cluster(Analysis(with(SPSS Techniques used: Hierarchical Clustering with Ward’s method k-Means Clustering ANOV