Transcription
An Analysis of Traces from a ProductionMapReduce ClusterSoila Kavulya , Jiaqi Tan† , Rajeev Gandhi and Priya Narasimhan CarnegieMellon University, Pittsburgh, PA 15213spertet@ece.cmu.edu,rgandhi@ece.cmu.edu, priya@cs.cmu.edu† DSO National Laboratories, Singapore 118230tjiaqi@dso.org.sgAbstract—MapReduce is a programming paradigm for parallelprocessing that is increasingly being used for data-intensiveapplications in cloud computing environments. An understandingof the characteristics of workloads running in MapReduceenvironments benefits both the service providers in the cloudand users: the service provider can use this knowledge to makebetter scheduling decisions, while the user can learn what aspectsof their jobs impact performance. This paper analyzes 10months of MapReduce logs from the M45 supercomputing clusterwhich Yahoo! made freely available to select universities foracademic research. We characterize resource utilization patterns,job patterns, and sources of failures. We use an instance-basedlearning technique that exploits temporal locality to predict jobcompletion times from historical data and identify potentialperformance problems in our dataset.I. I NTRODUCTIONLarge-scale data processing is becoming increasingly common, and has been facilitated by frameworks such as Google’sMapReduce [1], which parallelizes and distributes jobs acrosslarge clusters. In particular, Hadoop, the open-source implementation of MapReduce, has been widely used for large-scaledata-intensive tasks such as click-log mining, web crawling,image processing, and data analysis. Hadoop is widely usedat companies such as Yahoo!, Facebook, and Fox InteractiveMedia, as well as for academic research [2]. MapReduceclusters process large amounts of data–at Google alone, morethan 100,000 MapReduce jobs process more than 20 PB ofdata daily [1].Frameworks such as Hadoop allow users to harness dedicated or virtualized resources in compute clouds to run theirdata-intensive jobs. The pay-per-use cost model of cloudcomputing (e.g., commercial datacenters like Amazon’s ElasticCompute Cloud (EC2) charge 0.10-0.80/hour/node for userswishing to use/lease the computation and storage resources)coupled with the scale of the clusters required or instantiatedby the users makes cost-management essential. An understanding of the characteristics of workloads running in MapReduceenvironments as well as the factors affecting job-completiontimes can benefit both the cloud-computing service provider aswell as the users: the service provider can use this knowledgeto make better scheduling decisions and to provision resourcesmore effectively across diverse workloads, while the user canlearn which aspects of their jobs impact their performance anddrive down the cost of leasing the cloud-computing resources.To gain insight on MapReduce workloads, we analyzed 10months of trace data from the M45 [3] supercomputing cluster,a production Hadoop environment that Yahoo! administers andhas made freely available to select universities for academicresearch. The M45 cluster has approximately 400 nodes, 4000processors, 3 terabytes of memory, and 1.5 petabytes of diskspace. The cluster runs Hadoop, and uses Hadoop on Demand(HOD) to provision virtual Hadoop clusters over the largephysical cluster. For the past year, researchers at CarnegieMellon University have been running diverse data-intensiveworkloads on M45, such as large-scale graph mining, text andweb mining, large-scale computer graphics, natural languageprocessing, machine translation problems, and data-intensivefile system applications. This paper describes our analysis ofthe M45 trace data–both black-box OS performance data (suchas CPU utilization) and white-box performance data (extractedfrom native Hadoop logs)–obtained over a 10-month periodspanning parts of 2008 and 2009.The primary contribution of this paper is to provide a description of the statistical properties of this trace data that willaid other researchers in understanding the performance andfailure characteristics of Hadoop jobs running in large-scalereal-world clusters for different, often unknown, workloads.The main insights from our analysis, as shown in Table I, arethat: (i) job completion times and cluster allocation patternsfollow a long-tailed distribution and require fair job schedulers[4] to prevent large jobs or heavy users from monopolizingthe cluster; (ii) better diagnosis and recovery approachesare needed to reduce error latencies in long-running tasks;(iii) evenly-balanced load across most jobs implies that peercomparison is a suitable strategy for anomaly detection asdescribed in our previous work [6]–[8]; and (iv) low variabilityin user behavior over short periods of time allows us to exploittemporal locality to predict job completion times.A secondary contribution of this paper is to understandwhich aspects of a Hadoop job most affect the completiontime of that job, and to present a simple analytical modelwith configurable Hadoop-specific parameters to predict jobcompletion times. Due to the lack of labeled data, we couldnot verify performance problems. Instead, we inferred performance problems by predicting job completion times and flagging large prediction errors as potential performance problemsor workload changes.
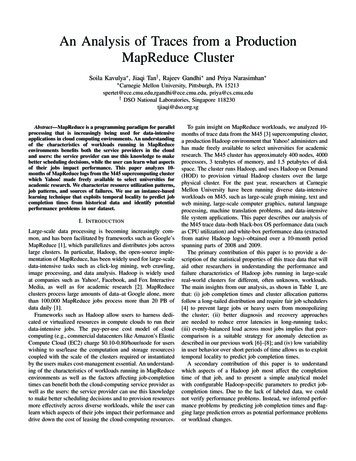
2TABLE IS UMMARY OF F INDINGSFindingImplicationsI. The average resource utilization on the cluster was low. For example, average CPUutilization across all nodes ranged from 5% to 10% (Section III-B).II. The job completion times and cluster allocation patterns follow a long-taileddistribution in which small jobs are occasionally interspersed with large jobs that runfor more than one day. (Figures 2(c) and 3(b))III. Most jobs fail within 150 seconds from the first aborted task. However, we observeda maximum error latency of 4.3 days (Section IV-A).IV. Load was generally evenly distributed across Map and Reduce tasks. (Section V-C1).The low resource utilization presents an opportunity to exploitenergy-aware job scheduling to reduce power consumption.Fair job schedulers, e.g., the Hadoop capacity scheduler, canprevent large jobs or heavy users from monopolizing the cluster.Workload characterizationBetter diagnosis and recovery approaches are needed to reduceerror latencies in long-running tasks.Peer-comparison is a feasible strategy for anomaly-detection.Performance predictionI. The variability in user behavior over short periods of time was low as users tend torun the same job repeatedly over short intervals of time (Section VI).II. Locally-weighted linear regression predicts job completion times better than thedistance-weighted algorithm when data input sizes are scaled. (Section ackerlogsadcvectorsdatablocksHDFSFig. 1. Architecture of Hadoop, showing the instrumentation sources thatprovide us with our M45 data traces.The paper is organized as follows: Section II provides abrief background on Hadoop while Section III and III-B describe the M45 data traces and the cluster allocation patterns.Section IV provides an analysis of the traces, including jobinter-arrival times and completion times, and job structure.Section VI presents our prediction algorithm. Section VIIevaluates our approach. Section VIII compares our results torelated work. Section IX concludes.II. BACKGROUNDHadoop [9] is an open-source implementation of Google’sMapReduce [10] framework that enables distributed, dataintensive, parallel applications by decomposing a massive jobinto smaller (Map and Reduce) tasks and a massive data-setinto smaller partitions, such that each task processes a differentpartition in parallel. A Hadoop job consists of a group of Mapand Reduce tasks performing some data-intensive computation. The Map task executes a user-defined map function foreach key/value pair in its input. The Reduce task consists ofa shuffle, sort, and reduce phase. During the shuffle and sortphase, the Reduce task fetches, merges, and sorts the outputsExploiting temporal locality can improve the accuracy of performance prediction.Large prediction errors can be used to detect performanceproblems and workload changes (Section VII).from completed map tasks. Once all the data is fetched andsorted, the Reduce task calls a user-defined function for eachinput key and list of corresponding values. Hadoop sharesdata amongst the distributed tasks in the system through theHadoop Distributed File System (HDFS), an implementationof the Google File System [11]. HDFS splits and stores filesas fixed-size blocks (except for the last block). Hadoop usesa master-slave architecture with a unique master node andmultiple slave nodes, as shown in Figure 1. The master nodetypically runs two daemons: (1) the JobTracker that schedulesand manages all of the tasks belonging to a running job; and(2) the NameNode that manages the HDFS namespace byproviding a filename-to-block mapping, and regulates accessto files by clients (i.e., the executing tasks). Each slave noderuns two daemons: (1) the TaskTracker that launches tasks onits local node, and tracks the progress of each task on itsnode; and (2) the DataNode that serves data blocks (on itslocal disk) to HDFS clients.III. D ESCRIPTION OF DATASETThe data we collected spanned an 10-month period fromApril 25, 2008 to April 24, 2009. (The Hadoop logs fromNov 12, 2008 to Jan 18, 2009 were unavailable.) The datasetcomprised of 171,079 Hadoop jobs representing a diverse setof data-intensive workloads, such as large-scale graph mining,text and web mining, large-scale computer graphics, naturallanguage processing, machine translation problems, and dataintensive file system applications.Table II gives an overview of the dataset. Jobs completed in20 minutes on average–with less than 4% of jobs exceeding 30minutes. The maximum job completion time that we observedwas 6.83 days. Each job consisted of an average of 153Maps and 19 Reduces running on 27 nodes. The maximumnumber of nodes allocated to a job in our dataset was 299.We categorized the completion status of jobs as: (i) successfuljobs, (ii) failed jobs which were aborted by the JobTracker dueto unhandled exceptions, and (iii) cancelled jobs which wereaborted by the user or the weekly maintenance daemon onM45. The job success-rate was high–97% of jobs completedsuccessfully, 2.4% failed, and 0.6% were cancelled.
3TABLE IIS UMMARY OF M45 DATASET.Log PeriodHadoop versionsNumber of active usersNumber of jobsSuccessful jobsFailed jobsCancelled jobsAverage maps per jobAverage reduces per jobAverage nodes per jobMaximum nodes per jobAverage job durationMaximum job durationNode days usedApr 25 - Nov 12, 2008Jan 19 - Apr 24, 20090.16: Apr 2008 0.17: Jun 2008 0.18: Jan 2009 31171079165948 (97%)4100 (2.4%)1031 (0.6%)154 558σ19 145σ27 22σ2991214 13875σ seconds6.84 days132624The cluster ran three major Hadoop versions during thisperiod (see Table II) namely: (i) Hadoop version 0.16 fromApril 2008, (ii) Hadoop version 0.17 from June 2008, and(iii) Hadoop version 0.18 from January 2009. There were alsosome minor version upgrades during this period.TABLE IIIJ OB HISTORY STATISTICS .MetricTask durationTask statusTask input/output sizesSpilled recordsData localityCombiner recordsFile-system bytesMap/Reduce countsDescriptionDuration of Maps/ReducesSuccess, failed, or incompleteInput/output records (or bytes) to taskRecords spilled to diskData-,rack-, or non-localCombiner input/output recordsBytes read/written to disk (or HDFS)Launched tasks and Map/Reduce slotsTABLE IVR ESOURCE USAGE METRICSResourceCPU utilizationNetworkDiskMetricsSystem, User, IOWait % utilizationKBps received/sentKBps read/writtenTABLE VN ETWORK AND D ISK U TILIZATIONMetricNetwork KBps ReceivedNetwork KBps SentDisk KBps ReadDisk KBps Write2008 (µ σ)150 213148 217308 180361 3692009 (µ σ)494 402501 405960 890987 1300A. Data collectionFigure 1 describes the native Hadoop logs (labeled theJobTracker logs) that we obtained over the 10-month periodfor our analysis. We parsed the JobTracker logs to extract theinformation listed in Table III. In addition to the log traces,we also obtained and analyzed periodically sampled /procbased OS performance data (labeled black-box data) over thesame period of time. The OS performance data was sampledat 5-minute intervals and a subset of the metrics collected islisted in Table IV.B. Resource UtilizationResource utilization on the cluster rose significantly from 2008to 2009. The allocation of the cluster increased from 20%of the node hours available in mid-2008 to 40% in late2008 and 2009 (see Figure 2(a)). CPU utilization on thecluster increased from 5% in 2008 to 10% in 2009. Thisincrease in CPU utilization does not appear to be correlatedwith the increased node allocation in November 2008. Sincethe increase in CPU utilization corresponds with an upgradefrom Hadoop 0.17 to Hadoop 0.18, we hypothesize that theincreased CPU utilization might be due to changes in thecompression of map outputs in Hadoop 0.18, coupled withchanges in user workload. Network and disk utilization alsorose from 2008 to 2009 (see Table V). Despite the increasedresource utilization in 2009, the cluster operated below its peakcapacity. The low resource utilization presents an opportunityto reduce power consumption by exploiting energy-awarejob scheduling. Node allocation patterns between users wasskewed with 32% of the users accounting for 98% of the nodehours allocated in the cluster (see Figure 2(c)).IV. J OB C HARACTERIZATIONWe analyzed the completion times of successful jobs, failedjobs, and cancelled jobs in 2008 and 2009. Failed jobs arejobs which were aborted by the JobTracker due to unhandledexceptions, and cancelled jobs were aborted by the user orthe weekly maintenance daemon. We measured the completiontime of cancelled jobs by subtracting the timestamp of the lastentry in the JobTracker log file from the job submission time.Figure 3(a) shows the total number of successful, failed andcancelled jobs per month. There was a burn-in period over thefirst two months of operation during which the job failure ratewas high–in April 2008, 70% of jobs failed, and in May 2008,10% of jobs failed. From June 2008 onwards, the failure ratedropped to 3%.We computed the mean, standard deviation, and the coefficient of variation (CV) for the job completion times. The coefficient of variation is the ratio of the standard deviation to themean. Distributions with CV 1 have a low-variance, whilethose with CV 1 have high-variance. We used the maximumlikelihood estimation method in R’s MASS [12] packageto fit the job completion times to the exponential, Weibull,and lognormal distributions. We measured the goodness of fitbetween the empirical distribution function and the referencedistribution using the Kolmogorov-Smirnov (KS) test.We observed that the job completion times follow a longtailed distribution with 95% of jobs completing within 20minutes. (see Figure 3(b)). The longest running job weobserved lasted 6.83 days. Jobs aborted by the JobTrackerhad lower completion times than jobs aborted by the user.
4(b) Average CPU utilization increased to 10% in 2009. This increase appears correlated with upgrade to Hadoop -2009Apr-200910.4Cancelled0.2Cummulative distribution of failuresFailed1000SuccessfulResource usage patterns on M45.10Total Jobs100000Fig. 2.(c) Cluster allocation patterns follow a longtailed distribution– 32% of the users accountfor 98% of the node hours allocated.0.0(a) Mean node hours allocated increased from 20% in mid-2008 to 40% in late 2008.1s100s1h100hError latency(a) The job failure rate during the first twomonths was high, but subsequently dropped to3%.Fig. 3.(b) Job completion times follow a long-taileddistribution.(c) Most jobs fail within 150 seconds after thefirst unrecoverable task aborts. However, weobserved a maximum error latency of 4.3 days.Distribution of job completion times and error latencies.TABLE VID ISTRIBUTION OF JOB COMPLETION TIME (M - M EAN , SD - S TANDARD DEVIATION , CV - C OEFFICIENT OF VARIATION , KS - MAXIMAL DISTANCEBETWEEN THE CUMULATIVE DISTRIBUTION FUNCTION OF THE THEORETICAL DISTRIBUTION AND THE SAMPLE EMPIRICAL DISTRIBUTION ).PeriodJob statusMeanSDCVBest fitted ognormalLognormalLognormalLognormal200990% of failed jobs were aborted within 35 minutes, comparedto cancelled jobs where 90% of jobs were aborted within 9hours. In Figure 3(b), we observe a cluster of cancelled jobswhich were aborted after 100 hours. These completion timescorrespond to the weekly maintenance task on M45 whichshuts down active Hadoop daemons.We measured the goodness of fit of the job completion timesagainst the exponential, Weibull, and lognormal distributions.The lognormal distribution was the best fitting distributionfor the successful, failed and cancelled jobs (see Table VI).(µ 4.29,(µ 4.23,(µ 6.75,(µ 5.24,(µ 4.87,(µ 6.78,σ 1.44)σ 2.22)σ 2.84)σ 1.44)σ 1.88)σ 1.87)KS0.1300.3000.1280.0600.2000.057However, the large distances yielded by the KolmogorovSmirnoff test for failed jobs, indicates that a distribution otherthan the lognormal, Weibull, and exponential distributions thatwe tested might be a better fit.Long-tailed job completion times have also been observedin other MapReduce clusters [4], prompting the developmentof fair job schedulers, such as the Hadoop capacity scheduler[5] and the Quincy fair scheduler [4], which prevent large jobsor heavy users from monopolizing the cluster.
4060Failed jobsCancelled jobs020Percentage of jobs805JobAbortFig. tMost job failures occurred during the map phase.A. Failure CharacterizationThere were 4100 failed jobs and 1031 incomplete jobs in ourdataset. These failures accounted for 3% of the total jobs run.We observed that:1) Most jobs fail within 150 seconds after the first abortedtask. Figure 3(c) shows that 90% of jobs exhibited anerror latency of less than 150 seconds from the firstaborted task to the last retry of that task (the defaultnumber of retries for aborted tasks was 4). We observeda maximum error latency of 4.3 days due to a copyfailure in a single reduce task. Better diagnosis andrecovery approaches are needed to reduce error latenciesin long-running tasks.2) Most failures occurred during the map phase. Failuresdue to task exceptions in the map phase were themost prevalent–36% of these failues were due to arrayindexing errors (see Figure 4). IO exceptions werecommon in the reduce phase accounting for 23% offailures. Configuration problems, such as missing files,led to failures during job initialization.3) Application hangs and node failures were more prevalent in cancelled jobs. Task timeouts, which occur whena task hangs and fails to report progress for more than10 minutes, and lost TaskTracker daemons due to nodeor process failures were more prevalent in cancelled jobsthan in failed jobs.4) Spurious exceptions exist in the logs. The logs containedspurious exceptions due to debugging statements thatwere turned on by default in certain versions of Hadoop.For example, a debug exception to troubleshoot a problem in the DFS client attributed to data buffering, and anexception due to a disabled feature that ignored the nonzero exit codes in Hadoop streaming, accounted for 90%of exceptions from January 21 to February 18, 2009.This motivates the need for error-log analysis tools thathighlight important exceptions to users.V. J OB S TRUCTUREWe examined the structure of the Hadoop jobs in our datasetby categorizing jobs based on the amount of time spe
The cluster ran three major Hadoop versions during this period (see Table II) namely: (i) Hadoop version 0.16 from April 2008, (ii) Hadoop version 0.17 from June