Transcription
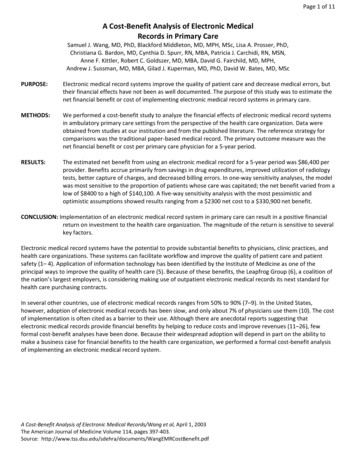
Page 1 of 11A Cost‐Benefit Analysis of Electronic MedicalRecords in Primary CareSamuel J. Wang, MD, PhD, Blackford Middleton, MD, MPH, MSc, Lisa A. Prosser, PhD,Christiana G. Bardon, MD, Cynthia D. Spurr, RN, MBA, Patricia J. Carchidi, RN, MSN,Anne F. Kittler, Robert C. Goldszer, MD, MBA, David G. Fairchild, MD, MPH,Andrew J. Sussman, MD, MBA, Gilad J. Kuperman, MD, PhD, David W. Bates, MD, MScPURPOSE:Electronic medical record systems improve the quality of patient care and decrease medical errors, buttheir financial effects have not been as well documented. The purpose of this study was to estimate thenet financial benefit or cost of implementing electronic medical record systems in primary care.METHODS:We performed a cost‐benefit study to analyze the financial effects of electronic medical record systemsin ambulatory primary care settings from the perspective of the health care organization. Data wereobtained from studies at our institution and from the published literature. The reference strategy forcomparisons was the traditional paper‐based medical record. The primary outcome measure was thenet financial benefit or cost per primary care physician for a 5‐year period.RESULTS:The estimated net benefit from using an electronic medical record for a 5‐year period was 86,400 perprovider. Benefits accrue primarily from savings in drug expenditures, improved utilization of radiologytests, better capture of charges, and decreased billing errors. In one‐way sensitivity analyses, the modelwas most sensitive to the proportion of patients whose care was capitated; the net benefit varied from alow of 8400 to a high of 140,100. A five‐way sensitivity analysis with the most pessimistic andoptimistic assumptions showed results ranging from a 2300 net cost to a 330,900 net benefit.CONCLUSION: Implementation of an electronic medical record system in primary care can result in a positive financialreturn on investment to the health care organization. The magnitude of the return is sensitive to severalkey factors.Electronic medical record systems have the potential to provide substantial benefits to physicians, clinic practices, andhealth care organizations. These systems can facilitate workflow and improve the quality of patient care and patientsafety (1– 4). Application of information technology has been identified by the Institute of Medicine as one of theprincipal ways to improve the quality of health care (5). Because of these benefits, the Leapfrog Group (6), a coalition ofthe nation’s largest employers, is considering making use of outpatient electronic medical records its next standard forhealth care purchasing contracts.In several other countries, use of electronic medical records ranges from 50% to 90% (7–9). In the United States,however, adoption of electronic medical records has been slow, and only about 7% of physicians use them (10). The costof implementation is often cited as a barrier to their use. Although there are anecdotal reports suggesting thatelectronic medical records provide financial benefits by helping to reduce costs and improve revenues (11–26), fewformal cost‐benefit analyses have been done. Because their widespread adoption will depend in part on the ability tomake a business case for financial benefits to the health care organization, we performed a formal cost‐benefit analysisof implementing an electronic medical record system.A Cost‐Benefit Analysis of Electronic Medical Records/Wang et al, April 1, 2003The American Journal of Medicine Volume 114, pages 397‐403.Source: tBenefit.pdf
Page 2 of 11METHODSStudy DesignWe performed a cost‐benefit analysis of electronic medical record usage by primary care physicians in an ambulatory‐care setting. The primary outcome measure was net financial costs or benefits per provider during a 5‐year period. Themodel was framed from the perspective of the health care organization, and the reference strategy was the traditionalpaper‐based medical record. All costs and benefits were converted to 2002 U.S. dollars (27).Data on costs and benefits came from primary data collected from our electronic medical record system, from otherpublished studies, and from expert opinion. When data were not available, expert opinion was obtained using amodified Delphi (28) technique to arrive at group consensus with a 7‐member expert panel. Primary data were obtainedfrom several internal medicine clinics using our internally developed electronic medical record system (29) at PartnersHealthCare System, an integrated delivery network formed in 1994 by the Brigham and Women’s Hospital and theMassachusetts General Hospital.We constructed a hypothetical primary care provider patient panel using average statistics from our institution. Thispanel included 2500 patients, 75% of whom were under 65 years of age; 17% of patients under 65 years old belonged tocapitated plans. In sensitivity analyses, panel size was varied from 2000 to 3000 patients, and the proportion of patientsunder the age of 65 years whose cases were capitated was varied from 0% to 28.7%. According to industry estimates,health maintenance organization enrollment was 28.7% of the U.S. population in 2000 (30,31).CostsThere are two categories of costs associated with electronic medical record implementation: system costs and inducedcosts (Table 1). System costs include the cost of the software and hardware, training, implementation, and ongoingmaintenance and support. Induced costs are those involved in the transition from a paper to electronic system, such asthe temporary decrease in provider productivity after implementation. The software costs of 1,600 per provider peryear were based on the costs for our electronic medical record system at Partners HealthCare on an annual per‐providerbasis (as an “application service provider” model); this figure includes the costs of the design and development of thesystem, interfaces to other systems (e.g., registration, scheduling, laboratory), periodic upgrades, and costs of useraccounts for support staff. Although these software costs were based on our internally developed system, they areconsistent with license fees for commercially available systems, which have been estimated at between 2,500 and 3,500 per provider for the initial software purchase, plus annual maintenance and support fees of 12% to 18% (K.MacDonald, First Consulting Group, Lexington, Massachusetts, written communication, 1999). In sensitivity analyses,software costs were varied from 50% to 200% of the base value. Implementation costs, estimated at 3,400 perprovider in the first year, included workflow process redesign, training, and historical paper chart abstracting. Ongoingannual maintenance and support costs were estimated to be 1,500 per provider per year and included the costs ofadditional technical support staff and system/network administration. Hardware costs were calculated to be 6,600 perprovider for three desktop computers, a printer, and network installation. We assumed that hardware would bereplaced every 3 years.Based on our experience, we modeled the induced costs of temporary loss of productivity using a decreasing stepwiseapproach, assuming an initial productivity loss of 20% in the first month, 10% in the second month, and 5% in the thirdmonth, with a subsequent return to baseline productivity levels. Using the average annual provider revenues for ourmodel patient panel, this amounted to a revenue loss of 11,200 in the first year.A Cost‐Benefit Analysis of Electronic Medical Records/Wang et al, April 1, 2003The American Journal of Medicine Volume 114, pages 397‐403.Source: tBenefit.pdf
Page 3 of 11BenefitsFinancial benefits included averted costs and increased revenues. We obtained figures for average annual expendituresfor a primary care provider at our institution before the implementation of an electronic medical record, and applied tothis the estimated percentage cost savings after implementation (Table 2).A Cost‐Benefit Analysis of Electronic Medical Records/Wang et al, April 1, 2003The American Journal of Medicine Volume 114, pages 397‐403.Source: tBenefit.pdf
Page 4 of 11For each item, the estimated savings was varied across the indicated range of values in the sensitivity analysis. Benefitswere divided into three categories: payer‐independent benefits, benefits under capitated reimbursement, and benefitsunder fee‐for‐service reimbursement (32–40). Payer‐independent benefits, which apply to both capitated and fee‐for‐service patients, come from reductions in paper chart pulls and transcription. The average cost of a chart pull at ourinstitution is approximately 5, accounting for the time and cost of medical records personnel to retrieve and then re‐file a paper chart. After conversion to the electronic medical record system, chart pulls can be reduced by 600 charts(range, 300 to 1200) per year, based on the experience at one Partners Health‐Care clinic. Transcription costs werereduced by 28% from partial elimination of dictation. In the sensitivity analysis, we varied the savings from 20% to 100%based on the experiences from other implementations (32).Benefits under capitated reimbursement accrue to the practice and health care organization primarily from avertedcosts as a result of decreased utilization. Clinical decision support alerts and reminders can decrease utilization byreducing adverse drug events, offering alternatives to expensive medications, and reducing the use of laboratory andradiology tests (37–39,41–44). The expert panel consensus was that adverse drug events would be reduced byapproximately 34% (range, 10% to 70%) as a result of basic medication decision support. We used standard financialbenchmarks (33–35) to assign baseline costs for adverse drug events, which took into account additional outpatientvisits, prescriptions, and admissions due to adverse drug events (36).The expert panel estimated that alternative drug suggestion reminders would save 15% (range, 5% to 25%) of total drugcosts per year, and this was applied to the baseline annual drug expenditures for the capitated patients in the panel. Weestimated that laboratory charges could be reduced by 8.8% (range, 0 to 13%) using decision support (37–39). Based oninformation from other studies, the expert panel estimated that decision support for radiology ordering would achieveaverage savings of 14% (range, 5% to 20%).Benefits under fee‐for‐service reimbursement included increased revenue and reduced losses. Computerizing theencounter form process can improve the capture of in‐office procedures that were performed but not documented.Based on other studies (25, 40), we projected a 2% improvement in billing capture (range, 1.5% to 5%). By using anelectronic medical record system that either supplies or prompts for certain required fields, billing error losses can bereduced. The expert panel estimated that computerizing the encounter form could decrease these errors by 78% (range,35% to 95%).A Cost‐Benefit Analysis of Electronic Medical Records/Wang et al, April 1, 2003The American Journal of Medicine Volume 114, pages 397‐403.Source: tBenefit.pdf
Page 5 of 11Statistical AnalysisWe assumed that initial costs would be paid at the beginning of year 1 and that benefits would accrue at the end of eachyear (Table 3).We assumed a phased implementation, in which only basic electronic medical record features were available in the firstyears (e.g., medication related decision support), and more advanced features were added in subsequent years (e.g.,laboratory, radiology, and billing benefits). The primary out come measure was net benefit or cost per primary careprovider. A discount rate of 5% was used in the base case and varied from 0% to 10% in the sensitivity analysis.One‐way and two‐way sensitivity analyses were performed using the ranges shown in Tables 1 and 2. Two waysensitivity analyses were performed using all combinations of the five most important variables identified in the one‐way sensitivity analysis, and with pair wise combinations of one benefit variable with each of the three primary costvariables (software, hardware, and support). A five‐way sensitivity analysis was performed using the most and leastfavorable conditions for the five variables. The time horizon was also varied from 2 to 10 years.A Cost‐Benefit Analysis of Electronic Medical Records/Wang et al, April 1, 2003The American Journal of Medicine Volume 114, pages 397‐403.Source: tBenefit.pdf
Page 6 of 11To account for variations in functionality among different systems, we constructed two additional models in which onlysubsets of the full functionality were included (Table 4). The “light” electronic medical record system included savingsfrom chart pulls and transcriptions only, whereas the “medium” system also included benefits from electronicprescribing (adverse drug event prevention and drug expenditure savings).RESULTSIn the 5‐year cost‐benefit model (Table 3), the net benefit of implementing a full electronic medical record system was 86,400 per provider. Of this amount, savings in drug expenditures made up the largest proportion of the benefits (33%of the total). Of the remaining categories, almost half of the total savings came from decreased radiology utilization(17%), decreased billing errors (15%), and improvements in charge capture (15%).Sensitivity AnalysesThe model was most sensitive to variations in the proportion of patients in capitated health plans; the net benefit variedfrom 8,400 to 140,100.A Cost‐Benefit Analysis of Electronic Medical Records/Wang et al, April 1, 2003The American Journal of Medicine Volume 114, pages 397‐403.Source: tBenefit.pdf
Page 7 of 11The model was least sensitive to variations in laboratory savings, in which the net benefit ranged from 82,500 to 88,300. In two‐way sensitivity analyses, the pair of input variables that yielded the least favorable outcome was a lowproportion of capitated patients and a high discount rate; variables that yielded the least favorable outcome was a lowproportion of capitated patients and a high annual software license (net cost of 200 per provider), and the pair with themost favorable outcome was a high proportion of capitated patients and a low hardware cost (net benefit of 146,200per provider).In the five‐way sensitivity analyses, when the most pessimistic assumptions were made, the model showed a net cost of 2,300 per provider. When the most optimistic assumptions were used, this analysis yielded a net benefit of 330,900per provider. When the time horizon was reduced to 2 years instead of 5 years, the net cost was 2,100 per provider,and when the time horizon was lengthened to 10 years, the net benefit was 237,300 per provider.For the “light” electronic medical record, in which the system is used only to reduce paper chart pulls and transcriptioncosts, the net cost was 18,200 per provider (Table 4). For the “medium” electronic medical record, in which benefitsfrom electronic prescribing are added, the net benefit was 44,600 per provider.DISCUSSIONOur analysis indicates that the net financial return to a health care organization from using an ambulatory electronicmedical record system is positive across a wide range of assumptions. The primary areas of benefit are from: reductions in drug expendituresimproved utilization of radiology testsimprovements in charge capturedecreased billing errorsBenefits increase as more features are used and as the time horizon is lengthened. In sensitivity analyses, the net returnwas positive except when the most pessimistic assumptions were used. Savings to the health care organization areobtained under both capitated and fee‐for‐service reimbursement, but these savings depend on the reimbursementmix: the greater the proportion of capitated patients, the greater the total return. Among fee‐for‐service patients, alarge portion of the savings from improved utilization may accrue to the payer instead of the provider organization. As aresult, payers may be motivated to offer incentives to providers to use an electronic medical record to help controlcosts. In addition, although full capitation appears to be less prevalent now than several years ago, with the continuedrise in health care expenditures, other types of risk‐sharing arrangements are likely to become more common in thefuture (45), such as partial capitation, risk pools, and pharmacy withholds.We used conservative estimates of cost savings from an electronic medical record. For example, one clinic was able to: reduce chart pulls by 60% to 70%reduce medical records staff by 50%for an annual savings of about 4,000 per provider (15). Others have identified even larger savings from the use of drugsuggestions for certain classes of medications (46). In one outpatient clinic, display of formulary information at the timeof ordering lowered drug costs by up to 26% (M. Overhage, MD, Regenstrief Institute, Indianapolis, Indiana, writtencommunication, 2001).Savings due to prevention of adverse drug events in the model did not include costs of malpractice settlements, injury topatients, or decreased quality of life for patients, so the actual savings may be higher. We may have also underestimatedfuture cost savings because the model did not account for the annual growth rate of expenditures, which may outpaceinflation in some categories, such as in drug and radiology costs.A Cost‐Benefit Analysis of Electronic Medical Records/Wang et al, April 1, 2003The American Journal of Medicine Volume 114, pages 397‐403.Source: tBenefit.pdf
Page 8 of 11Other potential areas of savings were not included in the model because adequate data were not available. Theseinclude savings in: malpractice premium costs (40)storage and supply costs (47)generic drug substitutions (48)increased provider productivity (19,23,24)decreased staffing requirements (23,24,49)increased reimbursement from more accurate evaluation and management coding, and decreased claimsdenials from inadequate medical necessity documentationAlthough we accounted for a temporary (3‐month) loss of productivity in our model, some providers may have a longerperiod of reduced productivity. To measure this effect, we performed a sensitivity analysis that included a prolonged10% productivity loss for 12 months and found that there was still a 5‐year net benefit of 57,500 per provider.This study has several limitations. The cost‐benefit model was based on primary data from our institution, estimatesfrom published literature, and expert opinion. The effectiveness of some of these interventions has been demonstratedin the inpatient setting, but outpatient effectiveness is less certain. There may be other costs associated withimplementation of an electronic medical record. For example, system integration costs may be greater at otherinstitutions, depending on the number and complexity of system interfaces that are required. However, the majority ofbenefits in this model can be obtained even with a minimal number of interfaces (i.e., registration, scheduling, andtranscription). In addition, there may be other unforeseen expenses associated with clinic workflow process redesign,reassignment of clinic staff, or productivity loss during unscheduled computer system or network outages. In mostcases, clinical decision support features will decrease utilization by suggesting more appropriate testing. This leads tocost savings among capitated patients, but it could also have an adverse effect on revenues from fee‐for‐service patientsthat may offset billing improvements.T
A Cost‐Benefit Analysis of Electronic Medical Records/Wang et al, April 1, 2003 The American Journal of Medicine Volume 114, pages 397‐403.
