Transcription
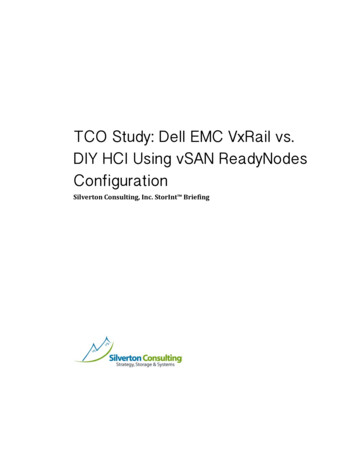
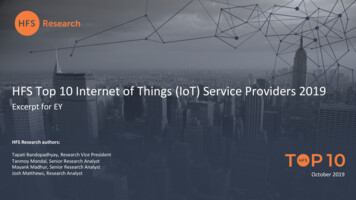
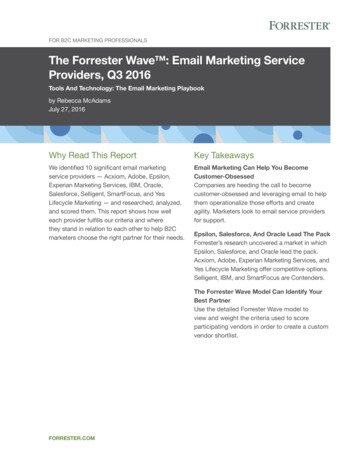
white paperCommunications Service ProvidersTCO AnalysisTotal Cost of OwnershipAnalysis for a WirelessAccess GatewayAn analysis of the total cost of ownership of a wireless access gateway runningon merchant silicon hardware vs. industry-standard, high volume servers.AuthorsAjay ManujaVP of EngineeringBenu NetworksBrian NevillePlatform Applications EngineerIntel CorporationOverviewThis paper presents a high-level comparison of the total cost of ownership ofrunning the Benu Networks’ Operating System (BenuOS)* on an Intel architecture–based platform vs. utilizing merchant-silicon built with 64-bit MIPS* NPU*processors. Each platform is configured to run the BenuOS wireless access gateway(WAG) network function. The WAG is utilized to provide large-scale Wi-Fi deviceaggregation via GRE tunnels, mobility, IP policy enforcement, and service edgerouting in a carrier Wi-Fi network. This analysis will look into various factors thatcontribute to the cost of ownership in capital expenditure (CAPEX) and operationalexpenditure (OPEX) categories between the MIPS hardware and Intel architecture–based platforms.Operating PrinciplesFor the TCO analysis, the platforms were configured to function as a wirelessaccess gateway (WAG) in a service provider’s network. The goal was to push asmuch data throughput as possible through each platform and measure packetperformance, latency, and jitter.Benu Networks WAG Service(under test)Table of ContentsOverview . . . . . . . . . . . . . . . . . . . . . . . . 1Operating Principles. . . . . . . . . . . . . . 1Performance MeasurementBaseline . . . . . . . . . . . . . . . . . . . . . . . . . 2TCO Calculations, Results,and Conclusion . . . . . . . . . . . . . . . . . . 3Test Details . . . . . . . . . . . . . . . . . . . . . . 4Intel Hardware Platform . . . . . . . . 4BenuOS* Software Components.4Test Description. . . . . . . . . . . . . . . . 4For Unidirectional Tests . . . . . . . . 4For Bi-Directional Tests. . . . . . . . . 4Stats Collection . . . . . . . . . . . . . . . . 5Abbreviations. . . . . . . . . . . . . . . . . . . . 5Exhibit 1. WAG service¹In a service provider’s network, shown in Exhibit 1, the WAG network functionaggregates access traffic from user devices via Wi-Fi access points (APs) that bridgeall user traffic associated to the Wi-Fi SSID (open or secure) over a GRE tunnel thatterminates on the WAG. The WAG is the first IP hop for all devices and provides allIP subscriber management and policy enforcement on each device. On the networkside, the WAG connects subscriber traffic to the service provider’s Internet core viaL3 protocols. Wi-Fi APs are configured with Open SSIDs and bridge all user packetsover a GRE tunnel to the WAG. The WAG applies different policies to each device, oron a per-SSID level. The WAG supports a number of inline IP services in fast-path
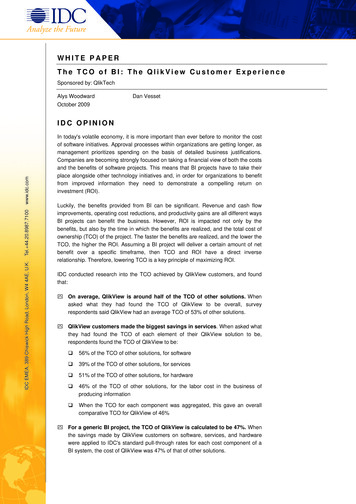
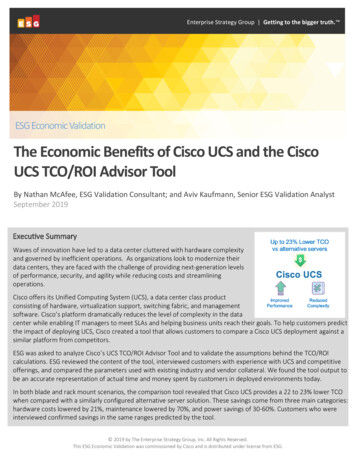
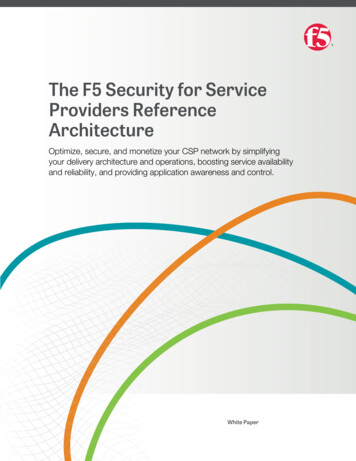
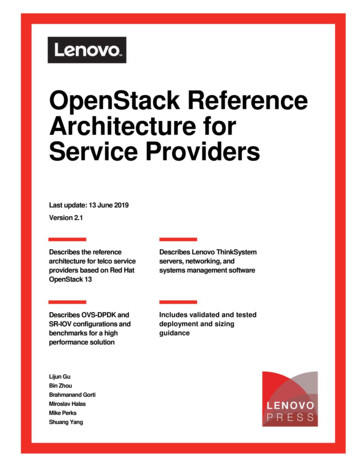
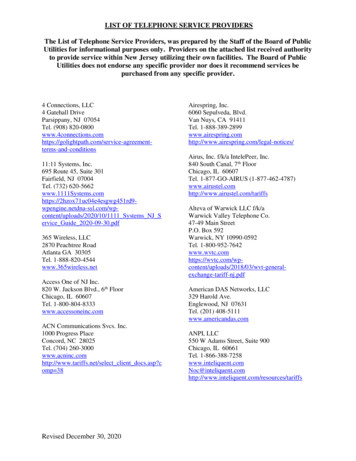
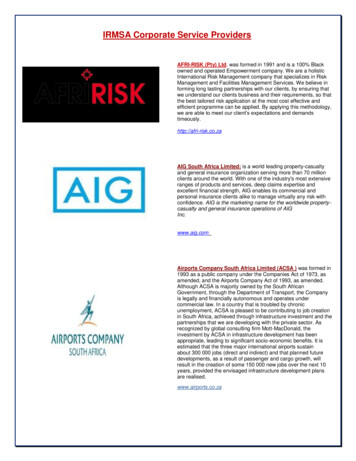
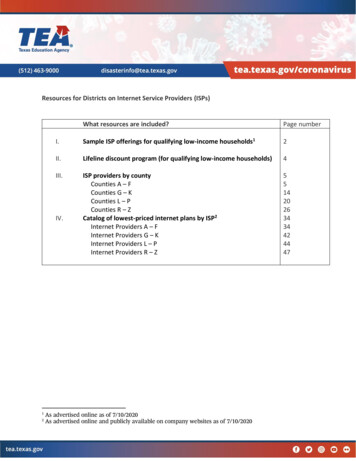
White Paper Total Cost of Ownership Analysis for a Wireless Access Gatewaythat can eliminate the need for external appliances for features such as DHCP, CGNAT, ACL, and service edge routing (StaticRoute, OSPF, BGP, IS-IS) for both IPv4 and IPv6.Exhibit 2 shows the upstream and downstream packet processing pipeline flow for our testbed.Benu Networks WAG ServiceExhibit 2. Upstream (above) and downstream (below) packet flowIn the upstream flow shown in Exhibit 2, the Intelarchitecture–based platform running the WAG service firstreceives packets from the DPDK layer; it then does packetclassification to determine how the packet will be treated.In this case, the packet is a GRE tunnel and thus needs to bede-encapsulated. Inside the GRE tunnel are Ethernet framesfrom the UE device. The WAG then applies any ACL policiesfollowed by CGNAT. Finally, the WAG does the route lookupto forward the packet to its immediate destination and sendsit to the network side via IP OP operation.In the downstream flow, the above-mentioned operationshappen as shown in Exhibit 2. In the platform based on MIPSarchitecture, the upstream and downstream flows are similarwith the exception that the DPDK layer is not available.Subscriber traffic is simulated using industry standard trafficgenerators in a lab environment. Performance was measuredin Gbps/PPS based on how much data throughput wasdelivered by each platform.The WAG is configured with four interfaces utilizing 4 x 10Gports, an integrated DHCP server, and a CGNAT profile.Exactly 1024 subscribers are registered over 512 GRE tunnelssending to and receiving traffic from four network nodesSystem InformationManufacturer: Intel CorporationProduct Name: S2600WTTRCPU: Intel Xeon CPU E5-2699 v3 @ 2 .30GHzOPENSTACK (KVM - FEDORA)MGMT VMOPEN vSWITCHvMEG VM1X10GETX RX1X10GETX RXPerformance Measurement BaselineThe same traffic model was run on both platforms andperformance was measured. Since the two platformsuse different architectures, they offer relatively differentperformance under the same traffic conditions.Exhibits 4 and 5 show a comparison of the performanceof the two platforms in handling bi-directional data traffic.At an IMIX packet size of 475 bytes, the platform based onMIPS architecture provided up to 39% higher performancein terms of throughput than the Intel platform.² At a higherpacket size, the performance offered by the two platformsis similar in terms of throughput and packets per secondprocessing. This was expected since the platform basedon MIPS architecture is purpose built to run the WAGapplication.The Intel platform has a lower latency than the platformbased on MIPS architecture as shown in Exhibit 6, where thejitter is higher than the platform based on MIPS architectureas shown in Exhibit 7. At larger packet sizes, the performancebetween the Intel platform and platform based on MIPSarchitecture is comparable. The Intel architecture-basedplatform has the advantage of being an industry-standard,high volume server that can be used to run WAG or any otherapplication that a service provider chooses without beinglocked into using the platform only for a WAG application.IntelPCI PASSTHROUGH1X10GETX RXusing the iXNetwork* tool. The operations considered for thistest are de-encapsulation and encapsulation.MIPS hardware1X10GETX RXCard: IXIA FlexAP 10GTool: IxNetworkPORT 11X10GETXPORT 21X10GETXPORT 31X10GETXPORT 31X10GETXRXRXRXRXExhibit 3. Intel architecture–based WAG test setup used forperformance analysisExhibit 4. Bi-directional traffic throughput vs. packet size²2
White Paper Total Cost of Ownership Analysis for a Wireless Access GatewayTCO Calculations, Results, and ConclusionIntelMIPS hardwareExhibit 8 shows the TCO comparison for CAPEX and OPEX.Since both platforms will run Benu Networks software,hardware will primarily be considered for comparison.The overall advantage goes to an Intel architecture–basedplatform when compared to a merchant silicon solution.Using a one year comparison of CAPEX plus OPEX, the Intelarchitecture–based platform is 75% lower than that of aplatform based on MIPS architecture.COSTSMERCHANT SILICONBASED SOLUTIONINTELCAPEXHardware Unit (ASP)Exhibit 5. Bi-Directional traffic packets per second processed(in millions) vs. packet size²Intel 75,000 15,000Number of Units11CAPEX Sub Total 75,000 15,000Power † 797 1,253Cooling † 797 1,253Real Estate † 1,572 1,572Maintenance 9,000 1,800OPEXMIPS hardwareCGL Subscription 1,000OPEX Sub Total 12,166 6,878Total CAPEX OPEXPercentage savings 87,166 21,87875%50 Gbps(40 Gb used)40 Gbps5 x 10 GE ports4 x 10 GE portsBenuOSCGL22PLATFORM SPECIFICATIONSystem ThroughputHardware SpecificationI/O InterfaceOperating SystemRack Units (RU)Exhibit 6. Latency at IMIX packet size 475²Height (inches)3.53.5Width (inches)16.916.9Depth (inches)26.2327.954540100 to 240100 to 240700110012%12%Weight (lbs.)IntelInput Voltage (V)MIPS hardwareMax Power (W)Maintenance†OPEX VariablesCost / kWhCost / RUAssumed Costs 0.13 0.13 786.00 786.00Exhibit 8. TCO Calculations for platform based on MIPSarchitecture and Intel architecture–based platform usingDPDKExhibit 7. Jitter at IMIX packet size 475²Comparing CAPEX, the average sale price for the merchantsilicon based solution is approximately 75,000, and theindustry-standard, high volume platform used in thisbenchmark retails for approximately 15,000. The reasonthe merchant silicon solution is more expensive is due tomanufacturing complexity, more expensive components,3
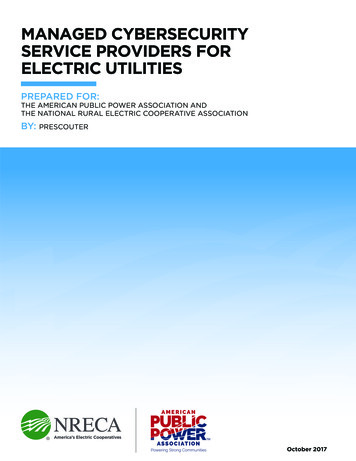
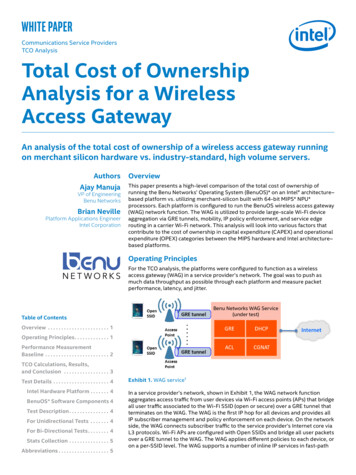
White Paper Total Cost of Ownership Analysis for a Wireless Access Gatewayoverhead, and vendor markup of the hardware. The industrystandard, high volume server can be purchased by thecustomer and reused for many different applications, andvolume-based discounts could reduce the price.OPEX includes costs associated with running a networkbox in the operator’s network facility, which are largelypower, cooling, space, and maintenance expenses. In ourTCO example, we provide cost items for power, cooling,real-estate, and maintenance on merchant silicon hardware.Power and cooling variable costs are based on kilowatthour (kWh) charges. This example uses a cost of 0.13 perkWh, which is typical in major developed markets. Hardwaremaintenance costs vary between vendors, which extends thewarranty of hardware. In this example, 12% of the averagesale price was used to calculate the annual maintenancecosts. The last item is the annual support license fee to runa carrier-grade Linux* (CGL) distribution, which only appliesto the industry-standard, high volume server solution since aCGL is included in the merchant silicon solution. The realestate costs are calculated on a per Rack Unit cost and arehighly variable. In this example, 786 per RU and is the samefor both platforms since they are the same 2 RU form factor.While the overall performance for the Intel platform iscomparable for the same form factor (2 RU, 4 x 10 GE ports),²the service provider is in a unique position to take advantageof Intel’s rapid product cycle, where the next generations ofIntel processors on industry-standard, high volume serversoffer improved performance at better price points. Serviceproviders can re-purpose the existing platform for other datacenter applications that use Intel architecture and replace itwith newer and faster servers and still keep a lower TCO.Test DetailsIntel Hardware PlatformAll tests in this report were generated with the followingplatform:ATTRIBUTECPUDETAILIntel Xeon CPU E5-2699v3 @ 2.30GHzNumber of Cores on board36Cores Used for BenuOS*32BenuOS Used CoreSpecifications26 Data path 6 Control pathOptimizationCPU Pinning, DedicatedCPUs, Grub-isolcpu’sMemory64 G OS (Fedora* 21) OpenStack* Kilo* with Open vSwitch* (non-accelerated) for the management interfaces 1 VM for management functionality (Management VM) 1 VM for control plane and data path (Application VM)MgmtVMIPMIeth0eth1ControlPlane andDatapathVMOpenVSwitcheth0eth1Data:2 @ 10 Gbs or 4 @1 Gbs; PCI -PTRHEL 7with KVMOpenVSwitchManagement:2 @ 1 GbsIPMI:1 @ 1 GbsExhibit 9. Dual core x86 COTS ServerTest DescriptionIn this test, four 10G ports from the Ixia* Flex AP card aredirectly connected to the four 10G ports of the BenuOS.For Unidirectional Tests Using the IxNetwork tool, four DHCP streams areconstructed to register 256 subscribers over 128 tunnelswith each stream. The total numbers of subscribersregistered are 1024 over 512 tunnels. Four of the 10G interfaces from the IxNetwork toolare mapped to the streams constructed as the accessinterfaces sending upstream/downstream traffic fromsubscribers to network/network to subscribers. Each stream sends continuous traffic at a line rate for256 subscribers over 128 tunnels with packet sizesvarying from 84 bytes to 1514 bytes and with IMIX traffic. The aggregate of all the four streams mapped to four10G interfaces/ports on the tool implies pushing 40Gtraffic into the box.For Bi-Directional ver-BoardS2600WTTRBenuOS* Software ComponentsThe BenuOS, when running in the Appliance mode, consistsof the following: Using the IxNetwork tool, four DHCP streams areconstructed to register 256 subscribers over 128 tunnelswith each stream. The total numbers of subscribersregistered are 1024 over 512 tunnels. Two of the 10G interfaces from the IxNetwork toolare mapped to the streams constructed as the accessinterfaces sending upstream traffic from subscribers tothe network. Two of the 10G interfaces from the IxNetwork toolare mapped to the streams constructed as the accessinterfaces sending downstream traffic from the networkto subscribers simultaneously.4
White Paper Total Cost of Ownership Analysis for a Wireless Access Gateway Each stream constructed for upstream/downstream toachieve bi-directional sends continuous traffic at a linerate for 512 subscribers over 256 tunnels with packetsizes varying from 84 bytes to 1514 bytes and with IMIXtraffic. The aggregate of all the four streams mapped to four10G interfaces/ports on the tool implies pushing 40Gtraffic into the box.Stats Collection The stats are collected with respect to each stream andport from the IxNetwork tool when each port is pushingtraffic at 100% line to achieve the aggregate of 40G. The measurements are recorded once the steady statetraffic flow is achieved, most likely between 2 and 3minutes from the time the traffic flow has started. For the throughput, the Rx data rate achieved on each10G port was aggregated and recorded. For the frame rate, the Rx frames per second isaggregated and recorded. For the latency, the aggregated average of the Rxstore-and-forward latency was recorded for average,maximum, and minimum values. For the jitter, the aggregated average of the Rx storeand-forward latency was recorded for average,maximum, and minimum values. The statistics collected from the IxNetwork tool include: Rx frames transmitted per second from subscribers tothe network. Rx data rate in MBPS from subscribers to the networkin frames per second. Store-and-forward average/maximum/minimumlatency from subscribers to the network innanoseconds. Average/maximum/minimum delay variation fromsubscribers to the network in IMIXIS-ISOSPFPPSSSIDUEWAGAccess Control ListAccess PointsBorder Gateway ProtocolCarrier Grade Network Address TranslationDynamic Host Configuration ProtocolData Plane Development KitGeneric Routing EncapsulationInternet MixIntermediate System to Intermediate SystemOpen Shortest Path FirstPackets Per SecondService Set IdentifierUser EquipmentWireless Access Gateway¹ Figures courtesy of Benu Networks.² Test performed by Benu Networks. Configurations: see Exhibit 8 for details on the merchant-silicon based solution. See the “Test Details” section for hardware configurations of the Intelarchitecture-based solution and other material testing conditions.Software and workloads used in performance tests may have been optimized for performance only on Intel microprocessors.Performance tests, such as SYSmark and MobileMark, are measured using specific computer systems, components, software, operations and functions. Any change to any of those factors maycause the results to vary. You should consult other information and performance tests to assist you in fully evaluating your contemplated purchases, including the performance of that productwhen combined with other products. For more complete information visit www.intel.com/benchmarks.Intel technologies’ features and benefits depend on system configuration and may require enabled hardware, software or service activation. Performance varies depending on systemconfiguration. No computer system can be absolutely secure. Check with your system manufacturer or retailer or learn more at intel.com.Cost reduction scenarios described are intended as examples of how a given Intel-based product, in the specified circumstances and configurations, may affect future costs and provide costsavings. Circumstances will vary. Intel does not guarantee any costs or cost reduction. Copyright 2017. This White Paper is a joint copyright of Benu Networks and Intel Corporation. All Rights Reserved.Benu Networks, BenuOS, and the Benu Networks logo are trademarks of Benu Networks.Intel, the Intel logo, and Xeon are trademarks of Intel Corporation or its subsidiaries in the U.S. and/or other countries.*Other names and brands may be claimed as the property of others.0817/DO/H09/PDFPlease Recycle335497-001US5
TCO Analysis Benu Networks WAG Service (under test) Exhibit 1 . WAG service¹ Total Cost of Ownership Analysis for a Wireless Access Gateway An analysis of the total cost of ownership of a wireless access gateway running on merchant silicon hardware