Transcription
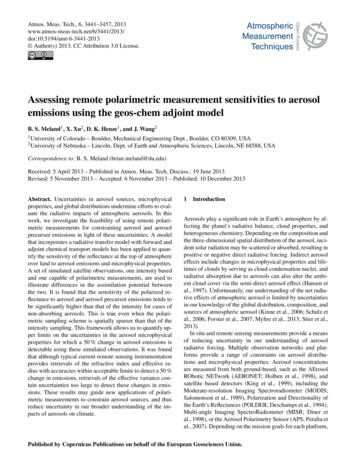
Open AccessAtmosphericMeasurementTechniquesAtmos. Meas. Tech., 6, 3441–3457, 4/amt-6-3441-2013 Author(s) 2013. CC Attribution 3.0 License.Assessing remote polarimetric measurement sensitivities to aerosolemissions using the geos-chem adjoint modelB. S. Meland1 , X. Xu2 , D. K. Henze1 , and J. Wang21 University2 Universityof Colorado – Boulder, Mechanical Engineering Dept., Boulder, CO 80309, USAof Nebraska – Lincoln, Dept. of Earth and Atmospheric Sciences, Lincoln, NE 68588, USACorrespondence to: B. S. Meland (brian.meland@du.edu)Received: 5 April 2013 – Published in Atmos. Meas. Tech. Discuss.: 19 June 2013Revised: 5 November 2013 – Accepted: 6 November 2013 – Published: 10 December 2013Abstract. Uncertainties in aerosol sources, microphysicalproperties, and global distributions undermine efforts to evaluate the radiative impacts of atmospheric aerosols. In thiswork, we investigate the feasibility of using remote polarimetric measurements for constraining aerosol and aerosolprecursor emissions in light of these uncertainties. A modelthat incorporates a radiative transfer model with forward andadjoint chemical transport models has been applied to quantify the sensitivity of the reflectance at the top of atmosphereover land to aerosol emissions and microphysical properties.A set of simulated satellite observations, one intensity basedand one capable of polarimetric measurements, are used toillustrate differences in the assimilation potential betweenthe two. It is found that the sensitivity of the polarized reflectance to aerosol and aerosol precursor emissions tends tobe significantly higher than that of the intensity for cases ofnon-absorbing aerosols. This is true even when the polarimetric sampling scheme is spatially sparser than that of theintensity sampling. This framework allows us to quantify upper limits on the uncertainties in the aerosol microphysicalproperties for which a 50 % change in aerosol emissions isdetectable using these simulated observations. It was foundthat although typical current remote sensing instrumentationprovides retrievals of the refractive index and effective radius with accuracies within acceptable limits to detect a 50 %change in emissions, retrievals of the effective variance contain uncertainties too large to detect these changes in emissions. These results may guide new applications of polarimetric measurements to constrain aerosol sources, and thusreduce uncertainty in our broader understanding of the impacts of aerosols on climate.1IntroductionAerosols play a significant role in Earth’s atmosphere by affecting the planet’s radiative balance, cloud properties, andheterogeneous chemistry. Depending on the composition andthe three-dimensional spatial distribution of the aerosol, incident solar radiation may be scattered or absorbed, resulting inpositive or negative direct radiative forcing. Indirect aerosoleffects include changes in microphysical properties and lifetimes of clouds by serving as cloud condensation nuclei, andradiative absorption due to aerosols can also alter the ambient cloud cover via the semi-direct aerosol effect (Hansen etal., 1997). Unfortunately, our understanding of the net radiative effects of atmospheric aerosol is limited by uncertaintiesin our knowledge of the global distribution, composition, andsources of atmospheric aerosol (Kinne et al., 2006; Schulz etal., 2006; Forster et al., 2007; Myhre et al., 2013; Stier et al.,2013).In situ and remote sensing measurements provide a meansof reducing uncertainty in our understanding of aerosolradiative forcing. Multiple observation networks and platforms provide a range of constraints on aerosol distributions and microphysical properties. Aerosol concentrationsare measured from both ground-based, such as the AErosolRObotic NETwork (AERONET; Holben et al., 1998), andsatellite based detectors (King et al., 1999), including theModerate-resolution Imaging Spectroradiometer (MODIS;Salomonson et al., 1989), Polarization and Directionality ofthe Earth’s Reflectances (POLDER; Deschamps et al., 1994),Multi-angle Imaging SpectroRadiometer (MISR; Diner etal., 1998), or the Aerosol Polarimetry Sensor (APS; Peralta etal., 2007). Depending on the mission goals for each platform,Published by Copernicus Publications on behalf of the European Geosciences Union.
3442B. S. Meland et al.: Assessing remote polarimetric measurement sensitivitiesmeasurements may include only intensity observations, as isthe case for the MODIS and MISR instruments, or may include polarimetric data as well, for example the POLDERor APS instruments. Retrieval algorithms are used to deducethe aerosol optical depth and size distribution informationfrom the measured signal (e.g., Remer et al., 2005; Duboviket al., 2011). These retrievals rely on a priori assumptionsof aerosol optical properties, size distributions, and shape,which may differ between retrieval algorithms. For instance,the POLDER retrieval assumes spherical aerosol particles inits inversion (Deuze et al., 2000) whereas the AERONET skyretrieval algorithm assumes either spherical (Dubovik andKing, 2000) or spheroidal (Dubovik et al., 2002) particlesdepending on the particle size. These different assumptionsmay lead to discrepancies between retrieved quantities andinferences made from these regarding aerosol distributionsand sources.The accuracy of remote retrieval of aerosol propertiescan be enhanced by utilizing measurements of the full polarimetric state of light as well as spectral measurements(Chowdhary et al., 2005). Kokhanovsky et al. (2010) compared the capability of a number of retrieval algorithms(MODIS, MISR, AATSR, and POLDER algorithms) for determining aerosol optical depth and microphysical properties from a simulated data set. It was found that multi-angle,multi-wavelength, polarimetric retrievals outperformed thosethat only used scattered light intensity or measurements froma single viewing angle. Knobelspiesse et al. (2012) simulated the instrument measurement characteristics of MISR,POLDER, and the Aerosol Polarimetry Sensor (APS) in order to quantify the information content of each measurement technique and to determine the sensitivity of each set ofmeasurements to aerosol properties. It was again found thatmulti-angle, spectral, polarimetric measurements were mostcapable of accurate aerosol retrieval.Atmospheric chemistry and transport models, which simulate the production, loss, interaction, and transport of numerous chemical species and aerosols, provide a means of estimating the role of specific processes in determining the overall radiative impacts of aerosols. Comparisons across modelshave been used to identify the contribution to the total uncertainty owing to treatment of emissions (Textor et al., 2006),surface albedo and cloud distributions (Stier et al., 2007,2013), and aerosol optical properties and radiative transfer(Kinne et al., 2006; Myhre et al., 2013). To reduce our uncertainty in the sources and distribution of aerosols, observations and models can be combined through data assimilation.For example, aerosol optical depth has been assimilated operationally to improve meteorological forecasts (Zhang et al.,2008; Benedetti et al., 2009), and radiances have been used toconstrain emissions of aerosols and aerosol precursors (e.g.,Dubovik et al., 2008; Wang et al., 2012).While these previous works focused on constrainingaerosol properties using polarimetric remote sensing measurements, or aerosol sources using intensity measurements,Atmos. Meas. Tech., 6, 3441–3457, 2013there has been less consideration of the value of polarimetricmeasurements for deriving constraints on aerosol and aerosolprecursor concentrations or emissions. The goal of this workis to quantify the utility of polarimetric measurements versusintensity based measurements for inferring aerosol microphysical properties and as a possible means of constrainingaerosol emissions through use of a simulated set of remotesatellite measurements. We consider two sets of simulatedremote sensing observations, both derived from a flight pathclosely aligned with that of two former satellites capable ofpolarimetric measurements: PARASOL (part of the A-trainbetween 2004 and 2009) (Fougnie et al., 2007) and that ofthe failed Glory satellite (Mishchenko et al., 2007). The simulated observations of the TOA reflectances were constrainedto be located over N. America and were thus all over land.All simulated observations and radiative transfer calculationswere made at a wavelength of 650 nm. One simulated satellite, based on specifications of the MODIS instrument aboardthe Aqua satellite, is constrained to intensity measurements,while a second simulated satellite is assumed to be capable ofpolarimetric measurements. Though typical satellite instruments capable of polarimetric measurements (i.e., POLDERor APS) include multi-angle measurement capabilities, tohighlight differences in the sensitivities due to intrinsic differences in the intensity-based and polarized reflectance, theviewing zenith angle is constrained to zero degrees for boththe radiant and polarized reflectance calculations. This maynot be an unrealistic constraint on these calculations as thereis currently a polarimetric sensor that is only able to measure the polarized reflectance from a single viewing angle,the Global Ozone Monitoring Experiment (GOME-2) instrument on board the MetOp-A and MetOp-B satellites (Callieset al., 2000). We have explored changes to the sensitivities resulting from the implementation of multiple viewing anglesin the polarimetric simulated satellite, though do not presenta rigorous treatment of that case in this work.The single particle light scattering properties of theaerosols were calculated using the Mie theory and assumespherical particles. The sensitivities of the top of atmosphere(TOA) Stokes parameters, from which the reflectances arederived, to aerosol concentrations and microphysical properties are calculated using the Vector LInearized Discrete Ordinate Radiative Transfer (VLIDORT) model (Spurr, 2006)over the simulated satellite flight path. These results are usedas inputs to an adjoint model of the CTM to propagate sensitivities back to aerosol emissions. The overall modelingframework is described in Sect. 2, with additional background on the derivation of the sensitivity equations providedas an Appendix. Section 3 contains specific model configurations used in these calculations as well as details of the simulated satellite observations. Results are included in Sect. 4,followed by discussion and conclusions in Sect. 5.www.atmos-meas-tech.net/6/3441/2013/
B. S. Meland et al.: Assessing remote polarimetric measurement sensitivities23443TheoryDetermination of the sensitivity of the TOA reflectance toatmospheric aerosol properties and emissions is performedusing a coupling of the GEOS-Chem forward and adjointchemical transport models (Bey et al., 2001; Henze et al.,2007), a vectorized linear radiative transfer model, VLIDORT (Spurr, 2006), modified to incorporate MODIS datafrom the Aqua satellite, MARIA (MODIS AOD Retrieval byan Improved Algorithm) (Wang et al., 2010), and a linearizedMie light scattering algorithm (Spurr et al., 2012). A flowchart of the model components and their inputs and outputsis shown in Fig. 1. In that diagram, the red boxes correspondto external model inputs such as meteorological parameters,surface reflectances, and satellite position. Blue boxes correspond to the model calculations, and green boxes representmodel outputs.Here we describe the basic structure and relevant inputsto the models used to calculate the sensitivities of TOA reflectance. The GEOS-Chem CTM is described in Sect. 2.1.In Sect. 2.2, the radiative transfer model and the methods forthe calculation of the sensitivity of the TOA Stokes parameters to aerosol concentration and microphysical parametersare described. The adjoint of the GEOS-Chem model is detailed in Sect. 2.3 along with methods for determining thesensitivity of the Stokes parameters to emissions. From theStokes sensitivities, we calculate the sensitivities of the radiant reflectance and polarized reflectance to aerosol loading,emissions, and microphysical properties.Fig. 1. Flow chart of the chemical transport, radiative transfer, andadjoint models used in this work. Red boxes correspond to externalmodel inputs, blue to the model itself, and green for model results.2.12.2GEOS-chemAtmospheric aerosol concentrations are calculated using theGEOS-Chem global three-dimensional chemical transportmodel (Bey et al., 2001) driven by GEOS-5 meteorologicalreanalysis fields from the Global Modeling and AssimilationOffice (GMAO), degraded to 4 5 horizontal resolution ona 47 layer vertical grid extending up to 0.01 hPa. The transport time step is 30 min and aerosol concentrations are calculated for each hour of the simulations. Model simulationsinclude gas-phase NOx -Ox -VOC photochemistry (Bey et al.,2001) coupled with formation of sulfate, nitrate, ammonium,and carbonaceous aerosols, which are determined on a globalscale using methods developed by Park et al. (2003, 2004).Simulations of mineral dust and sea salt aerosols are based onthe works of Fairlie et al. (2007) and Alexander et al. (2005)respectively. Dry deposition is calculated using a resistancein series approach (Wesely, 1989; Wang et al., 1998) and wetdeposition and scavenging of aerosols and trace gases are accounted for (Liu et al., 2001; Mari et al., 2000).Emissions are taken from the following inventories.Global anthropogenic emissions of NOx , CO, and SOx areobtained from the Emissions Database for Global Atmospheric Research (EDGAR; Olivier and Berdowski, 2001),which is overwritten by regional emissions as follows: s are used over Europe, BRAVO over Mexico,Street et al. (2006) over S.E. Asia, CAC over Canada,NEI 2005 over the United States, and global emissions ofcarbonaceous aerosols are from Bond et al. (2007). Biofuel emission inventories are obtained from Yevich and Logan (2003). Contributions from biomass burning are takenfrom GFED v2 (van der Werf et al., 2006). Emissions of biogenics are taken from MEGAN v1.2 (Guenther et al., 2006).NOx emissions from lighting are determined using the algorithm of Price and Rind (1992).Radiative transfer algorithmThe Stokes vector, S, completely describes the polarizationstate of electromagnetic radiation. The Stokes vector of scattered light at TOA depends upon the bulk optical propertiesof the atmosphere it passes through. These properties includethe extinction optical depth, τ , the single scattering albedo,ω, the scattering matrix, F , as well as the scattering geometry (viewing angle and solar angle, relative azimuth angle).These bulk properties in turn depend upon the optical properties (τi , ωi , F i ) of the individual aerosol and molecularspecies present in the atmospheric column through whichthe light passes. The species specific optical properties arefurther dependent on the aerosol concentrations and microphysical properties (Bohren and Huffman, 1983).A total of seven aerosol species are considered in the radiative transfer calculations including organic and black carbon(hydrophilic and hydrophobic), sulfate, nitrate, and ammonium. Aerosols are approximated as spherical and the Mietheory is used to calculate their optical properties assumingthe aerosols are externally mixed. Inputs to the Mie algorithm include the complex refractive index, n ik, and theaerosol size distribution. The size distribution is parameterized in this model by assuming a log-normal distribution defined by the effective radius, reff , and the effective variance ofAtmos. Meas. Tech., 6, 3441–3457, 2013
3444B. S. Meland et al.: Assessing remote polarimetric measurement sensitivitiesthe size distribution, νeff . These Mie calculations are repeatedfor seven different values of the relative humidity, RH (0, 50,70, 80, 90, 95, and 99 %). The aerosol properties, refractiveindex and size parameters, are adjusted to account for water uptake on the surface of the particles for each RH value.These RH dependent aerosol parameters are taken from theGlobal Aerosol Data Set (GADS) (Martin et al., 2003). Acomplete list of these input parameters used in these calculations for all aerosol species is included in Table 1. For thecases of hydrophilic aerosols, these parameters are shownfor 70 % RH. The Mie code used here is linearized and isable to numerically calculate the derivatives (Jacobians) ofthe optical properties with respect to the aerosol property inputs. The optical properties (and their corresponding derivatives) calculated by the Mie code include the single scattering albedo, the extinction optical depth, and the scatteringmatrix for each aerosol species. All optical properties werecalculated assuming a wavelength of 650 nm.The single scattering optical properties from the Mie codeand the aerosol concentrations from the GEOS-Chem modelare used as inputs to the radiative transfer model, MARIA(MODIS AOD Retrieval by an Improved Algorithm; Wanget al., 2010), which is an adaptation of the VLIDORT model(Spurr, 2006, 2008). The aerosol contribution to the extinction optical depth, single scattering albedo, and scatteringmatrix expansion coefficients are determined for each atmospheric layer using the optical properties for each aerosolspecies generated using the Mie theory using methods discussed in the Appendix (Eqs. A6–A8).Molecular light scattering is calculated using applicationsof Rayleigh scattering theory as implemented by Bodhaineet al. (1999). Refractive indices, depolarization ratios, andlight scattering cross sections of air are first calculated usingestimates of the relative composition of dry air. From these,gaseous contributions to the extinction optical depth, singlescattering albedo, and scattering matrix are estimated. A total of 20 atmospheric layers are used in these calculations inorder to significantly reduce the computational requirementsof the radiative transfer calculations. Aerosol concentrationsfrom the GEOS-Chem model were interpolated onto this 20layer grid from the 47 layer native grid prior to being usedin the calculations. The VLIDORT model uses these valuesto calculate the full Stokes vector at the TOA. Though thefull Stokes vector is calculated, we neglect any contributionsfrom circularly polarized light in our calculations of the polarized reflectance. This contribution tends to be negligibleand is typically not measured by remote polarimetric sensors(Fougnie et al., 2007; Mishchenko et al., 2007).MODIS data used in this model are obtained from theLevel 1 and Atmosphere Archive and Distribution System(LAADS) of the NASA Goddard Space Flight Center. Level2 aerosol data from the Aqua satellite was restricted to thatover the same time period of the GEOS-Chem simulationand to the North American region. Parameters used from theMODIS data include the viewing geometry of the satelliteAtmos. Meas. Tech., 6, 3441–3457, 2013(viewing angle, solar position relative to the viewing angle, and geolocation) as well as surface reflectivities for the646 nm wavelength channel. The surface reflectances fromMODIS are used to constrain the amplitude of the surfacereflectance and a bidirectional reflectance distribution function, BRDF, is calculated by a VLIDORT subroutine in order to account for surface geometry effects (shading, viewing angle, etc.). The surface reflectivities used in the radiative transfer calculations are shown in Fig. 2. These valueshave been averaged over the over the two weeks of the modelrun. For this figure, the reflectivities have been degraded to4 5 horizontal resolution for comparison with the adjointsensitivities discussed in Sect. 2.3. In this work, the zenithangle was constrained to zero degrees for both the intensityand polarimetric calculations of the reflectances. A brief discussion of the effects of including multiple viewing anglesin these sensitivity studies is included in Sect. 5. Calculations of the TOA reflectances were performed on a pixelby-pixel basis. Since the MODIS data files each contain alarge amount of pixels ( 25 000), it was necessary for computational tractability to sub-sample the MODIS grid prior tothese calculations.2.3Sensitivity calculationsThe derivatives of the TOA Stokes parameters with respect S S Sto the atmospheric optical properties (i.e., ω τ , and F ) arecalculated in the radiative transfer model at each atmosphericlayer using a Taylor series expansion of the radiation field,keeping only the first term in the expansion (Spurr, 2006).For this work, we examined the sensitivities of both the radiant reflectance, RI , as well as the polarized reflectance, Rp .These quantities are defined in terms of the Stokes parameters in the Appendix (Eqs. A3, A4). It should be reiteratedhere that contributions from the circularly polarized component of S are not used in the calculation of the polarized reflectance. Rp only contains the contributions from linearlypolarized light. In the following derivations, we will use R tomean either the radiant or the polarized reflectance in caseswhere equivalent expressions exist for each. The derivativesof the Stokes parameters are used to calculate the deriva R Rtives of the reflectances ( R ω τ , and F ). These values arethen used, along with the derivatives determined in the MiedτidFiicode ( dωdxi , dxi , and dxi ), to generate the sensitivities of theTOA reflectance with respect to the aerosol concentrations,Eq. (1), or microphysical properties, Eq. (2), of each aerosolspecies in each atmospheric layer:dR R dω R dτ R dF dCi ω dCi τ dCi F dCi,dR R ω dωi R τ dτi R F dFi ,dxi ω ωi dxi τ τi dxi F Fi dxi(1)(2)where xi represents any of ni , ki , reff,i , and νeff,i and thesubscript i is the aerosol species. Evaluation of the terms onwww.atmos-meas-tech.net/6/3441/2013/
B. S. Meland et al.: Assessing remote polarimetric measurement sensitivities3445Table 1. Aerosol microphysical properties used in the Mie calculation of aerosol properties. Values are given for the complex refractiveindex, m, and the effective radius and variance, reff and νeff , of the aerosol size distribution assuming a log-normal distribution. Values aretaken from the Global Aerosol Data Set described in Koepke et al. (1997). For the case of hydrophilic aerosols, values are only shown for70 % AmmoniumInorganic sulfur nitratesBlack carbon (hydrophilic)Organic carbon (hydrophilic)Black carbon (hydrophobic)Organic carbon (hydrophobic)m n ikreff (µm)νeff1.36 0.00i1.36 0.00i1.36 0.00i1.75 0.44i1.41 0.00i1.75 0.44i1.53 250.250.250.250.25model: cn J J cn T NXn0 n0 J n cn!T λnc ,(4)where λnc is the adjoint state variable. Using the chain rule,Eq. (4) can be expanded to show the dependence of the costfunction to concentrations at all earlier time steps, n T J cn 1 T n 1nλc λc cn cn T cn 1(5) λn 1 gn.c cnFig. 2. Surface reflectivities over N. America for 646 nm incidentradiation. Reflectivities have been averaged over the two week period of the model run.the right hand sides of Eqs. (1) and (2) is discussed in theAppendix.The GEOS-Chem adjoint model (Henze et al., 2007) isused to relate the sensitivities from Eq. (1) back to sensitivities with respect to emissions. In general, an adjoint model isused to calculate the dependence of metrics based on modeloutput values (i.e., averaged polarized or radiant reflectances)to a set of input parameters (in this case, emissions). A fulldiscussion of adjoint modeling can be found in works suchas Giering and Kaminski (1998) or Sandu et al. (2005); herewe present a brief summary. The goal of an adjoint model isto find the sensitivity of a scalar cost function, J , to a set ofmodel parameters. Following the work of Henze et al. (2007,2009), let cn be a state vector of the aerosol concentrationsat a certain model time step, n. The forward GEOS-Chemmodel, F , advances the state vector by one time step.cn 1 F (cn )(3)This process is repeated until the model reaches the final timestep, N, and the output aerosol concentration, cN . The goalis to determine the gradient of the cost function, evaluatedwith respect to the state vector at all other time steps in thewww.atmos-meas-tech.net/6/3441/2013/The dependence of the cost function to the concentrationsat the current time step is described by the adjoint forcing,g n . The approach to calculating the dependence of the costfunction on the model inputs, such as initial concentrationsor emissions, is to initialize the adjoint variable at the finaltime step (the adjoint forcing, λNc ), and then apply Eq. (5)iteratively for n N, N 1, . . . 1.For this work, the cost function is defined as the spatiotemporal average of all model predictions for the TOA radiant reflectance or polarized reflectance calculated in the radiativetransfer model as discussed in Sect. 2.2.1 X1 XJ RI,n or J RP ,n(6)NRT nNRT nThe corresponding adjoint forcing terms are the derivativesof the cost function with respect to aerosol concentrations, n T n T RI RP11gn or g n ,(7)NRT cnNRT cnwhere NRT is the number of radiative calculations of the polarization or intensity used in the adjoint calculations and thesummation n is over the temporal and spatial extent of theradiative transfer calculations, i.e., over each simulated observation throughout the two week time period of the simulation. As can be seen in Eq. (7), it is first necessary to calculate the sensitivities with respect to the aerosol concentrations (Eq. 1) in order to determine the adjoint forcing terms.Atmos. Meas. Tech., 6, 3441–3457, 2013
34463B. S. Meland et al.: Assessing remote polarimetric measurement sensitivitiesModel configurationsHere we describe model settings, input parameters, and simulated observations that were used in the model runs. All simulations spanned a two week period running from 1 April 2008to 15 April 2008. Aerosol concentrations for seven aerosolspecies are calculated by GEOS-Chem on a 4 5 resolution global grid. The reflectances at TOA along with the relevant Jacobian matrices are calculated over the two week timeframe. Data is constrained to regions over N. America. Surface reflectivities are derived using a 40 day rolling averageof the reflectivities from the MODIS level 4 data product.This is done on a pixel-by-pixel basis for the MODIS inputdata, using two evenly-spaced simulated satellite observationgrids discussed below.Two different simulated observation grids are used in theradiative transfer calculations (see Fig. 3) in order to modeltypical instrumental specifications from satellites able tomake intensity-based (MODIS, MISR) or polarimetric observations (POLDER, APS). The first is an evenly spacedgrid where pixels are sampled from every 20th column and20th row of the MODIS native grid. This grid will be referred to as the wide-swath grid. A second grid is generated to be similar to that of the failed Glory satellite, whichwas to have a much narrower ground track, only 5.6 kmwide (Mishchenko et al., 2004, 2007). An alternative approach would have been to approximate the much wider observational swath of the POLDER instrument, 1600 km(Fougnie et al., 2007; Tanré et al., 2011). We chose to modelthe APS instrument for this work as it can be seen as a moreextreme example of a possible limitation in polarimetric asopposed to intensity based measurements. To simulate theGlory observational track in our model, the MODIS nativegrid is only sampled along the row directly below the satellite(row 68) and at every 20th column. This grid will be referredto as the narrow-swath grid. Two separate sets of reflectancesare then calculated, one for each grid. In each case, each pixelin each of the simulated observation grids is forced to passquality assurance tests (no null data, reasonable signal levels, etc.) and must meet clear sky criteria (cloud free) priorto being used in the calculations. Failure to pass these testsresulted in the removal of that pixel from the grid.For calculations of the sensitivities of the reflectanceto aerosol and aerosol precursor emissions, discussed inSect. 2.3, the adjoint model is run twice, once for each simulated satellite observation grid. The cost function, J , is defined based on the type of grid used in the radiative transfer calculations; see Eqs. (6) and (7). For the wide-swathgrid, the cost function is set equal to the average radiant reflectance over the North American region (i.e., the region forwhich the radiative transfer calculations are performed). Atotal of NRT 729 pixels from the wide-swath grid passedthe pixel quality checks for the radiative transfer calculations.For the narrow-swath grid, the polarized reflectance, ratherthan the radiant reflectance, is used for the cost function.Atmos. Meas. Tech., 6, 3441–3457, 2013Fig. 3. Simulated satellite grids used in the radiative transfer calculations. The wide-swath grid (blue) is based on the MODIS instrument specifications and was used for the intensity based calculations. The narrow-swath grid (red) is based on the APS instrumentaboard the failed Glory satellite and is used for polarimetric basedcalculations.Since this grid is narrower, fewer pixels were available foruse in the radiative transfer calculations, NRT 91.44.1ResultsSensitivity validationThe radiative transfer model has been verified by comparingthe analytic derivation of the reflectance sensitivities with respect to the aerosol concentrations, microphysical properties,and emissions (Eqs. 1, 2) to those generated using a secondorder finite difference (FD) test, as shown in Eq. (8) for concentrations,dRR(C δC) R(C δC) .dC2δC(8)For the validations of
The accuracy of remote retrieval of aerosol properties can be enhanced by utilizing measurements of the full po-larimetric state of light as well as spectral measurements (Chowdhary et al., 2005). Kokhanovsky et al. (2010) com-pared the capability of a number of retrieval algorithms (MODIS, MISR, AATSR, and POLDER algorithms) for de-