Transcription
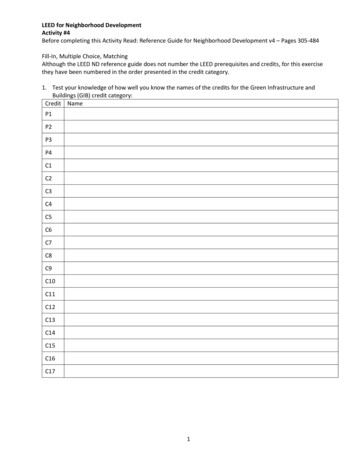
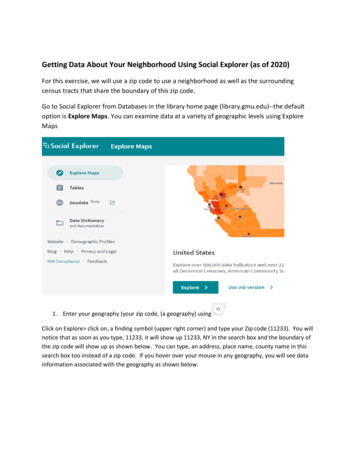
Getting Data About Your Neighborhood Using Social Explorer (as of 2020)For this exercise, we will use a zip code to use a neighborhood as well as the surroundingcensus tracts that share the boundary of this zip code.Go to Social Explorer from Databases in the library home page (library.gmu.edu)--the defaultoption is Explore Maps. You can examine data at a variety of geographic levels using ExploreMaps1. Enter your geography (your zip code, (a geography) usingClick on Explore click on, a finding symbol (upper right corner) and type your Zip code (11233). You willnotice that as soon as you type, 11233, it will show up 11233, NY in the search box and the boundary ofthe zip code will show up as shown below. You can type, an address, place name, county name in thissearch box too instead of a zip code. If you hover over your mouse in any geography, you will see datainformation associated with the geography as shown below.
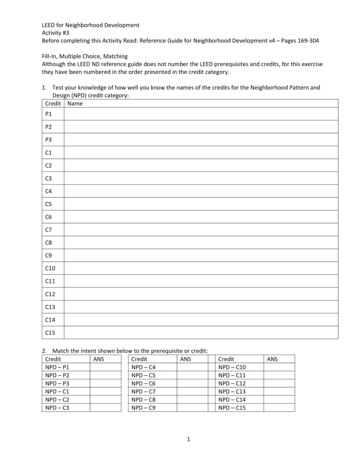
2. Select your topical variable.Click on the “Change data” tab after displaying your geography on map to pick up your own data(instead of the default data, population density). You have options to select a YEAR and Data(Census data or other data provided by Social Explorer). We will select 1990 and Race data forthis zip code area by Census Tracts.3. Select your census tracts for your geography and create a data report usingoptions)(more
Click on X after you finish the variable selection and then click on hamburger sign (),then click on the Current table selection (to get your race data). After you make sure you havethe chosen year and variable (in this case, Race).Next, useto select the geographies (the census tracts falling in a zip code, 11233boundary). Your map should look like this below. Your selected 22 census tracts can bedownloaded (click on the Download icon) for further use when you choose multiple variablesand multiple geographies (census tracts in this case) that you would like to add using Tablesoptions in Social Explorer. You will see then, the “Create” tab highlighted.
4. Next, click “Create” tab on the screen to get a report or download your data by choosing Excel
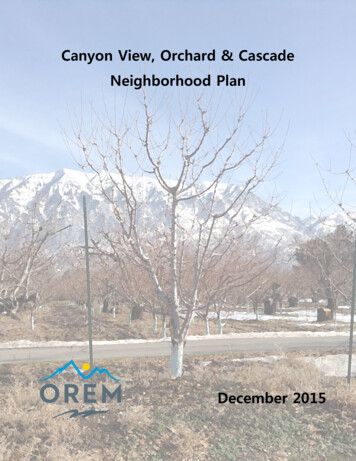
OR choose, Data Download check, “Output all geographic identifiers” if you want to work thistable in GIS, then choose a proper file format (csv, SAS, SPSS) that you are going to work withthis table.If you want to see a shore tutorial provided by Social Explore, click on “Take a tour” from thismore option in the right upper cornerAnother Option: Using Tables option to get your selected multiple data variables and multiplegeographies.1. Click on tables and click, US Decennial Census choose, 1990 and “Begin Report”
Select the 22 census tracts that youexplored and chosen from the ExploreMap option for the zip code, 11233, NY(use the list downloaded from the step 3of the Map option above)After you selected themultiple census tracts andclick on “Add”, then2. Next, choose your variables and click on Add. You can choose multiple variables here (notlike Map Explorer) as shown below. Then click on, Show results.
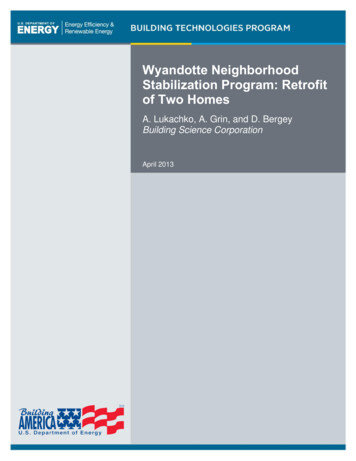
3. You will see the result like below. Click “Excel” or “Data Download”
Note: Hoover over . in the upper right of the home page. Click on “Help” or “Take a tour” foradvanced options provided by Social Explorer,For more options: https://www.socialexplorer.com/help/ Visualize Multiple Variables; alizing-data/visualize-multiple-variables Change Geography for Data Display: act: Joy Suh (hsuh1@gmu.edu) if you have any questions related to this guide.Created 5/2020. Digital Scholarship Center, George Mason University Libraries.
Getting Data About Your Neighborhood Using Social Explorer (as of 2020) For this exercise, we will use a zip code to use a neighborhood as well as the surrounding census tracts that share the boundary of this zip code. Go to Social Explorer from Databases in the library home page (library.gmu.edu)--the default option is Explore Maps. You can .