Transcription
FireEye and Splunk:Intro to Integration
Table of ContentsIntroduction. . . . . . . . . . . . . . . . . . . . . . . . . . . . . . . . . . . . . . . . . . . . . . . . . 3Current Integration Efforts. . . . . . . . . . . . . . . . . . . . . . . . . . . . . . . . . . . . 3Architecture Note. . . . . . . . . . . . . . . . . . . . . . . . . . . . . . . . . . . . . . . . . . . . 4FireEye LMS - Splunk Architecture: . . . . . . . . . . . . . . . . . . . . . . . . . . . 4Multiple FireEye LMS - Splunk Architecture:. . . . . . . . . . . . . . . . . . . 4FireEye CMS - Splunk Architecture:. . . . . . . . . . . . . . . . . . . . . . . . . . . 5Demo Setup. . . . . . . . . . . . . . . . . . . . . . . . . . . . . . . . . . . . . . . . . . . . . . . . . 6Download. . . . . . . . . . . . . . . . . . . . . . . . . . . . . . . . . . . . . . . . . . . . . . . . . . . 6Extract Splunk. . . . . . . . . . . . . . . . . . . . . . . . . . . . . . . . . . . . . . . . . . . . . . . 6Start Splunk . . . . . . . . . . . . . . . . . . . . . . . . . . . . . . . . . . . . . . . . . . . . . . . . . 6Creating Connectors . . . . . . . . . . . . . . . . . . . . . . . . . . . . . . . . . . . . . . . . . 7Splunk Listener . . . . . . . . . . . . . . . . . . . . . . . . . . . . . . . . . . . . . . . . . . . . . . 7FireEye Data. . . . . . . . . . . . . . . . . . . . . . . . . . . . . . . . . . . . . . . . . . . . . . . . . 8Examining a Raw Event. . . . . . . . . . . . . . . . . . . . . . . . . . . . . . . . . . . . . . 10How to Replicate a FireEye Dashboard . . . . . . . . . . . . . . . . . . . . . . . . 11Simple Searches. . . . . . . . . . . . . . . . . . . . . . . . . . . . . . . . . . . . . . . . . . . . . 11Piping Search Results. . . . . . . . . . . . . . . . . . . . . . . . . . . . . . . . . . . . . . . . 12Using Regular Expressions . . . . . . . . . . . . . . . . . . . . . . . . . . . . . . . . . . . 13Get the Event Type . . . . . . . . . . . . . . . . . . . . . . . . . . . . . . . . . . . . . . . . . 14Get the Event Time. . . . . . . . . . . . . . . . . . . . . . . . . . . . . . . . . . . . . . . . . . 15Using Conditionals. . . . . . . . . . . . . . . . . . . . . . . . . . . . . . . . . . . . . . . . . . 161 www.fireeye.com
If statement . . . . . . . . . . . . . . . . . . . . . . . . . . . . . . . . . . . . . . . . . . . . . . . . 16Case statement. . . . . . . . . . . . . . . . . . . . . . . . . . . . . . . . . . . . . . . . . . . . . 18Sorting Searches. . . . . . . . . . . . . . . . . . . . . . . . . . . . . . . . . . . . . . . . . . . . 19Multiple LMS sort by Time. . . . . . . . . . . . . . . . . . . . . . . . . . . . . . . . . . . 20Renaming the Columns. . . . . . . . . . . . . . . . . . . . . . . . . . . . . . . . . . . . . . 20Save As Dashboard Panel. . . . . . . . . . . . . . . . . . . . . . . . . . . . . . . . . . . . 22Time frames. . . . . . . . . . . . . . . . . . . . . . . . . . . . . . . . . . . . . . . . . . . . . . . . 23Parsing Other Formats. . . . . . . . . . . . . . . . . . . . . . . . . . . . . . . . . . . . . . . 24Quick Differences. . . . . . . . . . . . . . . . . . . . . . . . . . . . . . . . . . . . . . . . . . . 27Sample FireEye Dashboards. . . . . . . . . . . . . . . . . . . . . . . . . . . . . . . . . . 28wMPS (NX). . . . . . . . . . . . . . . . . . . . . . . . . . . . . . . . . . . . . . . . . . . . . . . . . 28Alerts - Alerts. . . . . . . . . . . . . . . . . . . . . . . . . . . . . . . . . . . . . . . . . . . . . . 28CEF: . . . . . . . . . . . . . . . . . . . . . . . . . . . . . . . . . . . . . . . . . . . . . . . . . . . . . . . 28CSV: . . . . . . . . . . . . . . . . . . . . . . . . . . . . . . . . . . . . . . . . . . . . . . . . . . . . . . . 28Alerts - Callback Activity. . . . . . . . . . . . . . . . . . . . . . . . . . . . . . . . . . . . 28CSV: . . . . . . . . . . . . . . . . . . . . . . . . . . . . . . . . . . . . . . . . . . . . . . . . . . . . . . . 28Panels to Enhance Visibility. . . . . . . . . . . . . . . . . . . . . . . . . . . . . . . . . . 29wMPS (NX). . . . . . . . . . . . . . . . . . . . . . . . . . . . . . . . . . . . . . . . . . . . . . . . . 29Conclusion . . . . . . . . . . . . . . . . . . . . . . . . . . . . . . . . . . . . . . . . . . . . . . . . . 30About the Author . . . . . . . . . . . . . . . . . . . . . . . . . . . . . . . . . . . . . . . . . . . 31Special Thanks . . . . . . . . . . . . . . . . . . . . . . . . . . . . . . . . . . . . . . . . . . . . . 31About FireEye . . . . . . . . . . . . . . . . . . . . . . . . . . . . . . . . . . . . . . . . . . . . . . 312 www.fireeye.com
IntroductionAre you a Splunk ninja that just purchased a FireEye appliance? If so, this paper should helpintroduce you to FireEye and Splunk integration options in less than an hour. The majority ofthis information is designed to walk the reader through building a dashboard while learning howto carve Splunk data. For those readers that want to quickly get to one possible end product,they should start with the “Sample FireEye Dashboards” section.Current Integration EffortsIf your organization is using the latest version of Splunk (6.x), try out our free FireEye App forSplunk Enterprise v3 (http://apps.splunk.com/app/1845/). This new app provides increasedflexibility by supporting multiple FireEye appliances as well as multiple protocols and formatsfor sending data to Splunk. This app may not be fully backward compatible because it takesadvantage of many Splunk 6.x features that were not previously available.If your organization is still using Splunk version 4.x or 5.x, you can easily download and usethe free--but unsupported--Splunk for FireEye v2 app to integrate the two technologies. ThisSplunk app utilizes and parses FireEye’s rich extended XML output. This downloadable app isavailable here: https://apps.splunk.com/app/409/.The rest of this article is written for those that want to start from scratch or start from oneof the above apps and learn to customize them. This article will outline various protocols andformats available from FireEye and explore the parsing options provided by Splunk.3 www.fireeye.com
Architecture NoteThe devices linked to Splunk will depend heavily on the environment’s architecture—mainly thenumber and type of appliances you have deployed. This may also have an effect on adding orremoving fields from our provided Splunk queries. Fortunately, Splunk is flexible allowing usersto choose the fields they want displayed. Let’s quickly review what your architecture may looklike.FireEye LMS - Splunk Architecture:This is the smallest architecture because there are only one or two FireEye devices with noCMS. In this case the event IDs in the FireEye Local Management System (LMS) Appliances willmatch the event IDs in Splunk. Additionally, the source appliance field may not be as importantwith one FireEye sensor because it will be evident which appliance the event originated from.This will all make more sense later.Having only one appliance may be somewhat of a rare deployment unless it is a fairly smallorganization or sub organization. Due to the limitations of our test environment, we developedmost of the dashboards in this type of a setup, however, we added the field for originatingappliance in the enhanced queries for clients that have multiple appliances.Multiple FireEye LMS - Splunk Architecture:This architecture is currently required even if a CMS is present because the CMS itself cannotyet send notifications—it instructs each LMS to do so. With multiple appliances sending events,we want our Splunk search to identify the appliance that witnessed the event. Advantage: EventIDs in LMS and Splunk will match. Event notification does not have to go to CMS first, whichmay be slightly faster. Disadvantage: Events IDs in CMS and Splunk will not match.4 www.fireeye.com
FireEye CMS - Splunk Architecture:This architecture has become a possibility in the 7.1 version of the FireEye CMS. It functionssimilarly to the first architecture where only one LMS is feeding the Splunk receiver. Advantage:Event IDs in CMS and Splunk will match. Disadvantage: Event IDs in LMS and Splunk will notmatch.5 www.fireeye.com
Demo SetupIf you are looking to demo Splunk to see how it fits in your environment, you can download afree trial to try it out before you buy it. For our demonstration purposes, we installed Splunk ona Kali Linux VM that we had sitting around. To download and install your free trial of Splunk, usethe following steps:Download Go to: http://www.splunk.com/download Register for a free account Download the appropriate package-- Kali 32-bit VM uses: splunk-6.0.1-189883-Linux-i686.tgz Drag and drop the tgz into VMwareExtract Splunk tar -zxvf splunk-6.0.1-189883-Linux-i686.tgz -C /opt-- Splunk is now extracted to /opt/splunkStart Splunk /opt/splunk/bin/splunk start Accept the EULA and you can now use Splunk6 www.fireeye.com
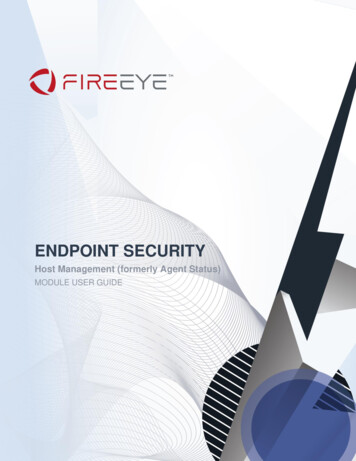
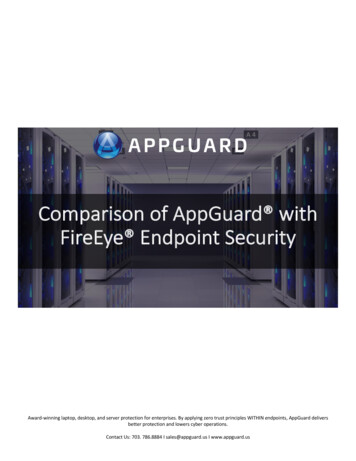
Creating ConnectorsNow that we have Splunk ready to go, we have to create the connection between the FireEyeand Splunk devices. This involves creating a Splunk listener and configuring the FireEye deviceto send the data.Splunk ListenerThe Splunk listener needs to be configured so it can receive data from other devices. Performthe following steps to create the listener:Log into the web UI using a web browser: http:// SplunkBox :8000 username: admin password: changeme*Note: It will prompt you to change the password upon first login.Set up the Splunk listener: Click the “Add Data” button Select “Syslog” Select “Consume syslog over UDP” Enter “514” for the port and click the “Save” button Click the “Back to home” linkBoth FireEye and Splunk allow syslog over TCP as well. There is more overhead, but also morereliable.Figure 1: Adding a data connector in Splunk7 www.fireeye.com
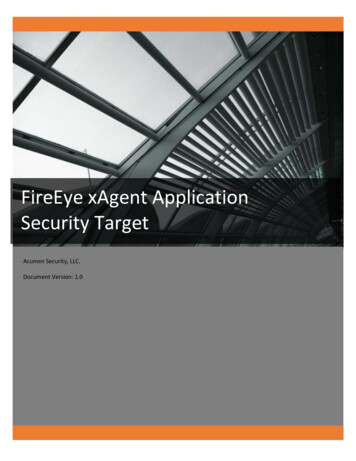
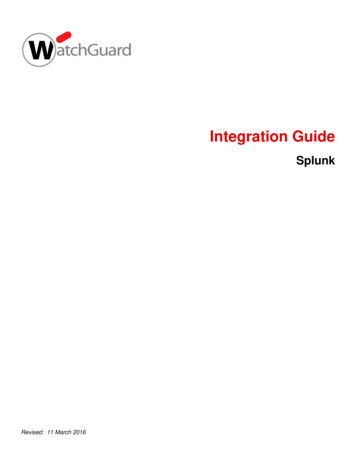
FireEye DataNow that Splunk is listening and ready for data, we have to configure FireEye to send syslogdata to the connector. The FireEye appliances are very flexible regarding Notification output andsupport the following formats under syslog:CEFText – NormalJSON – NormalXML – NormalLEEFText – ConciseJSON – ConciseXML – ConciseCSVText –ExtendedJSON –ExtendedXML –ExtendedFor our tutorial, we will use CEF — but it does not mean that it is the best format. It is justone possible option (see the “Parsing Other Formats” section for more details). Complete thefollowing steps to send data to Splunk using CEF: Log into the FireEye appliance with an administrator account Click Settings Click Notifications Click rsyslog Check the “Event type” check box Make sure Rsyslog settings are:-- Default format: CEF-- Default delivery: Per event-- Default send as: AlertNext to the “Add Rsyslog Server” button, type “Splunk”. Then click the “Add Rsyslog Server”button. Enter the IP address of the Splunk server in the “IP Address” field, and click the “Update”button below. Change the protocol dropdown to TCP if you decided to use TCP when setting upthe Splunk receiver.8 www.fireeye.com
Figure 2: Steps to configure the FireEye appliance to send data to SplunkNow you can test the sending and receiving of notifications on the same FireEye Notificationspage by clicking the “Test-Fire” button at the bottom. Flip back over to the Splunk interface andcheck out the raw event data.9 www.fireeye.com
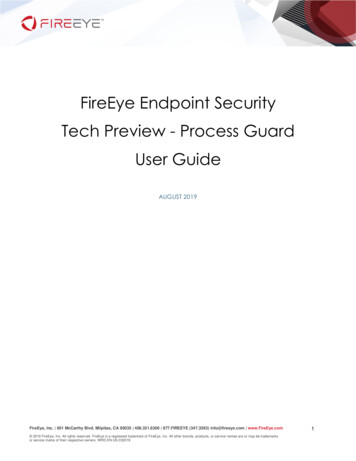
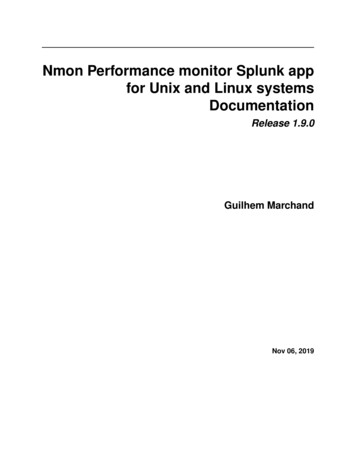
Examining a Raw EventNow that the connectors are set up, we can view the raw data.Figure 3: The Splunk dashboard now shows eventsAfter clicking on the Data Summary button, you can see the raw CEF events. They will looksomething like the following:Feb 2 11:57:59 192.168.33.131 fenotify-2.alert: CEF:0 FireEye MPS 6.2.0.74484 WI web-infection 5 rt Feb 02 2014 16:57:47 Zsrc 169.250.0.1 dpt 20 shost OC-testing.fe-notify-examples.comproto tcp dst 127.0.0.20 dvchost WebMPS cs3Label osinfo cs3 FireEyeTestEvent OS Info filePath compl 0 2- someurl.x1y2z3.com spt 10dvc 192.168.33.131 smac XX:XX:XX:XX:XX:XX cn1Label vlan cn1 0externalId 2 cs4Label link cs4 https:// WebMPS.localdomain/eventstream/ events for bot?inc id\ 2 dproc IEx123 dmac XX:XX:XX:XX:XX:XXcs2Label anomaly cs2 anomaly-tag datatheft keylogger cs1Label snamecs1 FireEye-TestEvent-SIGdpt 20 dst 127.0.0.20 proto tcp spt 10 src 169.250.0.1At first when looking at this data, it looks a bit confusing. Fortunately, the Splunk dashboardhighlights and separates the data so it is a little easier to view and understand.Figure 4: Search term and mouse over highlighting10 www.fireeye.com
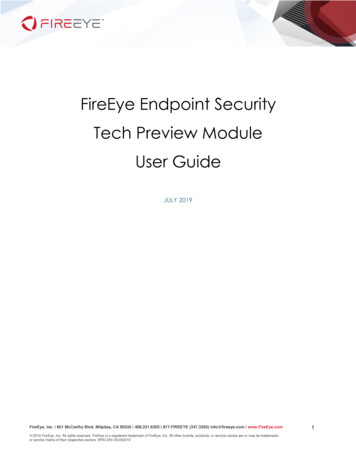
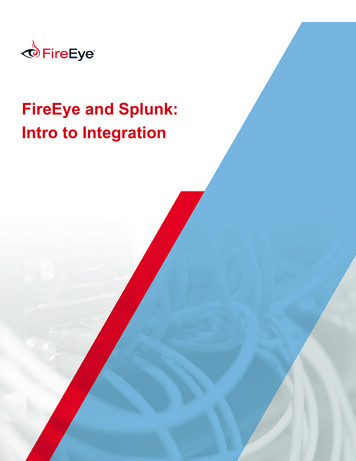
How to Replicate a FireEye DashboardNow that we have data in Splunk, we need to figure out how to carve it up. Our example belowwill use alert data from a FireEye Web MPS (NX platform).Simple SearchesSplunk’s search capability is quite powerful. Searching can be as simple as you like — just using akeyword or two — or it can be complex, using pipes, regular expressions, and built-in functions.Try using the search term FireEye in Splunk. It should return FireEye events. This is great, butbe careful using such a simple search because you may get unintended results of other logs thatcontain the word “FireEye”.Instead, try using: CEF:0\ FireEyeRemember that the pipe is a reserved character to Splunk so we have to escape it using abackslash (\). This will look for "CEF:0 FireEye" in the packet, which ensures that the searchresult will at least be a CEF packet from a FireEye device.Figure 5: Using the more specific CEF search, we are ensuring that we receive the specific packets of interest.11 www.fireeye.com
Piping Search ResultsNow that we know how to find the relevant FireEye CEF packets, we only want to select therelevant columns—not all of them. For this, we will use a pipe in the Splunk search bar.A FireEye wMPS Alert Dashboard contains the following columns:Type, ID, File Type (FT), Malware (name), Severity, Time (UTC), Source IP, Target IP, URL/MD5,LocationFigure 6: FireEye event fields of interestNot all of these fields are passed in the CEF packet though. So we should first create a map ofWeb MPS dashboard fields to Splunk parsed fields. We have done so in the table below:FireEye fieldTypeIDFile TypeMalwareSeverityTime (UTC)Source IPTarget IPMD5URL (malware callback, domain match, malware object)URL (web infection)Location12 www.fireeye.comSplunk fieldNot a parsed fieldexternalIdNot sentcs1Not parsed without some helpNot a parsed fieldsrcdstfileHashcs5filePathNot sent
So far, we cannot do much about information that is not sent in the CEF packet becausethe data does not exist in Splunk. The information that is present but not parsed as a Splunkfield can be extracted using regular expressions, which we will talk about in the next section.However, all of the remaining information that is parsed by Splunk is easily accessible anddisplayed by piping the field name to the table command as shown in the example below:Ex: CEF:0\ FireEye table externalId,cs1,src,dst,fileHash,filePath,cs5Figure 7: A simple pipe to table will format the fields in a similar fashion to the FireEye dashboardNot a bad start for accessing fields that are already parsed by Splunk. We are only missing Type,FT, Severity, Time, and Location. Severity requires regex parsing and a lookup table which isbeyond the scope of this article. For now, let's look at parsing the Type and Time fields.Using Regular ExpressionsSince some of the data we are interested in is not parsed as a field (event type and event time),we must use regular expressions to extract these fields. If you are a regex ninja, feel free touse your powers for good and get the data you need. If not, no big deal — Splunk includes aninteractive field extractor feature that will build the regex needed to extract data of interest. Touse this field extractor, perform the following: Search for the event you are interested in: CEF:0\ FireEye Click the black arrow next to an event to drop down the details Event Actions - Extract fields Highlight one of the event types and copy and paste it into the example value box Click generate and verify the accuracy of the regex by looking at the highlighted values on therightWe will do this for both the event type and event time.13 www.fireeye.com
Get the Event TypeEx: Domain MatchInteractive field extractor result: (?i)\ .*?\ (?P FIELDNAME [a-z] \-[a-z] )(? \ )Figure 8: The field extractor created an accurate regex to obtain the event type fieldNow we can plug the regex into the rex command and surround it with quotes to make itfunctional. Ex: rex "(?i)\\ .*?\\ (?P FIELDNAME [a-z] \\-[a-z] )(? \\ )"Note that we can change FIELDNAME to whatever we wish, and we can access the field later byusing the unique name we provide.14 www.fireeye.com
Get the Event TimeThere are two times in the CEF packets. In this case we are interested in the FireEye event time,not the time that Splunk received the event (Splunk time is accessible by referencing the timefield). When we use the Interactive field extractor for the FireEye time, it yields the followingregex:"(?i)\ rt (?P FIELDNAME . ?)\s \w "Now that we have the Event type and the Event time, let’s put it all together. Since we feel the5-tuple data is useful for event correlation, we will add in protocol, source port, and destinationport as a bonus to our new dashboard:CEF:0\ FireEye rex "(?i)\\ .*?\\ (?P Type [a-z] \\-[a-z] )(? \\ )" rex"(?i)\ rt (?P Time . ?)\s \w " table Type,externalId,cs1,Time,proto,src,spt,dst, dpt,fileHash,filePath,cs5Figure 9: Our dashboard is closer to completion as we add the type and time fields15 www.fireeye.com
Using ConditionalsIf you did not notice, the FireEye appliance dashboard combines the field that contains theMD5 hash and URL. The data that is populated in that field depends on the event type. If it isa “Malware Object” event type, the “URL/Md5sum” field contains an MD5 hash. If it is anotherevent, it contains a URL. The problem that we have is that not all events use the same field for aURL. A web infection event uses the filePath field. Malware Callback, Domain Match, MalwareObject use the cs5 field (which is not displayed on the FireEye dashboard. We can either have3 separate fields on our dashboard (fileHash, filePath, and cs5) or we can find a way to useconditional statements in Splunk to combine th
username: admin password: changeme *Note: It will prompt you to change the password upon first login. Set up the Splunk listener: Click the “Add Data” button Select “Syslog” Select “Consume syslog over UDP” Enter “514” for the port and click the “Save” button Click the “Back to home” link