Transcription
International Journal of Applied Engineering Research ISSN 0973-4562 Volume 14, Number 24 (2019) pp. 4492-4501 Research India Publications. http://www.ripublication.comThe Effect of Using Technical and Fundamental Analysis on theEffectiveness of Investment Decisions of Traders on the Egyptian StockExchangeBassam A. ElbialyAssistant Professor of Finance, Faculty of Applied Studies & Community Service,Imam Abdulrahman Bin Faisal University, Dammam 31441, P.O. Box 1982, Saudi Arabia.or stay as it is. The basic analysis studies all the factors thataffect the price in the market with a view to determining the fairvalue of the share, and the basic analysis determines the fairvalue of the share through the law of supply and demand. If thefair value of the share is less than its current price in the market.this means that the price in the market is exaggerated in its riseand this stock must be sold and if the fair value is higher thanthe current price of the share. this means that the share price isexaggerated in its decline and this stock must be purchased[1].Abstract:The approach used by the traders plays an important role in theeffectiveness of their investment decisions. as after drawing asample of individual traders on the Egyptian Stock Exchange.it became clear that the percentage of traders whose investmentdecisions are effective (who achieved a rate of return above theaverage market return during a full year) is only 5% of the totalsample. which Motivated researcher to try to identify whetherthe traders use of fundamental analysis tools and technicalanalysis tools can help them to increase the effectiveness oftheir investment decisions.so, this research aims to identify theimpact of traders' use of basic analysis tools and technicalanalysis tools on the effectiveness of their investment decisionson the Egyptian Stock Exchange in order to define the approachthat can be used to serve traders to make effective investmentdecisions in the capital market. "In order to achieve this goal,the researchers tested the following hypothesis. There is nosignificant effect of the traders’ use of fundamental analysistools and technical analysis tools on the effectiveness of theirinvestment decisions on the Egyptian Stock Exchange and theresult of testing this hypothesis confirmed that there issignificant impact of traders' use of fundamental analysis toolsand technical analysis tools on the effectiveness of theirinvestment decisions on the Egyptian Stock Exchange, andtherefore we recommend traders to use fundamental analysistools and technical analysis tools to make effective investmentdecisions in Egyptian Stock Exchange.Keyword: Fundamental analysis;Investment decisions, trading.1.TechnicalThere are two approaches to the fundamental analysis.1.1.1. Top-Down: This Approach begins with an analysis ofthe economic conditions then the industry then the company.this Approach is usually used if there is no specific share in themind of the trader and searches for the best stock to invest inand on this basis the basic fundamental logically grades fromthe generalities of the specificities where the trader examinesthe following.Economic environment: To infer the future directionof stock prices. For example, high interest rates andincreased inflation are an indication that stock priceswill decrease. Industry conditions: The examination of industryconditions is due to the fact that industries showdifferent reactions to changes in the economicenvironment. so, the demand for high-pricedcommodities such as cars, home appliances and realestate tends to respond significantly to changes in thelevel of economic activity, while the demand for otherproducts such as necessities is less in response tochanges in economic activity. Organization conditions: As what applies to industryand the economy in general may not apply to aparticular organization, some organizations have poorperformance even during periods of economicprosperity. for example, in the eighties the Americancompany continued to achieve losses while otherairlines achieved Many record profits and vice versaas well as some organizations thrive in times ofeconomic recession, and these securities may be agood opportunity to buy even if it appears that thewhole market will decline.analysis;INTRODUCTIONThe approach is the one through which the trader can reach ananswer to a very important question which is Do I open a longor short position now? Knowing that there is no trader who canlearn all the methods through which this question can beanswered. where the markets flow from it There is an enormousamount of information and there are two types of analysis thattraders use to collect and analyze this information in order tohelp him make market decisions.1.1. Fundamental AnalysisThe fundamental analysis focuses on the economic strength ofsupply and demand that leads to price movements to rise, fall,4492
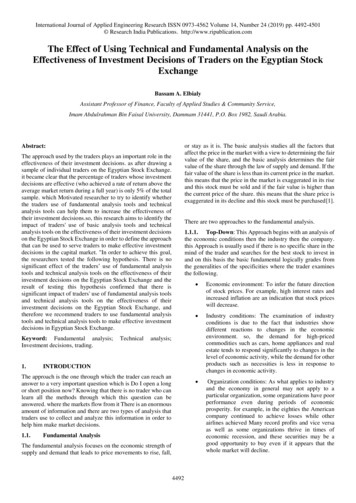
International Journal of Applied Engineering Research ISSN 0973-4562 Volume 14, Number 24 (2019) pp. 4492-4501 Research India Publications. http://www.ripublication.com1.1.2. Bottom-Up: It begins with analyzing the shares of aparticular company we want to make a decision to invest in,then analyzing the industry to which the company belongs andfinally analyzing the general economic conditions to reach thereal value of the security. We will briefly address the mostimportant elements of the fundamental analysis, as follows[2].trends in the company's performance during the pastyears and compare it to the average performance of theindustry during those years [3].The financial ratiosrequired to analyze the financial position of thecompany are Liquidity ratios which used to measurethe company's ability to meet short-term obligationswithout delay. Activity ratios which used to measurethe rotational speed of different assets such asaccounts receivable, inventory and fixed assets. Debtuse ratios which used to measure the degree of acompany's use of debt to finance its various assets inaddition to its ability to cover the interest of that debt.Market value ratios which used to identify theinvestor’s assessment of the company’s performanceby identifying the relationship between the marketvalue and the book value of the stock. ProfitabilityRatios which used to measure the company's ability toobtain a sufficient return on sales[4].1.1.2.1. Analysis of economic variables: The economicanalysis represents the first step in the fundamental analysis asit analyzes the largest and broader environment for the capitalmarket and there are multiple economic variables that the tradermust take into account for its tangible impact on the capitalmarkets include the following. Monetary policy. Financial policy. Inflation and deflation. Gross domestic product1.1.2.2. Industry analysis: The analyst at the beginning mustdefine the industry and its location in relation to otherindustries. Defining the industry on the basis of the product itprovides may make competition come from industries that donot fall within the same sector. The analyst needs to carry out aclassification process for industries, their impact on theeconomic situation. the relationship between the industry andother industries. the impact of the business cycles on each ofthem and the degree of government intervention in each ofthese industries. The process of analyzing the industry shouldinclude the following. Evolution of sales and profits. Evolution of demand and supply. competition conditions. Industry technology and product nature. Government intervention. Consumption trends. The relationship between stock prices and profits[2].1.2.[5] defines technical analysis as the study of any marketthrough the use of price information and the amount of tradingin order to predict a change in the direction of price in thefuture, as it [1] defines it as the study of price information, theamount of trading and existing deals in order to predict the pricetrend in The future, and therefore the trader can use technicalanalysis to predict the direction of prices in the future and thusachieve effectiveness in his decisions. The following is adetailed view of the technical analysis.1.2.1.The number and types of company products comparedto competitors. The size of the company's resources compared tocompetitors. The company's product success levels compared tocompetitors. The company's ability to innovate and diversifyproduction compared to competitors. Analyzing the company's financial position. thefinancial statements included in the financialstatements of the company are used in calculatingmany financial ratios in order to identify the mainThe Philosophy of Technical AnalysisTechnical analysis is based on three basic assumptions asfollowing. Prices and trading volumes represent the decisive forcesThis assumption is a cornerstone of technical analysis.Where technical analysts believe that anything that can affectthe price, such as economic, political, natural, psychologicaland other factors. ultimately is reflected in the price and amountof trading in the market. therefore, the study of price and theamount of trading means studying all of these factors. Thetechnical analyst sees that any movement in the price of aspecific stock reflects the change in the demand and supply ofthat stock in the market. If the demand for a particular share ishigher than its offer as a result of economic, political, natural,psychological factors or any good factors specific to thecompany. this is reflected in the image of a high share price inthe market. but if the demand for a particular share is less thanits offer as a result Economic, political, natural, psychologicalor any bad factors specific to the company as this is reflected inthe low stock price in the market. therefore, the analysis ofprices and the amount of trading means analyzing theeconomic, political and factors of the company indirectly.1.1.2.3. Company analysis: The company is analyzedthrough the following: Comparative analysis which aims toidentify the competitiveness of the company within theindustry. Among the most important factors that are taken intoaccount when doing it are the following. Technical Analysis The price is moving in directionThe term "trend" is a key term in technical analysis. As themain purpose of analyzing the stock price chart is to determinethe price trend in its early stages where deals are agreed with it.as prices move in a direction and this trend often continues untilit is reversed, and this can be inferred through the Newton's first4493
International Journal of Applied Engineering Research ISSN 0973-4562 Volume 14, Number 24 (2019) pp. 4492-4501 Research India Publications. http://www.ripublication.comlaw of movement which It is that the trend is more likely tocontinue its movement than it is to be reversed. Figure 1 showsa downtrend. market is without direction but it does not work well when themarket begins to take a certain direction. while we find that thevarious indicators give a good image of the psyche of thelargest part of the market dealers, and technical analysts usemore than one type of indicators at the same time as You willlead to the cancellation of false signals that appear through oneindicator when used alone. while the use of more than oneindicator at once confirms the good signals.History repeats itselfThe psychological factors of market participants are analyzedthrough technical analysis where the patterns of the chart thathave been recognized for a hundred years reflect the directionof the dealers towards the market in times of rise or fall andsuggest the continuation or stopping of the current trend. As itstudies the psychological factors of dealers in the past whichwill not change in the future which enables it to predict thedirection of the market in the future depending on whathappened in the past.The market tracking indicators are the Moving Average, theMoving Average convergence divergence[10]. the SkewedMoving Average in the form of columns, the Steering Systemand other indicators.The oscillators are Stochastic[11], rate of change, RSI, Williamand other indicators.While we find that the various indicators are represented in theindex of new levels of rise and fall. the index of the extent ofbuyers’ agreement, the index of the commitment of traders. therate of increase and decrease and other indicators.2.By reviewing a set of previous studies on the trader’s approach.the researcher found studies dealing with the use of technicalanalysis including the study by [12] through which heconcluded that the use of buy and sell signals that appearthrough the simple average as one of the tools Technicalanalysis achieves a rate of return of 25% annually whichexceeds the average market return of 10.56% annually and thismeans that the use of a simple average as one of the tools oftechnical analysis affects the effectiveness of investmentdecisions for traders by applying to the Cyprus StockExchange. [13] stated that the use of buy and sell signals thatappear through the moving average as one of the technicalanalysis tools achieves a higher rate of return than the marketaverage and therefore the use of technical analysis affects theeffectiveness of investment decisions for traders by applying tothe shares of large companies listed in the ASE index. agreedwith them [14] Where she concluded that extraordinary profitscan be achieved in the foreign exchange market that exceedsthe randomly generated profits when following the technicalanalysis tips.Figure 1. Downtrend.1.2.2.Technical Analysis Using the ChartThis type of technical analysis is based on analyzing thedifferent types of chart and identifying the price trend throughsignals that give it some of the patterns in which the chart isformed and are represented in the level of support andresistance[6], the trend[1], the head and shoulders pattern[7],the multiple head and shoulders pattern[8], and the Twoconsecutive peaks and bottoms pattern, gaps, rectangles, FlagsAnd Pennants[9].1.2.3.LITERATURE REVIEWWhile [15] disagreed with them. they concluded that the use oftechnical analysis during the session on the American StockExchange does not achieve profits higher than the averagemarket and therefore does not affect the effectiveness ofinvestment decisions of dealers during the period from thebeginning of 2002 to the end In 2003, in the same direction [16]concluded that the use of technical analysis on the New ZealandStock Exchange does not achieve profits higher than theaverage market in the period from the beginning of 1992 untilthe end of 2002, and [17] found That the use of buying signalsthat appear through technical analysis tools makes a profitwhile Using sales signals that appear through the technicalanalysis tools achieving loss in the Madrid Stock Exchange.Technical Analysis Using Indicators.Indicators can help determine the direction of the market anddetermine when it will change. as well as know the strength ofboth buyers and sellers. technical analysis using indicators ismore objective than technical analysis using the graph. theproblem with indicators is that they can conflict with eachother. some of which can be relied upon well in the marketwhen it takes a particular direction. while others can be reliedupon in a market that is without a trend.Professional technical analysts divide the indicators into threegroups: indicators tracking the direction of the market,indicators of volatility and various indicators. indicatorstracking the direction of the market work well when there is adirection of the market but do not work well when the marketis without a direction. while oscillators work well when TheAnd [18] worked on a trading system through whichinformation is gathered from a large number of tradingrecommendations that are based on fundamental analysis in4494
International Journal of Applied Engineering Research ISSN 0973-4562 Volume 14, Number 24 (2019) pp. 4492-4501 Research India Publications. http://www.ripublication.comorder to increase the effectiveness of investment decisions forcustomers. [19] reached through their study Which has beenapplied to four European countries that the variables that arestudied through the fundamental analysis especially the interestrate affect the prices in the market and this indicates thenecessity of using the basic analysis when trading in the marketand thus the possibility of using it on the effectiveness of thedecisions of traders in the market.While the study conducted by [30] dealt with how to testtrading systems that rely on neural networks through a modelthat reached the study. away from the characteristics of thetraders who use the model. [31] reached by polling the opinionsof financial analysts Their belief in the importance ofdiversifying the trader’s securities portfolio in order to reducethe risks that these traders are exposed to and thereby reducetheir losses which affects the effectiveness of their investmentdecisions. When [32] designed a model that combined timeseries and technical analysis. he found that this model achieveda higher rate of return than that achieved only in time series.While [33] concluded that the prediction model that depends oneconomic variables achieves a higher prediction accuracy thanthe model that relies on technical analysis.[20] concluded that the use of fundamental analysis leads toachieving a rate of return above the average market returnwhich affects the effectiveness of investment decisions fortraders. in the same direction [21] concluded that traders Usingthe fundamental analysis to identify the expected return forcompanies and to open short positions by selling the shares ofcompanies whose return is expected to decrease in the futureand then cover these positions by buying back the shares ofthese companies. when the fundamental analysis indicates thepossibility of the return of these companies to rise again This isfrom the Chance of Increasing Effectiveness Investmentdecisions for traders.The researcher extracts from the previous studies the following.There are many previous studies that have studied the impactof some of the characteristics of the traders including the studythrough which [22] sees that over confidence traders achieve ahigher rate of return than their rational thinking colleagues inaddition to being more able to continue in the market, due tothis. To their enthusiasm and attacking ability to makedecisions. [23] also believes that successful, disciplined andrational traders tend to quickly get rid of losing trades and keepwinning trades for longer periods than they keep losing tradesand thereby They were higher than the rate of return traderswho are overconfidence, as [24] added that the traders who arenot over confidence they close money-losing trades, leading toincrease the size of their losses. The difference of the results of previous studies on theeffect of technical analysis on the effectiveness of thetraders ’investment decisions. according to thedifferent markets to which the studies were applied. The effect of using fundamental analysis on theeffectiveness of investment decisions of customers. Previous studies did not study the effect of both theuse of technical analysis and the use of fundamentalanalysis at the same time on the effectiveness ofinvestment decisions for customers, through studyingthe approach of the traders on the effectiveness of theirinvestment decisions.3.METHODOLOGY3.1.Exploratory studyThe researcher conducted an exploratory study through a set ofin-depth personal interviews with a group of clients accountmanagers, managers of brokerage firms in securities, anddealers in the stock exchange mentioned in Appendix A and theinterview framework was to find out the following.[25] studied the extent to which professional and novice tradersaccept short-term losses, and it turns out that professionals aremore receptive to losses than beginners and this implicitlyagrees with what [23] reached, where their study found thateffort What the traders make increases after they stop theirlosses, in addition to stopping the losses that do not lead to thedeterioration of the performance of the traders. and [26]concluded that the fundamental analysis can be used todetermine the winning and losing stocks, [27] also tested thepossibility of using neural networks to design a system basedon fundamental analysis, and the results showed thatfundamental analysis achieves a rate of return that exceeds thatof the market index. The extent to which traders use a certain approachwhen trading on the stock exchange. The effect of using technical analysis on theeffectiveness of investment decisions of customers. The effect of using basic analysis on the effectivenessof investment decisions of customers.The results of these interviews were as follows.[28] was able to improve the performance of ATS electronictrading systems by improving the benefit accruing to the traderit uses in addition to making it more appropriate to itscapabilities by applying to the New York and Chicago futuresmarket and indicated that this improvement can also be used inthe stock markets and Currencies markets. [29] combined twomodels for determining profit-loss trades in order to arrive at amodel through which an indicator is calculated that assiststraders in managing money by determining profit-loss tradesbefore opening them, by identifying the amount The transactionand expected movement Prices on the stock market.4495 There is confusion among the dealers between thecurriculum and the trading system, and most of thedealers do not use a specific method when trading onthe stock exchange, while it depends on therecommendations of experts and intuition. It is not possible to know the effect of using technicalanalysis on the effectiveness of traders’ investmentdecisions.
International Journal of Applied Engineering Research ISSN 0973-4562 Volume 14, Number 24 (2019) pp. 4492-4501 Research India Publications. http://www.ripublication.com 3.2.according to the ratio of the number of operations that tookplace during the month of July 2019 for each company to thetotal number of operations for all companies as shown in TableNo. 1.It is not possible to identify the effect of the use offundamental analysis on the effectiveness ofinvestment decisions of customers.Research problemTable 1. The sample is distributed to brokerage firms.Through what has been revealed from the review of previousstudies and the results of the survey study. the research problemcan be formulated as follows.Although it is important to know the effect of the traders' useof fundamental analysis tools and technical analysis tools onthe effectiveness of their investment decisions on the EgyptianStock Exchange. this effect has not been studied in a controlledmanner through scientific research.3.3.H1. There is no significant effect that traders use offundamental analysis and technical analysis tools on theeffectiveness of their investment decisions on the EgyptianStock Exchange.Numberof 3.7.Variables and measurement3.7.1.MeasurementThe researcher used a questionnaire that dealt with the dealers’use of basic analysis tools and technical analysis tools, and theaverage return they achieved, to obtain the preliminary datanecessary to complete the study. The researchers gave greatcare to this questionnaire in the preparation and were presentedto a group of professors and make the required adjustments,then made a pretest test for this questionnaire on a sample oftraders. Based on this test. the researchers made the requiredamendments to the questionnaire and prepared them in theirfinal form. then the researchers collected Data during the periodfrom July 2019 to October 2019.H1(a). There is no significant effect for traders using basicanalysis tools on the effectiveness of their investment decisionson the Egyptian Stock Exchange.H1(b). There is no significant effect that traders use of tools fortechnical analysis on the effectiveness of their investmentdecisions on the Egyptian Stock Exchange.3.7.2.Research communityVariablesIndependent variables include using fundamental analysis wasmeasured by the respondents' answers to questions No. 1 to 4in the questionnaire. using technical analysis was measured bythe respondents ’answers to questions from No. 5 to No. 22 andThis variable includes three sub-variables represented in theanalysis using the chart which measured by Traders answerson questions No. 5 to No. 14, Analysis using indicators whichmeasured by the respondents' answers to questions No. 15 toNo. 19.The research community is represented by the individualtraders registered in the Egyptian Stock Exchange whichnumbered 17.1 million trader.3.6.Number ofOperations%Research hypothesesTo achieve the Research objective, the researcher has tested thefollowing hypotheses.3.5.Number ofOperationsResearch objectiveThe researcher seeks through this research to Knowing theeffect of the traders' use of the basic analysis tools and thetechnical analysis tools on the effectiveness of their investmentdecisions on the Egyptian Stock Exchange in order todetermine whether the traders should use the technical andfundamental analysis as a method for dealing in the stockmarket so that their investment decisions in the capital marketare effective.3.4.SecuritiesBrokerageFirmsSampleThe research sample is represented by 384 traders from theaforementioned community, because the size of the communityis more than 100000 items. a simple random sample ofbrokerage firms was selected in the securities registered on thestock exchange at a rate of 5% which is shown in Table No. 1.Then, the number of traders in each company was determinedTrading system which measured by the respondents' answers toquestions No. 20 to No. 22. The dependent variable isrepresented in the effectiveness of the investment decisions,4496
International Journal of Applied Engineering Research ISSN 0973-4562 Volume 14, Number 24 (2019) pp. 4492-4501 Research India Publications. http://www.ripublication.comwhich were measured through the return achieved by thecustomers during the period from 15 July 2018 to 14 July 2019,through the response of the traders to question No. (23), inwhich the different levels of the average return weredetermined. Based on the rate of return achieved by the thirtyindex of the Egyptian Stock Exchange EGX30 during the sameperiod previously mentioned, which was calculated as follows.3.8.2.Durbin-Watson TestThe researcher used the Durbin-Watson Test to test theautonomy of the remaining so that he can identify the suitabilityof the nature of the data collected with the statistical methodused in the hypothesis test, which is the analysis of multiplelinear regression.3.8.3.R (EGX30 value in year t - EGX30 value in year t-1)/ EGX30value in year t-1Contrast stability test3.8.Statistical methodsThe researcher used the contrast stability test to identify thesuitability of the nature of the data collected with the statisticalmethod used in the hypothesis test, which is the analysis ofmultiple linear regression.3.8.1.Normality Test3.8.4.The researcher used a Normality Test of the probabilitydistribution of the remainder in order to identify the suitabilityof the nature of the data collected with the statistical methodused in the hypothesis test, which is the analysis of multiplelinear regression.Multiple linear regression analysisThe researcher used the multiple linear regression analysismethod to test the ability of the two independent variables toaffect the dependent variable because it takes into account thetwo independent variables together. The researchers formulatedthe multiple regression model through which the main researchhypothesis will be tested through this method as shown inFigure No. 2 The second hypothesis will be tested through thismethod as well, as shown in Figure No. 3.MethodFundamental analysisInvestment decision effectivenessRealized average returnTechnical AnalysisFigure 2. H1 test model.R a B1 ME1 B2 ME2Where R is Realized average return. ME1 is Fundamentalanalysis. ME2 is Technical Analysis.Technical AnalysisAnalysis using a chartInvestment decision effectivenessAnalysis using indicatorsRealized average returnTrading systemFigure 3. H1(b) test model.R a B1 T1 B2 T2 B3 T3Where T1 is Analysis using a chart. T2 is Analysis usingindicators. T3 is Trading system.4497
International Journal of Applied Engineering Research ISSN 0973-4562 Volume 14, Number 24 (2019) pp. 4492-4501 Research India Publications. http://www.ripublication.com3.9. Test the suitability of statistical methods for thenature of the primary dataThrough this stage the researcher seeks to test the suitability ofthe primary data collected through the survey with thestatistical analysis method that he will use in testing the studyhypotheses, which is a multiple linear regression by testing theavailability of the following conditions.3.9.1. Theoretical conditions.Rationale of Signals and Value of RegressionCoefficients: There are no specific limitations in thestudy about regression signs or coefficients, so thiscondition is available in the data. Explanatory power of the model: The determinationcoefficient resulting from the operation of dataaccording to the regression model has a value of0.566, which means that the independent variables ofthe study explain 56.6% of the changes that occur inthe dependent variable and the rest is due to otherfactors, including random error, and therefore thiscondition is available in the data.Regular Least Square Conditions.3.9.2. The autonomy of the remnants: The researchers testedthe residual autonomy through the Durbin-WatsonTest, and the researchers found that there was anautonomy of the residue as the value of 1.994 Durbanwas less than 2 and greater th
trend in The future, and therefore the trader can use technical analysis to predict the direction of prices in the future and thus achieve effectiveness in his decisions. The following is a detailed view of the technical analysis. 1.2.1. The Philosophy of Technical Analysis Technical analysis is based on three basic assumptions as