Transcription
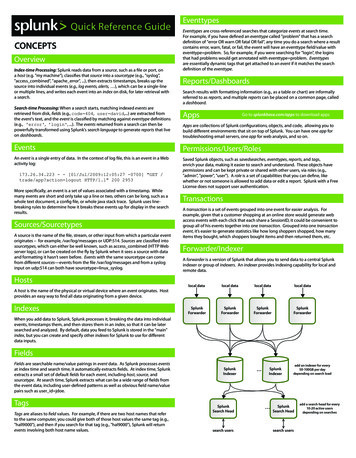
Integration GuideSplunkRevised: 11 March 2016
About This GuideGuide TypeDocumented Integration — WatchGuard or a Technology Partner has provided documentation demonstratingintegrationGuide DetailsWatchGuard provides integration instructions to help our customers configure WatchGuard products to workwith products created by other organizations. If you need more information or technical support about how toconfigure a third-party product, see the documentation and support resources for that product.Splunk Integration Guide
Splunk Integration OverviewThis document describes the steps to integrate Splunk with your WatchGuard Firebox so that the Splunkadministrator can index syslog messages sent from the Firebox.Platform and SoftwareThe hardware and software used to complete the steps outlined in this document include: Firebox or WatchGuard XTM device installed with Fireware v11.10.xSplunk Enterprise 6.3 installed on a Windows 2012r2 computerConfigurationTo complete this integration, you must first deploy Splunk Enterprise software.To set up the Splunk environment, please refer to the Splunk Installation Guide. In this document, we describethe procedure to listen, receive, and index syslog data from the Firebox on Splunk Enterprise.Set Up Splunk Enterprise1. On the server where Splunk Enterprise is installed, connect to http://localhost:8000/enUS/account/login. The first time you log in, use the default user name admin and the default passwordchangeme. You can then change the password to one you choose and log in again with your newpassword.Splunk Integration Guide
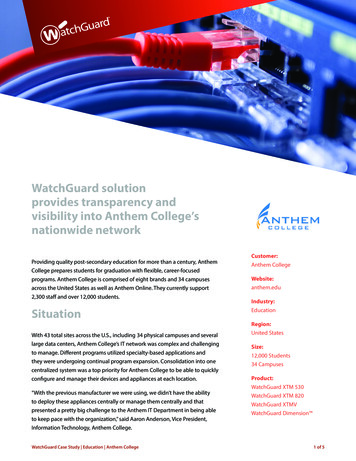
2. From Splunk Home, select Add Data. The Add Data page launches.3. Select monitor to get data from TCP and UDP ports.4. Select the TCP/UDP UDP tab. Note that Firebox syslog support is only available for UDP.5. In the Port text box, type 514. This port must match the port configured on the Firebox for the syslogserver.Splunk Integration Guide
6. In the Only accept connection from text box, type the IP address of your Firebox. In our example, weused 10.0.1.1.Splunk Integration Guide
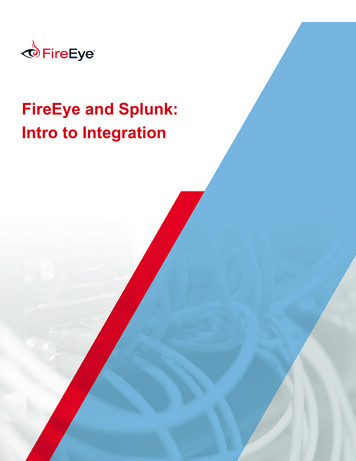
7. From the Select Source Type drop-down list, select Operating System syslog. Click Review tocontinue.8. Click Submit. Splunk will now automatically receive syslog messages from the Firebox IP address youspecified.Splunk Integration Guide
Set Up Your Firebox to Send Syslog Messages to Splunk1. Connect to your Firebox with WatchGuard System Manager Policy Manager or Fireware Web UI. Inthis example, we use Policy Manager.2. Select Setup Logging.3. Select the Send log messages to this syslog server check box.4. In the IP address text box, type the IP addrees of your server on which Splunk is installed. In thisexample, we use 10.0.1.2.5. From the Port selector, select 514.6. From the Log format drop-down list, select Syslog.Splunk Integration Guide
7. Click OK. Save the configuration to your Firebox.Search and Report on syslog Data from Splunk1. Sign in to the Splunk Home Page with the user admin and your administrative password.2. Click Search & Reporting.Splunk Integration Guide
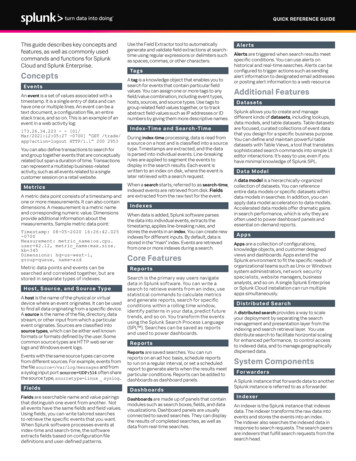
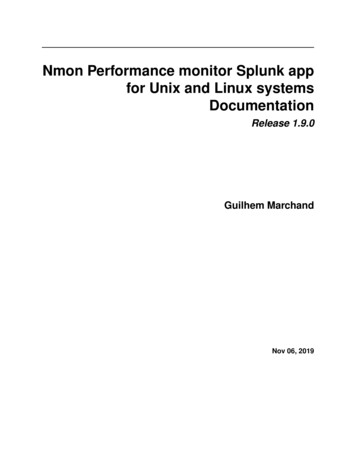
3. In the New Search text box, type a search command to find a log message, using Splunk’s supportedsearch language commands. For example, this screenshot shows a search for log messages related towebsite browsing of an internal host through the Firebox.4. With Splunk reporting, we can count the number of times an internal host visited any website.Splunk Integration Guide
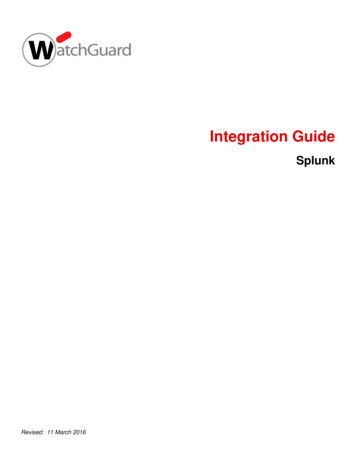
5. Click the Visualization tab to visualize the report resulting from your search. In our example, weselected to view the data as a pie chart.Splunk Integration Guide
Splunk Integration Guide 3. In the New Search text box, type a search command to find a log message, using Splunk’s supported search language commands. For example, this screenshot shows a search for log messages related to website browsing of an internal host through the Firebox.