Transcription
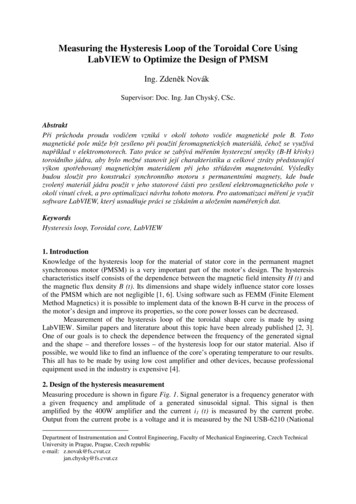
Measuring the Hysteresis Loop of the Toroidal Core UsingLabVIEW to Optimize the Design of PMSMIng. Zdeněk Novák1Supervisor: Doc. Ing. Jan Chyský, CSc.AbstraktPři průchodu proudu vodičem vzniká v okolí tohoto vodiče magnetické pole B. Totomagnetické pole může být zesíleno při použití feromagnetických materiálů, čehož se využívánapříklad v elektromotorech. Tato práce se zabývá měřením hysterezní smyčky (B-H křivky)toroidního jádra, aby bylo možné stanovit její charakteristiku a celkové ztráty představujícívýkon spotřebovaný magnetickým materiálem při jeho střídavém magnetování. Výsledkybudou sloužit pro konstrukci synchronního motoru s permanentními magnety, kde budezvolený materiál jádra použit v jeho statorové části pro zesílení elektromagnetického pole vokolí vinutí cívek, a pro optimalizaci návrhu tohoto motoru. Pro automatizaci měření je využitsoftware LabVIEW, který usnadňuje práci se získáním a uložením naměřených dat.KeywordsHysteresis loop, Toroidal core, LabVIEW1. IntroductionKnowledge of the hysteresis loop for the material of stator core in the permanent magnetsynchronous motor (PMSM) is a very important part of the motor’s design. The hysteresischaracteristics itself consists of the dependence between the magnetic field intensity H (t) andthe magnetic flux density B (t). Its dimensions and shape widely influence stator core lossesof the PMSM which are not negligible [1, 6]. Using software such as FEMM (Finite ElementMethod Magnetics) it is possible to implement data of the known B-H curve in the process ofthe motor’s design and improve its properties, so the core power losses can be decreased.Measurement of the hysteresis loop of the toroidal shape core is made by usingLabVIEW. Similar papers and literature about this topic have been already published [2, 3].One of our goals is to check the dependence between the frequency of the generated signaland the shape – and therefore losses – of the hysteresis loop for our stator material. Also ifpossible, we would like to find an influence of the core’s operating temperature to our results.This all has to be made by using low cost amplifier and other devices, because professionalequipment used in the industry is expensive [4].2. Design of the hysteresis measurementMeasuring procedure is shown in figure Fig. 1. Signal generator is a frequency generator witha given frequency and amplitude of a generated sinusoidal signal. This signal is thenamplified by the 400W amplifier and the current i1 (t) is measured by the current probe.Output from the current probe is a voltage and it is measured by the NI USB-6210 (NationalDepartment of Instrumentation and Control Engineering, Faculty of Mechanical Engineering, Czech TechnicalUniversity in Prague, Prague, Czech republice-mail: z.novak@fs.cvut.czjan.chysky@fs.cvut.cz
Instruments data acquisition device with USB PC connection). Due to the current flow in theprimary winding of the toroidal shape core, the magnetic field intensity H (t) is created. Itsmagnitude can be calculated based on Ampere’s law as [2]:N i (t )(1)H (t ) 1 12 rπwhere N1 is the number of turns in the primary winding, i1 (t) is the current in the samewinding and r is the middle radius of the toroidal shape core (value of denominator is theequivalent to the magnetic length of the material).Result of the magnetic field intensity H (t) is the creation of the magnetic flux ϕ (t)inside the core. Then, the magnetic flux density B (t) can be measured and calculated based onthe induced voltage u2 (t) as [2]:t1B (t ) B0 u 2 (τ )dτ(2)SN 2 0where N2 is the number of turns in the secondary winding, u2 (t) is the induced voltage of thesecondary coil, S is the cross section of the toroidal shape core and B0 is an offset.The integration is a time consuming method and with increasing frequency the noise isexpected to increase. Based on the [2] direct voltage measurement can be applied only up to200 Hz and some filters has to be used to cut the added noise. Therefore using analog RCpassive integrator seems to be a good way how to increase possible applied frequency (up to 1kHz [2]) and even not to use any further signal processing algorithms, because it is working asa low-pass filter. Measured voltage is then given by [2]:t1v 2 (t ) u 2 (ξ )dξ(3)RC 0where v2 (t) is the measured voltage on capacitor, R is the value of used resistor, and C is thevalue of used capacitor in the integrator circuit. After acquiring data from measured voltage,induced voltage can be then easily calculated and substituted into equation (2) without offsetB0.In the end, all the data from measurements are saved in PC and ready for further analysis.Fig. 1 Measuring procedure
2.1 Using LabVIEW for data acquisitionFor the purposes of our measurements, adjustable graphical user interface (GUI) was created.Because in the future we would like to measure different materials of toroidal shape cores,variables such as N1, N2, frequency of modulated signal, number of data samples/s, S, r can bechanged without having to interfere with values in the program block diagram. GUI is shownin Fig. 2 and program block diagram can be found in Fig. 3. All acquired data together withinput variables are saved in a data file, from where they can be used for further analysis in thefuture.Fig. 2 GUI from LabVIEWFig. 3 Program block diagram
3. Analyzing acquired dataParameters of tested toroidal shape core together with supplementary parameters can be foundin Tab. 1. During measurement, current value was set as constant while the frequency waschanging. With increasing frequency the current is dropping so to keep its value constant,amplitude of a generated signal has to be increased.The sampling rate per channel was 12500 samples per second. If the testing time wasset as 5 seconds (to be able to cut possible disturbances from the beginning of themeasurement), it give us around 62500 data for one chosen current and frequency. These datacan be now analyzed.There is more than one way how to do it. First - the easier one - is to choose only apart of measured signal, for example 4 periods. Then the hysteresis loop can be plotted onlyfrom these 4 periods and the result is shown in Fig.4.Table 1 Parameters of tested toroidal core with supplementary parametersName of used toroidal coreN1 [ ]N2 [ ]S [m2 ]r [m ]Applied frequencies [Hz]/Applied current [A]L1 [H]L1 [H]R1 [Ω]R2 [Ω]0078090A7 (Magnetics)3003000,0001340,018877530 700 / 130 400 / 230 250 / 30,0085920,0088677,27,3Fig. 4 Hysteresis loop of the toroidal shape core; applied current 3 A, applied frequency 250 Hz
Fig. 5 Single-sided amplitude spectrum of u2(t); applied current 3A, applied frequency 250 HzThe second choice is to use wider interval of acquired data (or again just 4 periods)and use some method for digital signal processing, such as Fast Fourier Transform (FFT).With FFT, it is possible to bring down complexity of acquired data [5] and then analyze onlythe simplified signal which one still has the key role in the measurement. Because we usedRC passive integrator, calculated induced voltage should be already filtered from added noiseof higher frequencies. But still, it is possible to check the induced voltage with FFT to findfrequency components of a signal. The result can be seen in Fig.5. It is clearly visible that forgenerated signal of frequency 250 Hz the induced signal is composed with also differentfrequencies (mostly lower one). The next steps would be to limit these additional frequencies,reconstruction of original signal with inverse FFT and computing B-H curve again.At this point, it is not necessary to make further analysis of achieved B-H curves.From the Fig. 4 it is visible, that hysteresis curve is not very wide, if we consider it as a loop.If we plot other B-H curves with the same value of the current, but for different (lower)frequencies, we would obtain almost same progress as shown in Fig. 4. If we use a lowercurrent, it will only lower magnitude of B. This is due to the parameters of the used coil. Itslength due to number of turns is high (for this measurement) and therefore its resistance isalso high. Commonly used coils in high speed PMSM have their resistance less than 1 Ω [7,8]. Summary, to achieve more adequate hysteresis curve for our material, it is necessary todecrease number of turns of our coil, which will lead to a smaller resistance of the primaryand secondary winding, and therefore possibility to use higher frequencies and current.During the measurement, the toroidal shape core was located in the tank with mixingthe water and the water temperature controller (set to 30 C). It was possible to keep toroidalcore at nearly same temperature as surrounding water, but for higher currents and frequencies,there was a bigger temperature difference. Therefore, how to maintain same temperature ofthe core during the whole measurement needs further investigation.3.1 Application of acquired dataEven when it wasn’t possible to achieve B-H characteristic for the higher frequencies andcurrent, it is already possible to use acquired data to check design of our PMSM.Implementing data of B-H curve into FEMM software is shown in Fig. 6.
Fig. 6 Inserting data of B-H curve into FEMM softwareFig. 7 Result of FEM analysis with one active pole pair B and B-; current 3AResults of FEM analysis with current 3A in only one active pole pair B and B- is inFig. 7. Used permanent magnet is type N42.With using a built in computing functions, it is now possible to analyze hysteresislosses per cycle and compare them with analytical method solutions [6, 9]. Also, because ourprototype of PMSM is already built, we can use obtained data from FEMM for a comparisonwith the real losses. Other functions such as computing the torque can be used.4. ConclusionBased on the measuring procedure, the measuring workplace was assembled and required datafor the hysteresis characteristic of the toroidal shape core were measured. The B-H curve wasplotted using acquired data and analyzed. Due to the high resistance of used coil, it isnecessary to continue with another measurement and find optimal parameters for frequencyand current in our PMSM, so the power losses in stator core will be kept at an acceptable level.
A good plan for the future is also, if possible, finding an influence of the core’s operatingtemperature to our results while measuring its hysteresis characteristics.Obtained B-H characteristic was implemented into FEMM software and generatedresults from its computational core will be compared with data from real PMSM, so thedesign of PMSM can be improved in the future. Also, with the new measurement for differentfrequencies and current, the B-H characteristic will be updated. Based on these results, othermaterials for the toroidal shape core can be considered.NomenclatureH (t)magnetic field intensityB (t)magnetic flux densityN1number of turns in the primary coilN2number of turns in the secondary coilScross section of the toroidal shape corermiddle radius of the toroidal shape coreB0offsetϕ (t)magnetic flux inside the corei1 (t)current of the primary coilinduced voltage on the secondary coilu2 (t)v2 (t)measured voltage on the capacitor in the RC integrator circuitRvalue of the resistor in the RC integrator circuitCvalue of the capacitor in the RC integrator circuitinductance of the primary coilL1L2inductance of the secondary coilR1resistance of the primary coilR2resistance of the secondary coilU2 (f) discrete Fourier transform (DFT) of vector u2 H)(H)(Ω)(Ω)(V)References[1]Krishnan, R: Permanent magnet synchronous and brushless DC motor drives. BocaRaton: CRC Press/Taylor, c2010, xxxv, 575 p. ISBN 08-247-5384-4[2]Z. Pólic, M. Kuczmann: Measuring and control the hysteresis loopby using analog and digital integrators. Journal of optoelectronics and advancedmaterials, Vol. 10, No. 7, July 2008, p. 1861 – 1865[3]Tumanski, S: Handbook of magnetic measurements. Boca Raton, FL: CRC Press.ISBN 978-143-9829-523.[4]Adly, A. A.; Abd-El-Aziz, M.M.; Zeineldin, H.H: A low cost device for deducing B-Hcurves of magnetic materials. Circuits and Systems, 2003 IEEE 46th MidwestSymposium on , vol.2, no., pp.886,888 Vol. 2, 30-30 Dec. 2003doi: 10.1109/MWSCAS.2003.1562428[5]Duhamel, P. a M. Vetterli: Fast fourier transforms: A tutorial review and a state of theart. Signal Processing. 1990, vol. 19, no. 4, pp. 259-299. ISSN 01651684. DOI:10.1016/0165-1684(90)90158-U.Available at: 849090158U[6]Chysky, J.; Novak, J.; Novak, M.; Novak, Z.: Determination of losses in ferromagneticcircuit of a sinusoidal filter powered with frequency invertor. MECHATRONIKA, 201215th International Symposium , vol., no., pp.1,6, 5-7 Dec. 2012
[7][8][9]Novak, M.; Novak, J.; Chysky, J.: Experimental verification of high-speed permanentmagnet synchronous motor model. Electrical Machines (ICEM), 2012 XXthInternational Conference on , vol., no., pp.2435,2440, 2-5 Sept. 2012doi: 10.1109/ICElMach.2012.6350225Pfister, Pierre-Daniel: Very high-speed slotless permanent-magnet motors: theory,design and validation. Lausanne: EPFL, 2009. Dissertation. École polytechniquefédérale de Lausanne EPFL. Advisor: Perriard, Yves.Pfister, P.-D.; Koechli, C.; Markovic, M.; Perriard, Y.: Analysis of Hysteresis Lossesin Synchronous Permanent Magnet Motors. Electromagnetic Field Computation, 200612th Biennial IEEE Conference on , vol., no., pp.144,144, 0-0 0doi: 10.1109/CEFC-06.2006.1632936
Hysteresis loop, Toroidal core, LabVIEW 1. Introduction Knowledge of the hysteresis loop for the material of stator core in the permanent magnet synchronous motor (PMSM) is a very important part of the motor’s design. The hysteresis characteristics itself consists of the dependence between the magnetic field intensity H (t) and the magnetic flux density B (t) . Its dimensions and shape .