Transcription
Algorithmic Trading Accelerator Guide5.3January 2015
This document applies to Apama 5.3 and to all subsequent releases.Specifications contained herein are subject to change and these changes will be reported in subsequent release notes or new editions.Copyright 2013-2015 Software AG, Darmstadt, Germany and/or Software AG USA Inc., Reston, VA, USA, and/or its subsidiaries and/or its affiliates and/ortheir licensors.The name Software AG and all Software AG product names are either trademarks or registered trademarks of Software AG and/or Software AG USA Inc.and/or its subsidiaries and/or its affiliates and/or their licensors. Other company and product names mentioned herein may be trademarks of their respectiveowners.Detailed information on trademarks and patents owned by Software AG and/or its subsidiaries is located at http://softwareag.com/licenses.This software may include portions of third-party products. For third-party copyright notices, license terms, additional rights or restrictions, please refer to"License Texts, Copyright Notices and Disclaimers of Third Party Products". For certain specific third-party license restrictions, please refer to section E of theLegal Notices available under "License Terms and Conditions for Use of Software AG Products / Copyright and Trademark Notices of Software AG Products".These documents are part of the product documentation, located at http://softwareag.com/licenses and/or in the root installation directory of the licensedproduct(s).Document ID: PAF-Algorithmic Trading Accelerator Guide-5.3-20150122@245813
Table of ContentsTable of ContentsChapter 1: Overview of the Algorithmic Trading Accelerator.5Chapter 2: Running the ATA samples.7Starting and stopping the ATA demo. 8Starting and stopping on Windows. 9Starting and stopping on UNIX or Linux.10Subscribing to Symbol Sets. 11Using the Order Management System.12Blotter Window Fields. 15Background Effects. 16Order Details. 17Using Algorithmic Trading Strategies. 17Algos Home Page. 17Crossover.18Iceberg. 20Momentum Trading.21Order Slicing.23Percentage of Volume (POV).24Using the POV Strategy.25Statistical Arbitrage.28Time Weighted Average Price (TWAP).29Using the TWAP Strategy.30Volume Weighted Average Price (VWAP). 32Using the VWAP Strategy.33Using Risk Firewalls. 35Overview of Active Risk Firewalls.36Viewing Firewall Rule Details.37Firewall Ruleset: Order Price Limits. 38Firewall Ruleset: Order Quantity Limits. 39Firewall Ruleset: Position Limits. 40Firewall Ruleset: Order Throttle Limits. 42Firewall Ruleset: Client Credit Limits. 43Using Market Test Scenarios. 43Testing with the Order Manager Scenarios. 44Testing with the Market Data Scenarios. 46Chapter 3: Developing and deploying custom ATA applications. 49Architecture overview. 49Components of the Algorithmic Trading solution. 49Directory structure. 50Importing the ATA Project into Apama Studio. 52Quick steps to a new algorithm. 53Deploying the ATA to a Web Application Server. 53Adding Adapters. 54Algorithmic Trading Accelerator Guide 5.33
Table of ContentsAdding Symbol Sets. 56Getting Symbol attributes.56Adding temporary Symbol Sets. 57Adding Symbol Sets on the server. 58Chapter 4: Troubleshooting. 61Algorithmic Trading Accelerator Guide 5.34
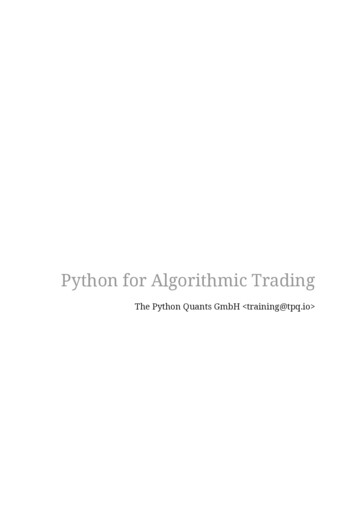
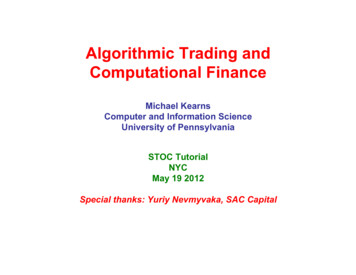
Chapter 1: Overview of the Algorithmic Trading AcceleratorThe Algorithmic Trading Accelerator (ATA) installs with the Capital Markets Foundation (CMF).Unlike solutions that offer commoditized, pre-defined strategies, the ATA enables you to quicklydevelop, refine, and deploy unique algorithmic trading strategies built upon your own intellectualproperty. The ATA relies on Apama's patented Event Stream Processing (ESP) platform to applystrategies against high volume market activity, enabling users to achieve trading objectives.Apama includes an extensible framework for integrating with market data feeds, middlewaretechnologies, order management systems and databases. And it offers a rich dashboard environmentfor graphical monitoring of algorithmic trading execution. The following illustrates the runtimearchitecture of a solution based on the ATA.In a production environment, adapters feed events to an Apama correlator, which filters eventsand applies trading strategies. An administrator can set up risk firewalls to prevent unauthorizedtrading. Traders can view the orderbook and trade using the supplied Apama dashboard ora customized trading user interface. For an example of a custom trading interface, see the FXAggregation solution, which is also based on the CMF.ATA includes tools to monitor market flow and depth and to execute orders through one or more ofthe following:Basic Direct Market Access (DMA) with explicit buy and sell orders.Execution distribution strategies such as Volume-weighted and Time-weighted Average Price(VWAP and TWAP), order slicing, iceberg, and Percentage of Volume (PoV).Market-responsive analytic strategies such as momentum trading, and crossover.Algorithmic Trading Accelerator Guide 5.35
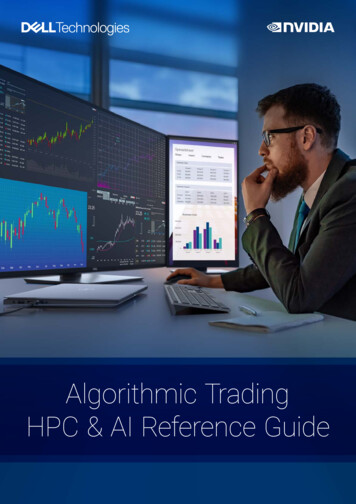
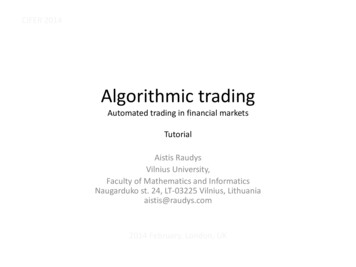
Complex algorithms such as statistical arbitrage that are sophisticated in terms of the logicalconstructs that define them as well as the technological requirements to run them effectively.All order activities can be monitored by several overlapping trading firewalls that are defined forsets of users, venues, and instruments. Each firewall monitors prices, quantities, positions, and clientbalances to alert traders at one threshold, and reject orders at the outer limit. The firewalls protect theclient's interests when order submission and trade execution are virtually immediate.Using ATA as a starting point for a custom solution allows you to:Develop unique automated trading strategies in a graphical modeling environment.Package existing algorithmic modules for reuse in new strategies.Build upon a foundation library of trading algorithms.Evaluate and refine strategies by testing against historical data.Execute thousands of trading scenarios concurrently.Use packaged connectivity for access to financial feeds.Optimize trade opportunities for both sell-side and buy-side firms.Out-of-the-box, ATA provides a trade simulator and start-up scripts, which make it easy toexplore ATA and learn about its capabilities. The following illustration shows the demonstrationarchitecture.This document shows you how to set up the Algorithmic Trading Accelerator, run it indemonstration mode, explore its client screens, set up distributed clients, and use Apama Studio tocreate custom trading algorithms.Algorithmic Trading Accelerator Guide 5.36
Chapter 2: Running the ATA samplesn Starting and stopping the ATA demo .8n Subscribing to Symbol Sets .11n Using the Order Management System .12n Using Algorithmic Trading Strategies .17n Using Risk Firewalls .35n Using Market Test Scenarios .43The ATA includes algorithmic trading strategies that are injected into an Apama correlator, and anApama dashboard that supports trading, displays information about the strategies, and allows youto configure firewall rules. Included scripts allow you to start the runtime pieces and demonstrateATA capabilities.You can run ATA on a single machine, or you can run the correlator on one machine and runmultiple dashboards that connect to it remotely. You might do this for example, if you wantedto install the correlator on a machine running Linux. The dashboards must be run on Windowsmachines.Note: Before you can run ATA, you must install and configure Apama and the CMF as described inCapital Markets Foundation Guide.The CMF installation makes it easy to run the pre-defined ATA immediately on the local machine.The ATA is copied into the %APAMA WORK% directory during installation and run from there.Then, in "Developing and deploying custom ATA applications" on page 49, you see how toimport the projects into Apama Studio, so you can define, test, and deploy your custom ATA.The following table lists the scripts (located in ATA's installation directory %APAMA WORK%/ATA {version}) for starting and stopping the demo or the correlator and dashboard separately:Table 1. ATA ScriptsDescriptionOne command that:Batch and sh filestartDemoBuilds the projectAnt scriptant start-demoant startStarts the correlatorStarts the trade simulatorStarts the AdministrativedashboardStarts the correlator.Algorithmic Trading Accelerator Guide 5.3startServerant start-server7
Starting and stopping the ATA demoDescriptionBatch and sh fileAnt scriptStarts the Administrativedashboard.startClient (.batonly, noequivalent on Linux)ant start-clientShuts down the correlatorand trade simulator.stopDemoant stopStops only the correlator.stopServerant stop-serverCreates a deploymentWAR which can be usedto deploy the ATA using aWeb Application Service.See "Deploying the ATA toa Web Application Server"on page 53 for usageinformation.deploy (.batonly, noequivalent on Linux)ant deployPrints a list of ant targets.N/Aant usagePrints a list of ant targets.N/Aant helpDeletes log files and cleansup deployed strategies.N/Aant cleanDeletes log files.N/Aant clean-logsArchives log files in a zipfile in the ATA directory anddeletes all log files fromthe log folder. The zip filesuffix includes the dateand time. For example,log 20120420 103921.zip.The correlators must bestopped before you run thiscommand.N/Aant archive-logsThe following sections describe how to start and stop the ATA demo and walk through the availablefeatures and panels in the Algorithmic Trading dashboard. Later chapters describe how to set upusers and customize ATA.Starting and stopping the ATA demoDemo scripts start a correlator, inject the ATA framework and strategies, start a market datasimulator, and start an administrative dashboard--all on the same machine. A local ATA demorequires no authentication, and the user is referenced as your local login name, referenced here as asample user myusername.Algorithmic Trading Accelerator Guide 5.38
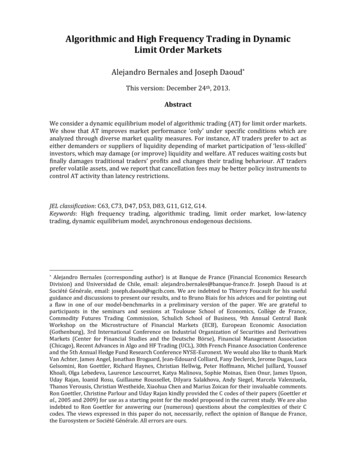
Starting and stopping the ATA demoWhen your server session is done, stop the Algorithmic Trading accelerator server and perform agraceful shutdown. Closing the command prompt window where you started the server does notstop the process. You must explicitly run the stop command to stop the server.Running the ATA samplesStarting and stopping on WindowsOn Windows, you can start and stop the ATA demo from the Start All Programs menu, chooseSoftware AG Apama Capital Markets 5.3 ATA StartATA / StopATA, or from a CMF command prompt,as follows:1. To start and stop the ATA demo from the a CMF command prompt:a. From the Start All Programs menu, from the Start All Programs menu, choose Software AG Apama Capital Markets Foundation 5.3 CMF Command Prompt.A CMF Command Prompt opens to the %APAMA WORK% directory.b. Change directories to the top level ATA directory. For example:cd ATA {version}c. Launch the demo start script by entering:startDemo.bator ant startDemoThe Algorithmic Trading dashboard Home page opens. The Home page provides access to theother pages as well as the status of the correlator and service.Algorithmic Trading Accelerator Guide 5.39
Starting and stopping the ATA demod. When you have completed your demo session, launch the demo stop script by entering:stopDemo.bator ant stopDemoStarting and stopping the ATA demoStarting and stopping on UNIX or LinuxOn UNIX or Linux, start and stop the ATA demo, as follows:1. Open an Apama Command Prompt2. Change directory to the root of the CMF installation.3. Source bin/CMF env4. Enter ./startdemo.sh or ant startDemoThe Algorithmic Trading dashboard Home page opens. The Home page provides access to theother pages as well as the status of the correlator and service.Algorithmic Trading Accelerator Guide 5.310
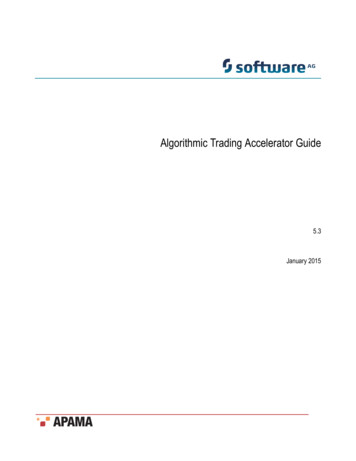
Subscribing to Symbol Sets5. When you have completed your demo session, launch the demo stop script by entering ./stopdemo.sh or antstopDemoStarting and stopping the ATA demoSubscribing to Symbol SetsActivities in Algorithmic Trading are based on market data. Whether running the demo and usingsimulated data or using real data from an adapter to an external feed, you first need to subscribe tothe symbol sets of interest. Each symbol set corresponds to a data feed and initializes the symbolvalues for that feed.To subscribe to a symbol set:1. From the dashboard Home page click Setup to open the Symbol Set Subscription page.2. Select a symbol set.3. Click Subscribe.The demo simulates data from all these feeds, so you can subscribe to one or more. Each subscribedsymbol set is highlighted and checked, as shown for DJIA and FX:Algorithmic Trading Accelerator Guide 5.311
Using the Order Management SystemTo unsubscribe from a symbol set, select it, and then click Unsubscribe.Running the ATA samplesUsing the Order Management SystemFrom the left navigation bar, click OMS to display the Order Management page. This page providesthe following functionality:Selection of multiple instrument groupsVisual summary of Bid/Ask/Last prices and volumesVisual summary of positions in each instrumentDetailed view of full market depth (5 Best Bid/Asks)Order “blotter” view of all orders working and worked in the marketSelection of an order provides detailed information, and enables modification or cancellation oflive ordersNote: The current position of all instruments will be persisted. When the application restarts, thepositions are restored.Algorithmic Trading Accelerator Guide 5.312
Using the Order Management SystemThe Order Management System screen opens with the selected instruments of the subscribed symbolsets listed in the trader section, as shown:At the top of the OMS screen, you can click a button to launch new panes of the Trader section(prices, market depth, and DMA) or the Blotter section (executed orders):Trader sectionThe trader section provides the information about trades for the subscribed symbol set.Algorithmic Trading Accelerator Guide 5.313
Using the Order Management SystemThe left side of Trader section provides a view of the market activity and holdings within the currentinstrument list. When you click on a line, it is selected for order activities, as shown:The right side of the Trader section enables monitoring of an instrument and access to trading of theselected instrument, as illustrated:Algorithmic Trading Accelerator Guide 5.314
Using the Order Management SystemThe market depth and flow information take the pulse of the market for the selected instrument. Youcan then specify the quantity, type, and price of the intended trade. Clicking the Buy or Sell buttonsubmits the order, and then records the transaction in the blotter section. In addition to standardDMA capabilities, this screen supports launching trading strategies directly from this panel. Forsingle instrument strategies, the dialog will reflect the selected instrument and its symbol set in thealgo creation dialog.You can open multiple Trader windows to monitor selected instruments.Blotter sectionThe Blotter section provides the status of orders about trades for the subscribed symbol sets. It alsowill reflect orders that have been blocked by the firewall. You can clear the blotter listings; however,underlying open orders will continue to process. You can open multiple blotter windows but theywill all reflect the same data and when one is cleared, they all are cleared.Running the ATA samplesBlotter Window FieldsThe Blotter window fields are:Field NameSymbolAlgorithmic Trading Accelerator Guide 5.3DescriptionThe name of the symbol15
Using the Order Management SystemField NameDescriptionSideThe side of the symbol where BUY has a greenbackground, and SELL has a red background.QuantityThe total quantity requested by this orderPriceThe price issued with this orderTypeThe type of order: MARKET, LIMIT, FOREXPREVIOUSLY QUOTEDMARKET, FOREX LIMIT,orMKTWhen checked, order is acknowledged to be in the marketCANWhen checked, order has been cancelledRemainingThe quantity not yet traded on this orderAvg PriceThe average price gained on this orderStatus MessageThe latest status message – click on order to see full listAlgorithmOMS is from this dashboard, alternatively it will show thename of the algorithm that issued the orderIssuedThe time and date that the order was issuedUsing the Order Management SystemBackground EffectsBackgrounds and text colors indicate an order's status:Grey background — Order issued; not yet acknowledged from the marketYellow background — Order acknowledged and working in the marketWhite background — Order acknowledged and no longer in market (completed, cancelled, rejected,etc.)Using the Order Management SystemAlgorithmic Trading Accelerator Guide 5.316
Using Algorithmic Trading StrategiesOrder DetailsClicking on an order line displays details about the selected order, as shown:In this panel you can:Modify the quantity, price, and type of the order (if the underlying exchange supports thesechanges).Cancel the orderView history of all activity recorded on that order.When an order is complete, as shown, its history and details are displayed.A completed order can no longer be edited or cancelled.Using the Order Management SystemUsing Algorithmic Trading StrategiesThe Algorithmic Trading Accelerator provides several pre-defined strategies that were created in theApama Scenario Manager.Note: You will learn later how to modify them to derive your own algorithms, and to redefine thedashboards in the Apama Dashboard Studio to suit your needs.Running the ATA samplesAlgos Home PageAlgorithmic Trading Accelerator Guide 5.317
Using Algorithmic Trading StrategiesThe Algorithmic Strategies page's Home tab lists and describes all the available strategies, as shown:To select a strategy, either choose it on the pulldown menu, or click on the strategy in the scrollinglist.Note: The strategies provided in the installation are intended for demonstration and might be usedas starting points for custom strategies. These strategies are not intended for production use untilyou have validated their behaviors in thorough offline tests with your adapters under real marketconditions.Using Algorithmic Trading StrategiesCrossoverThe Crossover scenario calculates two moving averages for a given instrument—one over a longperiod and the other over a shorter period. The length of the windows can be configured to suitmarket and instrument volatility. A trading opportunity is identified when the two moving averagescross each other. The direction of the cross directs the side of the order. When the long term line risesabove the short term line, a BUY order is issued for the clip quantity. When the short term line risesabove the long term line, a SELL order is issued for the clip quantity.Algorithmic Trading Accelerator Guide 5.318
Using Algorithmic Trading StrategiesSelect an instance in the Scenario Instances to view its data in the graphic section.To run strategies, click Create New. In the Crossover: Create dialog box, choose from the symbolsets towhich you are subscribed, and then an instrument in the selected set, as shown:When you change the value of a parameter, press Enter (while focus is on that field) to persist thechange.Click Create to save the parameters, and then click on its line on the page to run the strategy. Createas many strategies as you want. This type of strategy has no defined end, so you need to explicitlystop each strategy instance.This strategy exposes an important concept. The strategies that you create in a dashboard are activein the server on behalf of the current user. When you close all your running dashboards, the strategywill continue until the server is stopped. When you reconnect later from any browser, the activeAlgorithmic Trading Accelerator Guide 5.319
Using Algorithmic Trading Strategiesstrategies can be viewed. After a server restart, the strategies and pending orders are not active. Theuser's position in each instrument was persisted and is displayed in the dashboard.Using Algorithmic Trading StrategiesIcebergThe iceberg strategy (also known as wave-trading, clipping, and quantity hiding) splits a givenquantity into a number of smaller volumes, and then regularly issues partial orders into the marketfor the full order. This allows potentially large orders to be filled with minimum market impactand helps with situations of poor liquidity. The dashboard shows the progress of each scenario insummary and in detail when selected.Select an instance in the Scenario Instances to view its data in the graphic section.To run strategies, click Create New. In the Iceberg Trading: Create dialog box, choose from thesymbolsets to which you are subscribed, and then an instrument in the selected set, as shown:Algorithmic Trading Accelerator Guide 5.320
Using Algorithmic Trading StrategiesWhen you change the value of a parameter, press Enter (while focus is on that field) to persist thechange.Click Create to save the parameters, and then click on its line on the page to run the strategy. Createas many strategies as you want.Using Algorithmic Trading StrategiesMomentum TradingMomentum trading identifies a strong trend in the market and attempts to follow that trend. When atrend is identified it takes up a position, and then monitors the market. If the trend continues, it takesup another position, and continues to do so. Once the trend is identified as completed, the positionbuilt up is then neutralized. This scenario is intended for use on large trends in the market ratherthan constant intra-day trading such as statistical arbitrage.Algorithmic Trading Accelerator Guide 5.321
Using Algorithmic Trading StrategiesSelect an instance in the Scenario Instances to view its data in the graphic section.To run strategies, click Create New. In the Momentum Trading: Create dialog box, choose from thesymbolsets to which you are subscribed, and then an instrument in the selected set, as shown:When you change the value of a parameter, press Enter (while focus is on that field) to persist thechange.Click Create to save the parameters, and then click on its line on the page to run the strategy. Createas many strategies as you want.Using Algorithmic Trading StrategiesAlgorithmic Trading Accelerator Guide 5.322
Using Algorithmic Trading StrategiesOrder SlicingOrder slicing is a strategy that uses VWAP over a time window to trigger placing orders in themarket. Order execution is wave traded as a limit order until a timeout occurs. It is then converted tomarket order for any remaining shares.Note: To view data in the upper graph, you must first select an instance in the table.You can choose to see Average Price instead of Remaining:Algorithmic Trading Accelerator Guide 5.323
Using Algorithmic Trading StrategiesTo run strategies, click Create New. In the Order Slicing: Create dialog box, choose from the symbolsetsto which you are subscribed, and then choose an instrument in the selected set, as shown:Parameters for order slicing include:Duration (strategy run time)VWAP Period (time window to calculate the vwap value)Max time in market (time period in market as limit order before any remainder is converted to amarket order).Limit Offset (time limit offset (price additive at which to sell)Limit time (time in market before re-price against new vwap)When you change the value of a parameter, press Enter (while focus is on that field) to persist thechange.Click Create to save the parameters, and then click on its line on the page to run the strategy. Createas many strategies as you want.Using Algorithmic Trading StrategiesPercentage of Volume (POV)Algorithmic Trading Accelerator Guide 5.324
Using Algorithmic Trading StrategiesThe Percentage of Volume execution strategy follows the volume traded in the market anddistributes a specified quantity over time, in proportion to the total quantity traded in the market.This is much like iceberg trading an order but will follow market volume rather than trading clips ofa fixed size. The purpose of this algo is to minimize mar
Algorithmic Trading Accelerator Guide 5.3 5 Chapter 1: Overview of the Algorithmic Trading Accelerator The Algorithmic Trading Accelerator (ATA) installs with the Capital Markets Foundation (CMF). Unlike solutions that offer commoditized, pre-defined