Transcription
IntroductionThis booklet answers some of the basic questions askedby the newcomer to vibration measurement. It gives abrief explanation to the following:See Page2 & 3Why do we measure vibration?See PageEnvironmental Influences — Cable Noise19Where does it come from?3Other Environmental InfluencesWhat is vibration?4Accelerometer calibration22How to quantify the vibration level5A simple calibrator23The vibration parameters, Acceleration,Velocity and DisplacementForce and impedance measurements246Logarithmic scales and decibels25Measurement Units6Why use an accelerometer preamplifier?26Which parameter to measure7The vibration meter27The piezoelectric accelerometer8What is frequency analysis?28Practical accelerometer designs92920 & 21Accelerometer types10Constant bandwidth or constant percentagebandwidth frequency analysisAccelerometer characteristics11Filter bandwidth considerations30Accelerometer frequency range12Defining the filter bandwidth31Avoiding errors due to accelerometer resonance13Measuring instrumentation32Choosing a mounting position for theaccelerometerRecording results3314Using vibration measurements34Vibration as a machine condition indicator35How to mount the accelerometer15 & 16Environmental Influences — General17Environmental Influences — Temperature18Vibration trouble shooting chartsVibration and the human body36 & 37381Revision September 1982
BackgroundSince man began to build machines for industrial use,and especially since motors have been used to powerthem, problems of vibration reduction and isolation haveengaged engineers.Gradually, as vibration isolation and reduction techniques have become an integral part of machine design,the need for accurate measurement and analysis of mechanical vibration has grown. This need was largely satisfied, for the slow and robust machines of yesteryear,by the experienced ear and touch of the plant engineer,or by simple optical instruments measuring vibratory displacement.Over the last 15 or 20 years a whole new technology ofvibration measurement has been developed which is suitable for investigating modern highly stressed, high speedmachinery. Using piezoelectric accelerometers to convertvibratory motion into an electrical signal, the process ofmeasurement and analysis is ably performed by the versatile abilities of electronics.2
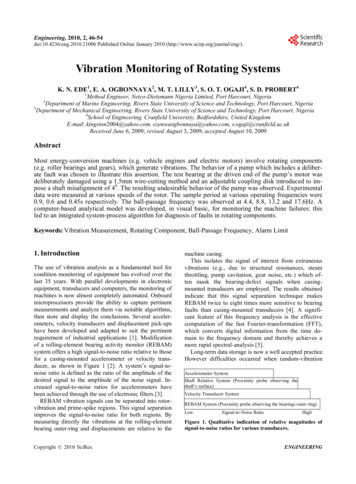
Where does it come from?In practice it is very difficult to avoid vibration. It usuallyoccurs because of the dynamic effects of manufacturingtolerances, clearances, rolling and rubbing contact between machine parts and out-of-balance forces in rotating and reciprocating members. Often, small insignificant vibrations can excite the resonant frequencies ofsome other structural parts and be amplified into majorvibration and noise sources.Sometimes though, mechanical vibration performs a useful job. For example, we generate vibration intentionallyin component feeders, concrete compactors, ultrasoniccleaning baths, rock drills and pile drivers. Vibration testing machines are used extensively to impart a controlledlevel of vibration energy to products and sub-assemblieswhere it is required to examine their physical or functional response and ascertain their resistability to vibration work,whether it is in the design of machines which utilize itsenergies or in the creation and maintenance of smoothlyrunning mechanical products, is the ability to obtain anaccurate description of the vibration by measurementand analysis.3
What is Vibration?A body is said to vibrate when it describes an oscillatingmotion about a reference position. The number of timesa complete motion cycle takes place during the period ofone second is called the Frequency and is measured inhertz (Hz).The motion can consists of a single component occuringat a single frequency, as with a tuning fork, or of severalcomponents occuring at different frequencies simultaneously, as for example, with the piston motion of an internal combusion engine.Vibration signals in practice usually consist of very manyfrequencies occuring simultaneously so that we cannotimmediately see just by looking at the amplitude-timepattern, how many components there are, and at whatfrequencies they occur.These components can be revealed by plotting vibrationamplitude against frequency. The breaking down of vibration signals into individual frequency components iscalled frequency analysis, a technique which may be considered the cornerstone of diagnostic vibration measurements. The graph showing the vibration level as a function of frequency is called a frequency spectrogram.When frequency analyzing machine vibrationsmally find a number of prominent periodiccomponents which are directly related to thetal movements of various parts of the machine.quency analysis we are therefore able to tracksource of undesirable vibration.4we norfrequencyfundamenWith fredown the
Quantifying the Vibration cwhich describes the severity of the vibration, can be quantified in several ways. On the diagram, the relationship between the peak-to-peak level, the peak level, theaverage level and the RMS level of a sinewave is shown.The peak-to-peak value is valuable in that it indicates themaximum excursion of the wave, a useful quantitywhere, for example, the vibratory displacement of a machine part is critical for maximum stress or mechanicalclearance considerations.The peak value is particularly valuable for indicating thelevel of short duration shocks etc. But, as can be seen fromthe drawing, peak values only indicate what maximum levelhas occurred, no account is taken of the time history of thewave.The rectified average value, on the other hand, does takethe time history of the wave into account, but is considered of limited practical interest because it has no directrelationship with any useful physical quantity.The RMS value is the most relevant measure of amplitude because it both takes the time history of the waveinto account and gives an amplitude value which is directly related to the energy content, and therefore thedestructive abilities of the vibration.5
The Vibration Parameters, Acceleration, Velocity and Displacement.Measuring UnitsWhen we looked at the vibrating tuning fork we considered the amplitude of the wave as the physical displacement of the fork ends to either side of the rest position.In addition to Displacement we can also describe themovement of the fork leg in terms of its velocity and itsacceleration. The form and period of the vibration remainthe same whether it is the displacement, velocity or acceleration that is being considered. The main differenceis that there is a phase difference between the amplitude-time curves of the three parameters as shown inthe drawing.For sinusoidal signals, displacement, velocity and acceleration amplitudes are related mathematically by a function of frequency and time, this is shown graphically inthe diagram. If phase is neglected, as is always the casewhen making time-average measurements, then the velocity level can be obtained by dividing the accelerationsignal by a factor proportional to frequency, and the displacement can be obtained by dividing the accelerationsignal by a factor proportional to the square of frequency. This division is performed by electronic integrators in the measuring instrumentation.The vibration parameters are almost universally measured in metric units in accordance with ISO requirements, these are shown in the table. The gravitationalconstant "g" is still widely used for acceleration levels although it is outside the ISO system of coherent units.Fortunately a factor of almost 10 (9,81) relates the twounits so that mental conversion within 2% is a simplematter.6
Considerations in choosing Acceleration,Velocity, or Displacement parametersBy detecting vibratory acceleration we are not tied tothat parameter alone, with electronic integrators we canconvert the acceleration signal to velocity and displacement. Most modern vibration meters are equipped tomeasure all three parameters.Where a single, wide frequency band vibration measurement is made, the choice of parameter is important ifthe signal has components at many frequencies. Measurement of displacement will give the low frequencycomponents most weight and conversely accelerationmeasurements will weight the level towards the high frequency components.Experience has shown that the overall RMS value of vibration velocity measured over the range 10 to 1000 Hzgives the best indication of a vibration's severity. A probable explanation is that a given velocity level corresponds to a given energy level so that vibration at lowand high frequencies are equally weighted from a vibration energy point of view. In practice many machineshave a reasonably flat velocity spectrum.Where narrow band frequency analysis is performed thechoice of parameter will be reflected only in the way theanalysis plot is tilted on the chart paper (as demon-strated in the middle diagram on the opposite page). Thisleads us to a practical consideration that can influencethe choice of parameter. It is advantageous to select theparameter which gives the flattest frequency spectrum inorder to best utilise the dynamic range (the difference between the smallest and largest values that can be measured) of the instrumentation. For this reason the velocity or acceleration parameter is normally selected for frequency analysis purposes.Because acceleration measurements are weighted towardshighfrequency vibrationcomponents,thisparameters tends to be used where the frequency rangeof interest covers high frequencies.The nature of mechanical systems is such that appreciable displacements only occur at low frequencies, therefore displacement measurements are of limited value inthe general study of mechanical vibration. Where smallclearances between machine elements are being considered, vibratory displacement is of course an importantconsideration. Displacement is often used as an indicator of unbalance in rotating machine parts because relatively large displacements usually occur at the shaft rotational frequency, which is also the frequency of greatestinterest for balancing purposes.7
The Piezoelectric AccelerometerThe transducer which, nowadays, is more-or-less universally used for vibration measurements is the piezoelectric accelerometer. It exhibits better all-round characteristics than any other type of vibration transducer. It hasvery wide frequency and dynamic ranges with good linearity throughout the ranges. It is relatively robust and reliable so that its characteristics remain stable over a longperiod of time.Additionally, the piezoelectric accelerometer is self-generating, so that it doesn't need a power supply. There areno moving parts to wear out, and finally, its accelerationproportional output can be integrated to give velocity anddisplacement proportional signals.The heart of a piezoelectric accelerometer is the slice ofpiezoelectric material, usually an artificially polarized ferroelectric ceramic, which exhibits the unique piezoelectric effect. When it is mechanically stressed, either intension, compression or shear, it generates an electricalcharge across its pole faces which is proportional to theapplied force.8
Practical Accelerometer DesignsIn practical accelerometer designs, the piezoelectric element is arranged so that when the assembly is vibratedthe mass applies a force to the piezoelectric elementwhich is proportional to the vibratory acceleration. Thiscan be seen from the law, Force Mass x Acceleration.For frequencies lying well under the resonant frequencyof the complete spring-mass system, the acceleration ofthe mass will be the same as the acceleration of thebase, and the output signal magnitude will therefore beproportional to the acceleration to which the pick-up issubjected.Two configurations are in common use:The Compression Type where the mass exerts a compressive force on the piezoelectric element andThe Shear Type where the mass exerts a shear force onthe piezoelectric element.9
Accelerometer TypesMost manufacturers have a wide range of accelerometers,at first sight may be too many to make the choice easy. Asmall group of "general purpose" types will satisfy mostneeds. These are available with either top or side mountedconnectors and have sensitivities in the range 1 to 10 mVor pC per m/s2. The Brüel & Kjær Uni-Gain types havetheir sensitivity normalized to a convenient "round figure"such as 1 or 10 pC/ms-2 to simplify calibration of themeasuring system.The remaining accelerometers have their characteristicsslanted towards a particular application. For example,small size acclerometers that are intended for high level orhigh frequency measurements and for use on delicatestructures, panels, etc. and which weigh only 0,5 to 2grammes.Other special purpose types are optimized for: rplanes; high temperatures; very low vibration levels; highlevel shocks; calibration of other accelerometers by comparison; and for permanent monitoring on industrialmachines.10
Accelerometer Characteristics (Sensitivity, Mass and Dynamic Range)The sensitivity is the first characteristic normally considered. Ideally we would like a high output level, but herewe have to compromise because high sensitivity normally entails a relatively big piezoelectric assembly andconsequently a relatively large, heavy unit.In normal circumstances the sensitivity is not a criticalproblem as modern preamplifiers are designed to acceptthese low level signals.The mass of the accelerometers becomes importantwhen measuring on light test objects. Additional masscan significantly alter the vibration levels and frequencies at the measuring point.As a general rule, the accelerometer mass should be nomore than one tenth of the dynamic mass of the vibrating part onto whic
vibration measurement has been developed which is suit- able for investigating modern highly stressed, high speed machinery. Using piezoelectric accelerometers to convert vibratory motion into an electrical signal, the process of measurement and analysis is ably performed by the vers-