Transcription
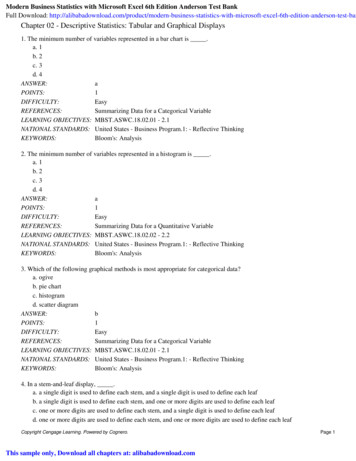
Modern Business Statistics with Microsoft Excel 6th Edition Anderson Test BankFull Download: son-test-banChapter 02 - Descriptive Statistics: Tabular and Graphical Displays1. The minimum number of variables represented in a bar chart is .a. 1b. 2c. 3d. zing Data for a Categorical VariableLEARNING OBJECTIVES: MBST.ASWC.18.02.01 - 2.1NATIONAL STANDARDS: United States - Business Program.1: - Reflective ThinkingKEYWORDS:Bloom's: Analysis2. The minimum number of variables represented in a histogram is .a. 1b. 2c. 3d. zing Data for a Quantitative VariableLEARNING OBJECTIVES: MBST.ASWC.18.02.02 - 2.2NATIONAL STANDARDS: United States - Business Program.1: - Reflective ThinkingKEYWORDS:Bloom's: Analysis3. Which of the following graphical methods is most appropriate for categorical data?a. ogiveb. pie chartc. histogramd. scatter ummarizing Data for a Categorical VariableLEARNING OBJECTIVES: MBST.ASWC.18.02.01 - 2.1NATIONAL STANDARDS: United States - Business Program.1: - Reflective ThinkingKEYWORDS:Bloom's: Analysis4. In a stem-and-leaf display, .a. a single digit is used to define each stem, and a single digit is used to define each leafb. a single digit is used to define each stem, and one or more digits are used to define each leafc. one or more digits are used to define each stem, and a single digit is used to define each leafd. one or more digits are used to define each stem, and one or more digits are used to define each leafCopyright Cengage Learning. Powered by Cognero.This sample only, Download all chapters at: alibabadownload.comPage 1
Chapter 02 - Descriptive Statistics: Tabular and Graphical NG OBJECTIVES:NATIONAL STANDARDS:KEYWORDS:c1EasySummarizing Data for a Quantitative VariableMBST.ASWC.18.02.02 - 2.2United States - Business Program.1: - Reflective ThinkingBloom's: Knowledge5. A graphical method that can be used to show both the rank order and shape of a data set simultaneously is a .a. relative frequency distributionb. pie chartc. stem-and-leaf displayd. pivot marizing Data for a Quantitative VariableLEARNING OBJECTIVES: MBST.ASWC.18.02.02 - 2.2NATIONAL STANDARDS: United States - Business Program.1: - Reflective ThinkingKEYWORDS:Bloom's: Analysis6. The proper way to construct a stem-and-leaf display for the data set {62, 67, 68, 73, 73, 79, 91, 94, 95, 97} is to .a. exclude a stem labeled ‘8’b. include a stem labeled ‘8’ and enter no leaves on the stemc. include a stem labeled ‘(8)’ and enter no leaves on the stemd. include a stem labeled ‘8’ and enter one leaf value of ‘0’ on the arizing Data for a Quantitative VariableLEARNING OBJECTIVES: MBST.ASWC.18.02.02 - 2.2NATIONAL STANDARDS: United States - Business Program.1: - Reflective ThinkingKEYWORDS:Bloom's: Knowledge7. Data that provide labels or names for groupings of like items are known as .a. categorical datab. quantitative datac. label datad. generic arizing Data for a Categorical VariableLEARNING OBJECTIVES: MBST.ASWC.18.02.01 - 2.1Copyright Cengage Learning. Powered by Cognero.Page 2
Chapter 02 - Descriptive Statistics: Tabular and Graphical DisplaysNATIONAL STANDARDS: United States - Business Program.1: - Reflective ThinkingKEYWORDS:Bloom's: Knowledge8. A researcher is gathering data from four geographical areas designated: South 1; North 2; East 3; West 4. Thedesignated geographical regions represent .a. categorical datab. quantitative datac. directional datad. either quantitative or categorical arizing Data for a Categorical VariableLEARNING OBJECTIVES: MBST.ASWC.18.02.01 - 2.1NATIONAL STANDARDS: United States - Business Program.1: - Reflective ThinkingKEYWORDS:Bloom's: Comprehension9. A researcher asked 20 people for their zip code. The respondents zip codes are an example of .a. categorical datab. quantitative datac. label datad. category arizing Data for a Categorical VariableLEARNING OBJECTIVES: MBST.ASWC.18.02.01 - 2.1NATIONAL STANDARDS: United States - Business Program.1: - Reflective ThinkingKEYWORDS:Bloom's: Comprehension10. The age of employees at a company is an example of .a. categorical datab. quantitative datac. label datad. time series arizing Data for a Quantitative VariableLEARNING OBJECTIVES: MBST.ASWC.18.02.02 - 2.2NATIONAL STANDARDS: United States - Business Program.1: - Reflective ThinkingKEYWORDS:Bloom's: Comprehension11. A frequency distribution is a .Copyright Cengage Learning. Powered by Cognero.Page 3
Chapter 02 - Descriptive Statistics: Tabular and Graphical Displaysa. tabular summary of a set of data showing the fraction of items in each of several nonoverlapping classesb. graphical form of representing datac. tabular summary of a set of data showing the number of items in each of several nonoverlapping classesd. graphical device for presenting categorical arizing Data for a Quantitative VariableLEARNING OBJECTIVES: MBST.ASWC.18.02.02 - 2.2NATIONAL STANDARDS: United States - Business Program.1: - Reflective ThinkingKEYWORDS:Bloom's: Knowledge12. The sum of frequencies for all classes will always equal .a. 1b. the number of elements in a data setc. the number of classesd. a value between 0 and zing Data for a Quantitative VariableLEARNING OBJECTIVES: MBST.ASWC.18.02.02 - 2.2NATIONAL STANDARDS: United States - Business Program.1: - Reflective ThinkingKEYWORDS:Bloom's: Comprehension13. In constructing a frequency distribution, as the number of classes is decreased, the class width .a. decreasesb. remains unchangedc. increasesd. can increase or decrease depending on the data mmarizing Data for a Quantitative VariableLEARNING OBJECTIVES: MBST.ASWC.18.02.02 - 2.2NATIONAL STANDARDS: United States - Business Program.1: - Reflective ThinkingKEYWORDS:Bloom's: Analysis14. If several frequency distributions are constructed from the same data set, the distribution with the widest class widthwill have the .a. fewest classesb. most classesc. same number of classes as the other distributions since all are constructed from the same datad. None of the answers is correct.Copyright Cengage Learning. Powered by Cognero.Page 4
Chapter 02 - Descriptive Statistics: Tabular and Graphical NG OBJECTIVES:NATIONAL STANDARDS:KEYWORDS:a1EasySummarizing Data for a Quantitative VariableMBST.ASWC.18.02.02 - 2.2United States - Business Program.1: - Reflective ThinkingBloom's: Analysis15. Excel's can be used to construct a frequency distribution for categorical data.a. DISTRIBUTION functionb. SUM functionc. FREQUENCY functiond. COUNTIF Summarizing Data for a Categorical VariableLEARNING OBJECTIVES: MBST.ASWC.18.02.01 - 2.1NATIONAL STANDARDS: United States - Business Program.1: - Reflective ThinkingKEYWORDS:Bloom's: Knowledge16. There are 20 boys and 8 girls in a class. What type of graph can be used to display this information?a. bar graphb. stem-and-leaf plotc. histogramd. scatter ata Visualization: Best Practices in Creating Effective Graphical DisplaysLEARNING OBJECTIVES: MBST.ASWC.18.02.05 - 2.5NATIONAL STANDARDS: United States - Business Program.1: - Reflective ThinkingKEYWORDS:Bloom's: Comprehension17. The relative frequency of a class is computed by .a. dividing the midpoint of the class by the sample sizeb. dividing the frequency of the class by the midpointc. dividing the sample size by the frequency of the classd. dividing the frequency of the class by the sample arizing Data for a Quantitative VariableLEARNING OBJECTIVES: MBST.ASWC.18.02.02 - 2.2Copyright Cengage Learning. Powered by Cognero.Page 5
Chapter 02 - Descriptive Statistics: Tabular and Graphical DisplaysNATIONAL STANDARDS: United States - Business Program.1: - Reflective ThinkingKEYWORDS:Bloom's: Knowledge18. The sum of the relative frequencies for all classes will always equal .a. the sample sizeb. the number of classesc. 1d. rizing Data for a Categorical VariableLEARNING OBJECTIVES: MBST.ASWC.18.02.01 - 2.1NATIONAL STANDARDS: United States - Business Program.1: - Reflective ThinkingKEYWORDS:Bloom's: Knowledge19. The height and weight are recorded by the school nurse for every student in a school. What type of graph would bestdisplay the relationship between height and weight?a. bar graphb. stem-and-leaf plotc. histogramd. scatter ummarizing Data for Two Variables Using Graphical DisplaysLEARNING OBJECTIVES: MBST.ASWC.18.02.04 - 2.4NATIONAL STANDARDS: United States - Business Program.1: - Reflective ThinkingKEYWORDS:Bloom's: Comprehension20. The percent frequency of a class is computed by .a. multiplying the relative frequency by 10b. dividing the relative frequency by 100c. multiplying the relative frequency by 100d. adding 100 to the relative :Summarizing Data for a Categorical VariableLEARNING OBJECTIVES: MBST.ASWC.18.02.01 - 2.1NATIONAL STANDARDS: United States - Business Program.1: - Reflective ThinkingKEYWORDS:Bloom's: Knowledge21. A dot plot can be used to display .Copyright Cengage Learning. Powered by Cognero.Page 6
Chapter 02 - Descriptive Statistics: Tabular and Graphical Displaysa. the relationship between two quantitative variablesb. the percent a particular category is of the wholec. the distribution of one quantitative variabled. Simpson’s ummarizing Data for a Quantitative VariableLEARNING OBJECTIVES: MBST.ASWC.18.02.02 - 2.2NATIONAL STANDARDS: United States - Business Program.1: - Reflective ThinkingKEYWORDS:Bloom's: Knowledge22. In a cumulative frequency distribution, the last class will always have a cumulative frequency equal to .a. 1b. 100%c. the total number of elements in the data setd. None of the answers is Summarizing Data for a Quantitative VariableLEARNING OBJECTIVES: MBST.ASWC.18.02.02 - 2.2NATIONAL STANDARDS: United States - Business Program.1: - Reflective ThinkingKEYWORDS:Bloom's: Comprehension23. What is the difference between a bar graph and a histogram?a. There is no difference between a bar graph and a histogram.b. A histogram displays quantitative data, while a bar graph displays categorical data.c. A histogram must have space between the bars, while a bar graph has no spaces between the bars.d. None of the answers is CES:Summarizing Data for a Quantitative VariableLEARNING OBJECTIVES: MBST.ASWC.18.02.02 - 2.2NATIONAL STANDARDS: United States - Business Program.1: - Reflective ThinkingKEYWORDS:Bloom's: Comprehension24. College students were surveyed to determine how much they planned to spend in various categories during theupcoming academic year. One category is the amount spent on school supplies. The graphs below show the amount ofmoney spent on school supplies by women and men.Copyright Cengage Learning. Powered by Cognero.Page 7
Chapter 02 - Descriptive Statistics: Tabular and Graphical DisplaysApproximately what percent of women spend more than 105 on school supplies?a. 5%b. 10%c. 15%d. ummarizing Data for a Quantitative VariableLEARNING OBJECTIVES: MBST.ASWC.18.02.02 - 2.2NATIONAL STANDARDS: United States - Business Program.1: - Reflective ThinkingKEYWORDS:Bloom's: Comprehension25. The difference between the lower class limits of adjacent classes provides the .a. number of classesb. class limitsc. class midpointd. class marizing Data for a Quantitative VariableLEARNING OBJECTIVES: MBST.ASWC.18.02.02 - 2.2NATIONAL STANDARDS: United States - Business Program.1: - Reflective ThinkingKEYWORDS:Bloom's: KnowledgeExhibit 2-1The numbers of hours worked (per week) by 400 statistics students are shown below.Copyright Cengage Learning. Powered by Cognero.Page 8
Chapter 02 - Descriptive Statistics: Tabular and Graphical DisplaysNumber of Hours0 x 1010 x 2020 x 3030 x 40Frequency208020010026. Refer to Exhibit 2-1. The class width for this distribution .a. is 9b. is 10c. is 40, which is the largest value minus the smallest value or 40 0 40d. varies from class to marizing Data for a Quantitative VariableLEARNING OBJECTIVES: MBST.ASWC.18.02.02 - 2.2NATIONAL STANDARDS: United States - Business Program.1: - Reflective ThinkingKEYWORDS:Bloom's: Comprehension27. Refer to Exhibit 2-1. The midpoint of the last class is .a. 50b. 34c. 35d. Summarizing Data for a Quantitative VariableLEARNING OBJECTIVES: MBST.ASWC.18.02.02 - 2.2NATIONAL STANDARDS: United States - Business Program.1: - Reflective ThinkingKEYWORDS:Bloom's: Comprehension28. Refer to Exhibit 2-1. The number of students working less than 20 hours is .a. 80b. 100c. 180d. rizing Data for a Quantitative VariableLEARNING OBJECTIVES: MBST.ASWC.18.02.02 - 2.2NATIONAL STANDARDS: United States - Business Program.1: - Reflective ThinkingCopyright Cengage Learning. Powered by Cognero.Page 9
Chapter 02 - Descriptive Statistics: Tabular and Graphical DisplaysKEYWORDS:Bloom's: Analysis29. Refer to Exhibit 2-1. The relative frequency of students working less than 10 hours is .a. 20b. 100c. .95d. ummarizing Data for a Quantitative VariableLEARNING OBJECTIVES: MBST.ASWC.18.02.02 - 2.2NATIONAL STANDARDS: United States - Business Program.1: - Reflective ThinkingKEYWORDS:Bloom's: Analysis30. Refer to Exhibit 2-1. The cumulative relative frequency for the class of 2030 is .a. 300b. .25c. .75d. mmarizing Data for a Quantitative VariableLEARNING OBJECTIVES: MBST.ASWC.18.02.02 - 2.2NATIONAL STANDARDS: United States - Business Program.1: - Reflective ThinkingKEYWORDS:Bloom's: Analysis31. Refer to Exhibit 2-1. The percentage of students working between 10 and 20 hours is .a. 20%b. 25%c. 75%d. ummarizing Data for a Quantitative VariableLEARNING OBJECTIVES: MBST.ASWC.18.02.02 - 2.2NATIONAL STANDARDS: United States - Business Program.1: - Reflective ThinkingKEYWORDS:Bloom's: Analysis32. Refer to Exhibit 2-1. The percentage of students working less than 20 hours is .a. 20%b. 25%Copyright Cengage Learning. Powered by Cognero.Page 10
Chapter 02 - Descriptive Statistics: Tabular and Graphical Displaysc. 75%d. 80%ANSWER:POINTS:DIFFICULTY:REFERENCES:LEARNING OBJECTIVES:NATIONAL STANDARDS:KEYWORDS:b1EasySummarizing Data for a Quantitative VariableMBST.ASWC.18.02.02 - 2.2United States - Business Program.1: - Reflective ThinkingBloom's: Analysis33. Refer to Exhibit 2-1. The cumulative percent frequency for the class of 30 to 40 is .a. 100%b. 75%c. 50%d. ummarizing Data for a Quantitative VariableLEARNING OBJECTIVES: MBST.ASWC.18.02.02 - 2.2NATIONAL STANDARDS: United States - Business Program.1: - Reflective ThinkingKEYWORDS:Bloom's: Analysis34. Refer to Exhibit 2-1. The cumulative frequency for the class of 20 to 30 is .a. 200b. 300c. .75d. ummarizing Data for a Quantitative VariableLEARNING OBJECTIVES: MBST.ASWC.18.02.02 - 2.2NATIONAL STANDARDS: United States - Business Program.1: - Reflective ThinkingKEYWORDS:Bloom's: Analysis35. Refer to Exhibit 2-1. If a cumulative frequency distribution is developed for the above data, the last class will have acumulative frequency of .a. 100b. 1c. 30 39d. 400ANSWER:dPOINTS:1Copyright Cengage Learning. Powered by Cognero.Page 11
Chapter 02 - Descriptive Statistics: Tabular and Graphical DisplaysDIFFICULTY:REFERENCES:LEARNING OBJECTIVES:NATIONAL STANDARDS:KEYWORDS:ModerateSummarizing Data for a Quantitative VariableMBST.ASWC.18.02.02 - 2.2United States - Business Program.1: - Reflective ThinkingBloom's: Analysis36. Refer to Exhibit 2-1. The percentage of students who work at least 10 hours per week is .a. 50%b. 5%c. 95%d. Summarizing Data for a Quantitative VariableLEARNING OBJECTIVES: MBST.ASWC.18.02.02 - 2.2NATIONAL STANDARDS: United States - Business Program.1: - Reflective ThinkingKEYWORDS:Bloom's: AnalysisExhibit 2-2Information on the type of industry is provided for a sample of 50 Fortune 500 companies.Industry TypeBankingConsumer ProductsElectronicsRetailFrequency715101837. Refer to Exhibit 2-2. The number of industries that are classified as retail is .a. 32b. 18c. 0.36d. rizing Data for a Categorical VariableLEARNING OBJECTIVES: MBST.ASWC.18.02.01 - 2.1NATIONAL STANDARDS: United States - Business Program.1: - Reflective ThinkingKEYWORDS:Bloom's: Comprehension38. Refer to Exhibit 2-2. The relative frequency of industries that are classified as banking is .a. 7b. .07c. .70d. .14Copyright Cengage Learning. Powered by Cognero.Page 12
Chapter 02 - Descriptive Statistics: Tabular and Graphical NG OBJECTIVES:NATIONAL STANDARDS:KEYWORDS:d1ModerateSummarizing Data for a Categorical VariableMBST.ASWC.18.02.01 - 2.1United States - Business Program.1: - Reflective ThinkingBloom's: Analysis39. Refer to Exhibit 2-2. The percent frequency of industries that are classified as electronics is .a. 10b. 20c. .10d. ummarizing Data for a Categorical VariableLEARNING OBJECTIVES: MBST.ASWC.18.02.01 - 2.1NATIONAL STANDARDS: United States - Business Program.1: - Reflective ThinkingKEYWORDS:Bloom's: AnalysisExhibit 2-3The number of sick days taken (per month) by 200 factory workers is summarized below.Number of Days0 56 1011 1516 20Frequency1206514140. Refer to Exhibit 2-3. The class width for this distribution .a. is 5b. is 6c. is 20, which is the largest value minus the smallest value or 20 0 20d. varies between 5 and marizing Data for a Categorical VariableLEARNING OBJECTIVES: MBST.ASWC.18.02.01 - 2.1NATIONAL STANDARDS: United States - Business Program.1: - Reflective ThinkingKEYWORDS:Bloom's: Analysis41. Refer to Exhibit 2-3. The midpoint of the first class is .a. 10b. 2Copyright Cengage Learning. Powered by Cognero.Page 13
Chapter 02 - Descriptive Statistics: Tabular and Graphical Displaysc. 2.5d. 3ANSWER:POINTS:DIFFICULTY:REFERENCES:LEARNING OBJECTIVES:NATIONAL STANDARDS:KEYWORDS:c1ModerateSummarizing Data for a Categorical VariableMBST.ASWC.18.02.01 - 2.1United States - Business Program.1: - Reflective ThinkingBloom's: Analysis42. Refer to Exhibit 2-3. The number of workers who took less than 11 sick days per month is .a. 15b. 200c. 185d. mmarizing Data for a Categorical VariableLEARNING OBJECTIVES: MBST.ASWC.18.02.01 - 2.1NATIONAL STANDARDS: United States - Business Program.1: - Reflective ThinkingKEYWORDS:Bloom's: Analysis43. Refer to Exhibit 2-3. The number of workers who took at most 10 sick days per month is .a. 15b. 200c. 185d. mmarizing Data for a Categorical VariableLEARNING OBJECTIVES: MBST.ASWC.18.02.01 - 2.1NATIONAL STANDARDS: United States - Business Program.1: - Reflective ThinkingKEYWORDS:Bloom's: Analysis44. Refer to Exhibit 2-3. The number of workers who took more than 10 sick days per month is .a. 15b. 200c. 185d. 65ANSWER:aPOINTS:1DIFFICULTY:ModerateCopyright Cengage Learning. Powered by Cognero.Page 14
Chapter 02 - Descriptive Statistics: Tabular and Graphical DisplaysREFERENCES:LEARNING OBJECTIVES:NATIONAL STANDARDS:KEYWORDS:Summarizing Data for a Categorical VariableMBST.ASWC.18.02.01 - 2.1United States - Business Program.1: - Reflective ThinkingBloom's: Analysis45. Refer to Exhibit 2-3. The number of workers who took at least 11 sick days per month is .a. 15b. 200c. 185d. mmarizing Data for a Categorical VariableLEARNING OBJECTIVES: MBST.ASWC.18.02.01 - 2.1NATIONAL STANDARDS: United States - Business Program.1: - Reflective ThinkingKEYWORDS:Bloom's: Analysis46. Refer to Exhibit 2-3. The relative frequency of workers who took 10 or fewer sick days is .a. 185b. .925c. 93d. mmarizing Data for a Categorical VariableLEARNING OBJECTIVES: MBST.ASWC.18.02.01 - 2.1NATIONAL STANDARDS: United States - Business Program.1: - Reflective ThinkingKEYWORDS:Bloom's: Analysis47. Refer to Exhibit 2-3. The cumulative relative frequency for the class of 11 15 is .a. 199b. .07c. 1d. Summarizing Data for a Categorical VariableLEARNING OBJECTIVES: MBST.ASWC.18.02.01 - 2.1NATIONAL STANDARDS: United States - Business Program.1: - Reflective ThinkingKEYWORDS:Bloom's: AnalysisCopyright Cengage Learning. Powered by Cognero.Page 15
Chapter 02 - Descriptive Statistics: Tabular and Graphical Displays48. Refer to Exhibit 2-3. The percentage of workers who took 0 5 sick days per month is .a. 20%b. 120%c. 75%d. ummarizing Data for a Categorical VariableLEARNING OBJECTIVES: MBST.ASWC.18.02.01 - 2.1NATIONAL STANDARDS: United States - Business Program.1: - Reflective ThinkingKEYWORDS:Bloom's: Analysis49. Refer to Exhibit 2-3. The cumulative percent frequency for the class of 16 20 is .a. 100%b. 65%c. 92.5%d. Summarizing Data for a Categorical VariableLEARNING OBJECTIVES: MBST.ASWC.18.02.01 - 2.1NATIONAL STANDARDS: United States - Business Program.1: - Reflective ThinkingKEYWORDS:Bloom's: Analysis50. Refer to Exhibit 2-3. The cumulative frequency for the class of 11 15 is .a. 200b. 14c. 199d. marizing Data for a Categorical VariableLEARNING OBJECTIVES: MBST.ASWC.18.02.01 - 2.1NATIONAL STANDARDS: United States - Business Program.1: - Reflective ThinkingKEYWORDS:Bloom's: AnalysisExhibit 2-4A survey of 400 college seniors resulted in the following crosstabulation regarding their undergraduate major and whetheror not they plan to go to graduate school.Undergraduate MajorCopyright Cengage Learning. Powered by Cognero.Page 16
Chapter 02 - Descriptive Statistics: Tabular and Graphical DisplaysGraduate Other6365128Total14026040051. Refer to Exhibit 2-4. What percentage of the students does not plan to go to graduate school?a. 280%b. 520%c. 65%d. rizing Data for Two Variables Using TablesLEARNING OBJECTIVES: MBST.ASWC.18.02.03 - 2.3NATIONAL STANDARDS: United States - Business Program.1: - Reflective ThinkingKEYWORDS:Bloom's: Comprehension52. Refer to Exhibit 2-4. What percentage of the students' undergraduate major is Engineering?a. 292%b. 520%c. 65%d. :Summarizing Data for Two Variables Using TablesLEARNING OBJECTIVES: MBST.ASWC.18.02.03 - 2.3NATIONAL STANDARDS: United States - Business Program.1: - Reflective ThinkingKEYWORDS:Bloom's: Analysis53. Refer to Exhibit 2-4. Of those students who are majoring in Business, what percentage plans to go to graduate school?a. 27.78%b. 8.75%c. 70%d. S:Summarizing Data for Two Variables Using TablesLEARNING OBJECTIVES: MBST.ASWC.18.02.03 - 2.3Copyright Cengage Learning. Powered by Cognero.Page 17
Chapter 02 - Descriptive Statistics: Tabular and Graphical DisplaysNATIONAL STANDARDS: United States - Business Program.1: - Reflective ThinkingKEYWORDS:Bloom's: Analysis54. Refer to Exhibit 2-4. Among the students who plan to go to graduate school, what percentage indicated "Other"majors?a. 15.75%b. 45%c. 54%d. ummarizing Data for Two Variables Using TablesLEARNING OBJECTIVES: MBST.ASWC.18.02.03 - 2.3NATIONAL STANDARDS: United States - Business Program.1: - Reflective ThinkingKEYWORDS:Bloom's: Analysis55. A graphical device for depicting categorical data that have been summarized in a frequency distribution, relativefrequency distribution, or percent frequency distribution is a(n) .a. histogramb. stem-and-leaf displayc. ogived. bar a Visualization: Best Practices in Creating Effective Graphical DisplaysLEARNING OBJECTIVES: MBST.ASWC.18.02.05 - 2.5NATIONAL STANDARDS: United States - Business Program.1: - Reflective ThinkingKEYWORDS:Bloom's: Comprehension56. A graphical device for presenting categorical data summaries based on subdivision of a circle into sectors thatcorrespond to the relative frequency for each class is a .a. histogramb. stem-and-leaf displayc. pie chartd. bar a Visualization: Best Practices in Creating Effective Graphical DisplaysLEARNING OBJECTIVES: MBST.ASWC.18.02.05 - 2.5NATIONAL STANDARDS: United States - Business Program.1: - Reflective ThinkingKEYWORDS:Bloom's: ComprehensionCopyright Cengage Learning. Powered by Cognero.Page 18
Chapter 02 - Descriptive Statistics: Tabular and Graphical Displays57. Categorical data can be graphically represented by using a(n) .a. histogramb. frequency polygonc. ogived. bar a Visualization: Best Practices in Creating Effective Graphical DisplaysLEARNING OBJECTIVES: MBST.ASWC.18.02.05 - 2.5NATIONAL STANDARDS: United States - Business Program.1: - Reflective ThinkingKEYWORDS:Bloom's: Comprehension58. Fifteen percent of the students in a School of Business Administration are majoring in Economics, 20% in Finance,35% in Management, and 30% in Accounting. The graphical device(s) that can be used to present these data is(are).a. a line graphb. only a bar chartc. only a pie chartd. both a bar chart and a pie a Visualization: Best Practices in Creating Effective Graphical DisplaysLEARNING OBJECTIVES: MBST.ASWC.18.02.05 - 2.5NATIONAL STANDARDS: United States - Business Program.1: - Reflective ThinkingKEYWORDS:Bloom's: Comprehension59. Frequency distributions can be made for .a. categorical data onlyb. quantitative data onlyc. neither categorical nor quantitative datad. both categorical and quantitative dataANSWER:dPOINTS:1DIFFICULTY:EasyREFERENCES:Data Visualization: Best Practices in Creating Effective Graphical DisplaysLEARNING OBJECTIVES: MBST.ASWC.18.02.05 - 2.5NATIONAL STANDARDS: United States - Business Program.1: - Reflective ThinkingKEYWORDS:Bloom's: Comprehension60. The total number of data items with a value less than or equal to the upper limit for the class is given by the .a. frequency distributionb. relative frequency distributionCopyright Cengage Learning. Powered by Cognero.Page 19
Chapter 02 - Descriptive Statistics: Tabular and Graphical Displaysc. cumulative frequency distributiond. cumulative relative frequency CES:Summarizing Data for a Quantitative VariableLEARNING OBJECTIVES: MBST.ASWC.18.02.02 - 2.2NATIONAL STANDARDS: United States - Business Program.1: - Reflective ThinkingKEYWORDS:Bloom's: Knowledge61. Excel's can be used to construct a frequency distribution for quantitative data.a. COUNTIF functionb. SUM functionc. PivotTable reportd. AVERAGE Summarizing Data for a Quantitative VariableLEARNING OBJECTIVES: MBST.ASWC.18.02.02 - 2.2NATIONAL STANDARDS: United States - Business Program.1: - Reflective ThinkingKEYWORDS:Bloom's: Knowledge62. A graphical presentation of a frequency distribution, relative frequency distribution, or percent frequency distributionof quantitative data constructed by placing the class intervals on the horizontal axis and the frequencies on the verticalaxis is a .a. histogramb. bar chartc. stem-and-leaf displayd. pie marizing Data for a Quantitative VariableLEARNING OBJECTIVES: MBST.ASWC.18.02.02 - 2.2NATIONAL STANDARDS: United States - Business Program.1: - Reflective ThinkingKEYWORDS:Bloom's: Knowledge63. A common graphical presentation of quantitative data is a .a. histogramb. bar chartc. relative frequencyd. pie chartANSWER:aCopyright Cengage Learning. Powered by Cognero.Page 20
Chapter 02 - Descriptive Statistics: Tabular and Graphical DisplaysPOINTS:DIFFICULTY:REFERENCES:LEARNING OBJECTIVES:NATIONAL STANDARDS:KEYWORDS:1EasySummarizing Data for a Quantitative VariableMBST.ASWC.18.02.02 - 2.2United States - Business Program.1: - Reflective ThinkingBloom's: Knowledge64. When using Excel to create a , one must edit the chart to remove the gaps between rectangles.a. scatter diagr
United States - Business Program.1: - Reflective Thinking KEYWORDS: Bloom's: Knowledge 12. The sum of frequencies for all classes will always equal _. a. 1 b. the number of elements in a data set c. the number of classes d. a value between 0 and 1 ANSWER: b POINTS: 1 DIFFICULTY: Easy REFERENCES: Summarizing Data for a Quantitative Variable

