Transcription
Kind of accident statisticsin Great Britain, 2021Data up to March 2021Annual statisticsPublished 16th December 2021
Kind of accident statistics in Great Britain, 20212
Kind of accident statistics in Great Britain, 2021Table of ContentsSummary4Introduction5Fatal injuries6Non-fatal injuries7Annex 1: Sources and definitions10Annex 2: Links to detailed tables11National Statistics123
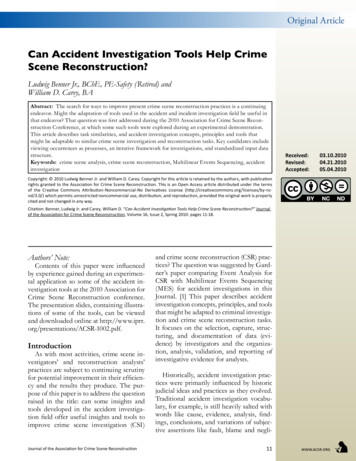
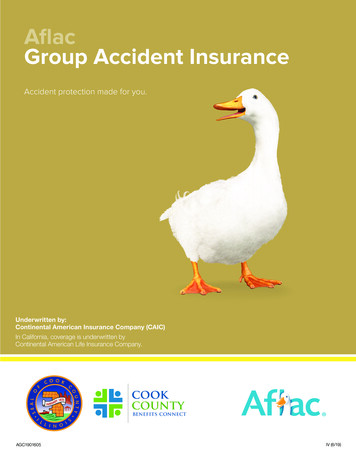
Kind of accident statistics in Great Britain, 2021SummaryThis document can be found at: .pdf.Fatal injuries to workers by most common accident kindsSource: RIDDOR 2016/17-2020/21Non-fatal injuries to employees by most common accident kindsSource: RIDDOR 2020/21Note: RIDDOR: Reporting of Injuries, Diseases and Dangerous Occurrences Regulations. Injurynumbers for 2020/21 are at this stage provisional and will be finalised during 2022.A five-year period has been used for the breakdown of fatal injuries by accident kind. This isbecause the number of fatalities for some accident kinds is relatively small, hence susceptible toconsiderable variation. The five-year picture gives a more stable picture of fatal injuries by accidentkind. The charts above show those accident kinds that contribute to 5% or more of the total.4
Kind of accident statistics in Great Britain, 2021IntroductionIn 2020/21, 142 workers1 were killed at work. In addition, an estimated 441,000workers sustained non-fatal injuries according to self-reports. Certain workplacenon-fatal injuries (generally the more serious) require reporting by employers to theEnforcing Authorities under the Reporting of Injuries, Diseases and DangerousOccurrences Regulations (those that result in more than seven days absence fromwork or specified on a pre-defined list of injuries)2. There were 51,211 such reportedincidents to employees in 2020/21 (although it is known that RIDDOR defined nonfatal injuries to employees are substantially under reported by employers, withestimates showing the reporting level at around a half). Despite long-termreductions in the number of workers injured each year, the kind of accident profileremains similar year on year.12The term 'worker' includes employees and the self-employed combined.For more details on what is reportable, see www.hse.gov.uk/pubns/indg453.pdf.5
Kind of accident statistics in Great Britain, 2021Fatal injuriesFigure 1: Fatal injuries to workers by accident kinds, 2016/17-2020/213,4Source: RIDDORForty-five percent of the fatal injuries to workers over the last five years wereaccounted for by just two different accident kinds - falls from a height and struck bymoving vehicle. Falls from a height accounted for 25% of all fatal injuries (an average of 34 fatalinjuries per year.– 53% of all fatal injuries due to falls from a height were in the constructionsector (annual average 18 per year) Struck by moving vehicle accounted for 20% of all fatal injuries (an average of27 fatal injuries per year.– 32% of all struck by moving vehicle fatal injuries over the last five yearswere in the agriculture, forestry and fishing sector (annual average 9 peryear). A further 19% of deaths were in the transportation and storagesector (annual average of 5 per year)3A five-year period has been used for the breakdown of fatal injuries by accident kind. This isbecause the number of fatalities for some accident kinds is relatively small, hence susceptible toconsiderable variation. The five-year picture gives a more stable picture of fatal injuries byaccident kind. (There were a total of 680 fatal injuries over this period, an annual average of 136.)4Fatal injury numbers for 2020/21 are at this stage provisional and will be finalised in summer 2022.6
Kind of accident statistics in Great Britain, 2021Non-fatal injuriesThe profile of non-fatal injuries by accident kind differs quite markedly to the profileof fatal injuriesFigure 2: Non-fatal injuries to employees (as reported by employers) byaccident kind, 2020/215Source: RIDDOR Fifty-one percent of all employer reported non-fatal injuries to employees wereaccounted for by just two different accident kinds: slips, trips or falls on samelevel (33%) and injured while handling, lifting or carrying (18%). By contrast,these two accident kinds accounted for 3% of fatal injuries to workers over theperiod 2016/17-2020/21. Falls from a height, the most common cause of fatal injury to workers in recentyears, accounted for 8% of employee reported non-fatal injuries in 2020/21. While there is some variation in employer reported accident kinds to employeesby industry sector, slips, trips or falls on the same level was the most commonreported non-fatal accident kind across all broad industry sectors in 2020/21.5Numbers for 2020/21 are at this stage provisional and will be finalised in autumn 2022.7
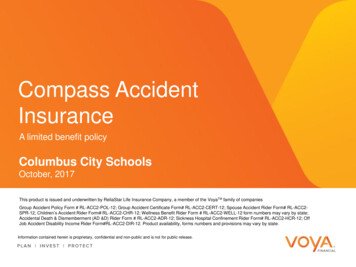
Kind of accident statistics in Great Britain, 2021RIDDOR defines two categories of reportable non-fatal injuries: specified6 (apredefined list of injuries); and injuries resulting in over-7-days absence from work.Fracture (other than to fingers, thumbs, or toes) is the biggest specified injurycategory accounting for 91% of all reported specified injuries in 2020/21.Given the dominance of fractures to the specified injury category, not surprisinglythere is some variation in accident kind between specified injuries and over-7-dayinjuries, as shown in figure 3 below.Figure 3: Percentage of (i) Specified injuries and (ii) Over-7-day injuries toemployees accounted for by different accident kinds, 2020/21Source: RIDDOR6See www.hse.gov.uk/pubns/indg453.pdf.8
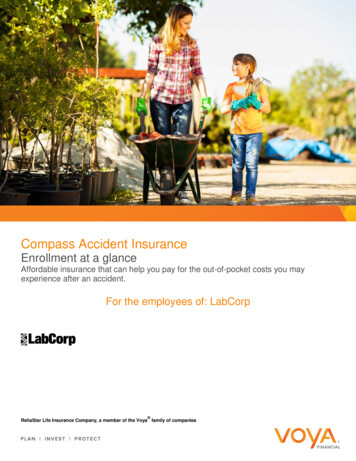
Kind of accident statistics in Great Britain, 2021Information on the distribution of non-fatal injuries by accident kind is also availablefrom the Labour Force Survey (LFS), based on self-reports from workers. Figure 4below shows the accident kind distribution for over-7-day absence injuries toworkers from the LFS as compared with the accident kind distribution for RIDDORreported non-fatal injuries to employees (which includes specified injuries as well asover-7-day injuries to employees). Despite slightly different coverage (the LFSestimate is for workers including the self-employed RIDDOR data covers employeesonly; RIDDOR data includes reported specified injuries, some of which may nothave resulted in more than 7-days absence from work), both sources present asimilar picture in terms of the relative importance of different non-fatal accidentkinds.Figure 4: Percentage of non-fatal injuries accounted for by different accidentkinds based on (i) Self-reported over-7-day absence injuries to workers fromthe LFS and (ii) RIDDOR non-fatal injuries to employeesSource: RIDDOR 2020/21, Labour Force Survey, annual average 2018/19-2020/219
Kind of accident statistics in Great Britain, 2021Annex 1: Sources and definitionsThe Labour Force Survey (LFS): The LFS is a national survey run by the Office forNational Statistics of currently around 37,000 households each quarter. HSEcommissions annual questions in the LFS to gain a view of work-related illness andworkplace injury based on individuals’ perceptions. The analysis and interpretationof these data are the sole responsibility of HSE. For more details, seewww.hse.gov.uk/statistics/sources.htm. Self-reported injuries: Workplace injuries sustained as a result of a non-roadtraffic accident, as estimated by the LFS. Over 7-day absence injuries includeall those with more than 7 consecutive (working and non-working) days awayfrom work (not counting the day on which the accident happened).RIDDOR: The Reporting of Injuries, Diseases and Dangerous OccurrencesRegulations (as amended), under which fatal and defined non-fatal injuries toworkers and members of the public are reported by employers. RIDDOR requiresemployers to report certain workplace non-fatal injuries, generally the more serious(those that result in more than 7 days absence from work or specified on a predefined list of injuries). It is known that employers substantially under-report thesenon-fatal injuries: the level of overall employer reporting of RIDDOR defined nonfatal injuries to employees is estimated at around a half.Certain types of work-related injury are not reportable under RIDDOR, henceexcluded from these figures. Particular exclusions include fatalities and injuries tothe armed forces and injuries from work-related road collisions.For more information see www.hse.gov.uk/statistics/sources.htm.10
Kind of accident statistics in Great Britain, 2021Annex 2: Links to detailed tablesThe data in this report can be found in the following tables:For employer-reported non-fatal injuries by kind of accident and broadindustry group (RIDDOR)See RIDKIND www.hse.gov.uk/statistics/tables/ridkind.xlsx.This table allows you to flexibly view the data. For example, you can view theaccident kinds for a specific industry (such as construction) or you can look at aparticular accident kind (such as falls from a height) and see the percentagecontribution that accident kind makes to the total injury count for each industry.For employer-reported non-fatal injuries by nature of injury (RIDDOR):See RIDNAT www.hse.gov.uk/statistics/tables/ridnat.xlsx.For self-reported non-fatal injuries by accident kind:See lfsinjknd www.hse.gov.uk/statistics/lfs/lfsinjknd.xlsx.Other tables can be found at: www.hse.gov.uk/statistics/tables/index.htm.11
Kind of accident statistics in Great Britain, 2021National StatisticsNational Statistics status means that statistics meet the highest standards oftrustworthiness, quality and public value. They are produced in compliance with theCode of Practice for Statistics, and awarded National Statistics status followingassessment and compliance checks by the Office for Statistics Regulation (OSR).The last compliance check of these statistics was in 2013.It is Health and Safety Executive’s responsibility to maintain compliance with thestandards expected by National Statistics. If we become concerned about whetherthese statistics are still meeting the appropriate standards, we will discuss anyconcerns with the OSR promptly. National Statistics status can be removed at anypoint when the highest standards are not maintained, and reinstated whenstandards are restored. Details of OSR reviews undertaken on these statistics,quality improvements, and other information noting revisions, interpretation, userconsultation and use of these statistics is available fromwww.hse.gov.uk/statistics/about.htm.An account of how the figures are used for statistical purposes can be found atwww.hse.gov.uk/statistics/sources.htm.For information regarding the quality guidelines used for statistics within HSE nes.htm.A revisions policy and log can be seen at al data tables can be found at www.hse.gov.uk/statistics/tables/.General enquiries: heidi.edwards@hse.gov.ukJournalists/media enquiries only: www.hse.gov.uk/contact/contact.htm.12
Further informationFor information about health and safety, or to report inconsistencies or inaccuracies in thisguidance, visit the HSE website.You can order HSE priced publications at the HSE books website.HSE priced publications are also available from bookshops.This publication is available on the HSE website. Crown copyright If you wish to reuse this information visitthe HSE website for details. First published [12/21].Published by the Health and Safety Executive [12/21].
Code of Practice for Statistics, and awarded National Statistics status following assessment and compliance checks by the Office for Statistics Regulation (OSR). The last compliance check of these statistics was in 2013. It is Health and Safety Executive's responsibility to maintain compliance with the standards expected by National Statistics.