Transcription
EDUCATIONAL A N D PSYCHOLOGICAL MEASUREMENT1980.40RELIABILITY AND VALIDITY OF A STATISTICSATTITUDE SURVEYDENNIS M . ROBERTS' 'The Pennsylvania Slate UniversityE D W A R D W. B I L D E R B A C KThe Moberly Junior CollegeA 34 item scale entitled Sutistics Attitude Survey (SAS) was developed and administered to three samples of students taking a beginning statistics course. Analyses showed that the scale was highlyhomogeneous and that total scale scores had moderate correlationswith statistics grades.A I K E N (1970, 1976) has presented comprehensive reviews of studieson attitudes toward mathematics and on the relationships of attitudinal variables to mathematics and related concerns. One point Aiken(1976) made was that contributors to some of the more current literature have appeared to be unaware of earlier efforts (Aiken and Dreger, 1961; Dutton, 1951) to produce affective instruments that are capable of augmenting the usual cognitive measures designed to predictmathematics achievement.One outcome from using these scales that was concerned with attitudes toward mathematics to predict general mathematics performance has been the use of such scales in more specialized settings. Forexample, Feinberg and Halperin (1978) reported on some affectiveand cognitive correlates of achievement in a beginning college levelstatistics course. Affective measures included both a state-trait anxietymeasure and a modified Dutton-type scale to measure attitudes toward quantitative concepts. Findings indicated that the measure of attitudes toward quantitative concepts was the most valid affective predictor of statistics performance (r .35), even though a cognitiveCopyright 1980 by Educational and Psychological Measurement235
236EDUCATIONAL A N D PSYCHOLOGICAL MEASUREMENTmeasure predicted the outcome (/ .40) with slightly higher accuracythan that afforded by the affective measure. Thus, it was found that ageneral measure of attitudes toward mathematics did, in fact, offerreasonable predictability in a more specialized quantitative situation.The purpose of the present paper was to report on the developmentand validation of an affective measure that was designed to be morerelevant than other affective measures in the prediction of performance in statistics, currently a widely studied academic area. Given thefact that most students who take statistics (especially introductorylevel courses) are quite anxious when doing so, an improvement inprediction was thought to be possible with an affective scale that wascouched in statistical jargon. The data to be presented represent aninitial effort to provide reliability and vaUdity information for such anaffective scale.Scale Development-An initial pool of approximately 50 Likert-type items was constructed following the general content domain as was presented in theDutton scale (1951). (Note: Some of the items are similar to thosefrom an unpublished scale by W. R. Rabinowitz of The PennsylvaniaState University.) After a small initial tryout, some items were revisedand some were deleted because of the presence of low point-biserialcorrelation coefficients in relation to total scores. The final version ofthe Statistics Attitude Survey (SAS) contains 34 highly homogeneousitems. (A copy of the SAS is available from the first author.) Severalsample items are as follows: (8) I make a lot of errors when I calculatestatistics problems, (18) The thought of taking another statisticscourse makes me feel sick, and (20) I find statistics to be very logicaland clear. A 5-choice Likert scale was adopted for the responses toeach item—ranging from strongly agree to strongly disagree. A mixture of positively and negatively worded items was included.Data SamplesAll data were collected by one or both of the authors in 3 separateterms (Spring 1978, Winter 1978-79, Spring 1979) of an introductorygraduate level statistics course at The Peimsylvania State University.Coming from a broad spectrum of programs, students represent bothundergraduates and graduates with widely varying abiUties and interests. For many students, this course represents the only exposure tostatistics that they would receive.
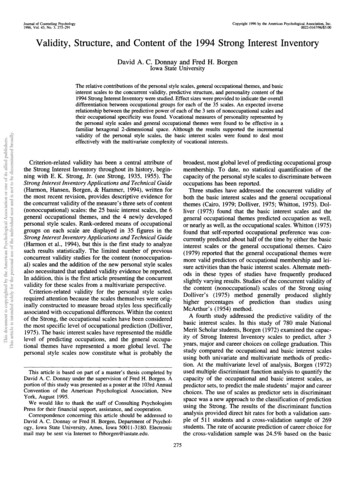
ROBERTS A N DBILDERBACK237ResultsThe range of possible SAS scores was 170 to 34 with a mid-rangescore of 102 considered to be an overall neutral position. Data wereanalyzed with the LIKRT program developed by Kohr (1973). Thisprogram does internal consistency analyses for scales of the Likerttype. Table 1 presents the several descriptive measures on the threedata samples. A l l three samples provided similar data with the exception of the correlations. Proportions of variance accounted for bythe SAS in predicting course grades ranged from about 10% (Spring1978) to 30% (Spring 1979). The consistently high estimates of reUability indicated that items measure the same construct. Only Item33—"statistics teachers are probably no better or worse than otherteachers,"—had point biserial correlations with total SAS scores consistently near zero. Other items had point biserials in the range from.50 to .70. Across the samples, the Spearman-Brown prophecy formula indicated that a scale of approximately 19 items would haveachieved a reliabihty of .90. Relevant to the correlational data, it is interesting to note that—contrary to general expectations—the smallerthe SAS standard deviation, the higher the vahdity coefficient. Thatsame pattern of ordered values for the standard deviation also held forthe total number of course points—the criterion measure.As a final note, the mean scores indicated a somewhat positive attitude towards statistics. This outcome also might be contrary to generalopinion. It would be interesting to compare pretest versus posttestscores on the SAS over the duration of such a statistics course to seewhether any general change occurs. In summary, results indicate thatthe SAS is a highly homogeneous scale that does predict statisticscourse performance quite well.TABLE IDescriptive Data on SA S from ThreeSpring 1978N nSamplesSampleWinter 1978-79Spring 1979N »\,V 3".93.« .S4»«* Reliability eslimaicd by coefficient alphaCorrelation between SAS scores and uual poinu earned in the statistics course. Point totals include several mul*tiple-choice tests and a take home problem test.' * Statistically Mgniticant at .01 level.
238EDUCATIONAL A N D PSYCHOLOGICALBrief DiscussionMEASUREMENT-sOne common problem that instructors in the area of statistics face isthat many, if not most, of the students are frightened of taking suchcourses. It is not unusual for students to delay taking statistics in theirprograms as long as possible; many wait until their last term when itthen becomes a "do or die" situation. In some ways, it is unbelievablehow fearful students become when faced with the reality of finallyhaving to take "stat." The affective component presents a real barrierto a potentially successful experience with such content material.Hopefully, the SAS can assist in detecting those individuals possessingchronic pre-course fears. With such information, instructors can helpease students over the initial shock by positive steps such as makingsure that students can use calculators efficiently or immediately providing them with a tutor.REFERENCESAiken, L. R. Attitudes toward mathematics. Review of Educational Research. 1970, 40, 551-596.Aiken, L. R. Update on attitudes and other affective variables inlearning mathematics. Review of Educational Research. 1976, 46,293-311.Aiken, L. R. and Dreger, R. .M. The effect of attitudes on performancein mathematics. Journal of Educational Psychology. 1961, 52, 1924.Dutton, W. H. Attitudes of prospective teachers toward mathematics.Elementary School Journal, 1951, 52, 84-90.Feinberg, L. B. and Halperin S. Affective and cognitive correlates ofcourse performance in introductory statistics. Journal of Experimental Education, 1978,46, 11-18.Kohr, R. L. Program LIKRT-version 4. State University: The Pennsylvania State University Computation Center, 1973.
STATISTICS ATTITUDE SURVEY Directions;Each o f the statements below i s f o l l o w e d by a r a t i n gs c a l e which ranges from S t r o n g l y Agree t o S t r o n g l yD i s a g r e e . Rate each s t a t e m e n t i n terms o f how youfeel.Make a check mark under the a p p r o p r i a t e r a t i n g .StronglyAgree1.S t a t i s t i c s w i l l be u s e f u l t ome i n my p r o f e s s i o n when Ievaluate o t h e r p e o p l e .2.I t takes me a l o n g t i m e t ounderstand a s t a t i s t i c a lconcept.3.I get a g r e a t d e a l o f s a t i s f a c t i o n out of s o l v i n g as t a t i s t i c s problem.4.S t a t i s t i c s w i l l be u s e f u l t ome to t e s t the s u p e r i o r i t y o fone method over a n o t h e r .5.I n o r m a l l y am able t o s o l v es t a t i s t i c s problems w i t h o u ttoo much d i f f i c u l t y .6.I might use s t a t i s t i c s a t my j o bbut w o u l d n ' t l i k e d o i n g i t .7.S t a t i s t i c s w i l l be u s e f u l t ome i n e v a l u a t i n g the e f f e c t i v e ness o f my p r o f e s s i o n a l p e r formance.8.I make a l o t o f e r r o r s when Ic a l c u l a t e s t a t i s t i c s problems.9.Even before I b e g i n a newstatistics topic, I feel r e l a t i v e l y c o n f i d e n t t h a t I canmaster i t .10.S t a t i s t i c s w i l l be u s e f u l t o mewhen I d e s c r i b e my p r o f e s s i o n a la c t i v i t i e s to other people.AgreeNeutralDisagree* : StronglyDisagree
2StronglyAgree11.I am able t o f i g u r e o u t mostof the equations I need t osolve a s t a t i s t i c s p r o b l e m .12.I would l i k e to study advancedstatistics.13.S t a t i s t i c s w i l l be a u s e f u lt o o l t h a t I can use t o improvethe r e l i a b i l i t y and v a l i d i t yof measures t h a t I have developed.14.There are so many s t a t i s t i c a lconcepts t o l e a r n t h a t I g e tconfused.15.The average p r o f e s s i o n a l wouldfind s t a t i s t i c s a boringsubject.16.S t a t i s t i c s w i l l be a u s e f u l wayto help me improve the q u a l i t yof my p r o f e s s i o n a l performance.17.I must c o n s t a n t l y r e v i e ws t a t i s t i c s or I forget i t .18.The thought o f t a k i n g a n o t h e rs t a t i s t i c s course makes mefeel s i c k : I19.S t a t i s t i c s i s so u s e f u l t h a ti t should be a r e q u i r e d p a r tof my p r o f e s s i o n ' s s k i l l s .20.I f i n d s t a t i s t i c s t o be v e r yl o g i c a l and c l e a r .21.Given t h e o p p o r t u n i t y , I wouldtake another s t a t i s t i c s courseeven though i t w a s n ' t r e q u i r e d .22.When I s o l v e a s t a t i s t i c sproblem, I am o f t e n n o t s u r ehow t o i n t e r p r e t the r e s u l t s .AgreeNeutral'DisagreeStronglyDisagree
3StronglyAgree23.S t a t i s t i c s w o n ' t be u s e f u l t ome i n my p r o f e s s i o n because i ttakes too much time t o use.24.When I s o l v e a s t a t i s t i c sproblem, I am o f t e n unsure i fI have a c o r r e c t o r n e a r l yc o r r e c t answer.25.I t i s unreasonable t o expectthe average p r o f e s s i o n a l t omaster and a p p l y s t a t i s t i c s .26.You should be good a t mathbefore a t t e m p t i n g s t a t i s t i c s .27.S t a t i s t i c s may be u s e f u l t osomeone who p l a n s t o pursuea career i n r e s e a r c h , b u tnot very u s e f u l t o t h eaverage p r o f e s s i o n a l .28.S t a t i s t i c s i s the most d i f f i c u l t course I have t a k e n .29.The pace o f a s t a t i s t i c scourse i s so f a s t t h a t i t i si m p o s s i b l e f o r the averagestudent to l e a r n the subj e c t matter thoroughly.30.Homework i n s t a t i s t i c s i sharder than homework i nnon-math s u b j e c t s .31.S t a t i s t i c s i s too t h e o r e t i c a lto be o f much p r a c t i c a l useto the average p r o f e s s i o n a l .32.I f i n d i t easy t o e x p l a i n as t a t i s t i c s t o p i c t o someoneelse.33.An average s t u d e n t can expecta good grade i n s t a t i s t i c si f he/she s t u d i e s .AgreeNeutralDisagreeStronglyDisagree''
EDUCATIONAL A N D PSYCHOLOGICAL MEASUREMENT1982. 42!VALIDITY OF A STATISTICS ATTITUDE SURVEY: AFOLLOW-UP STUDYD E N N I S M . R O B E R T S A N D J O S E P H E. S A X EThe Pennsylvania State UniversityThe validity of the Statistics Attitude Survey (SAS) was furtherexamined in the present study. Students were assessed on anumber of pretest and posttest cognitive and non-cognitive variables, including the SAS. SAS scores were found to be significantlyrelated to such cognitive variables as basic mathematics skills,statistics preknowledge, and course grades. Non-cognitive factorswith which SAS was significantly correlated were sex, the degreeto which students indicated that they had wanted to take thecourse and that they were glad they had taken the course, numberof previous mathematics courses completed, the status of a coursebeing required or elective, calculator attitudes, and course andinstructor evaluations. In addition, SAS scores showed a significant positive change from the beginning to the end of the course.R E C E N T L Y , Roberts and Bilderback (1980) presented data on thedevelopment of a Likert-type Statistics Attitude Survey (SAS).' TheSAS was developed to assess various components of statisticalattitudes such as perceptions held by students of how competentthey are with statistics and of how useful statistical analysis itself is.Analyses of several different data sets indicated that the SAS is ahighly homogeneous scale and that total SAS scores are correlatedmoderately and positively with grades earned in a basic statisticscourse. The purpose of the present study was to examine specifically the validity of the SAS in terms of the correlations between SASscores and numerous other variables. The data to be described are' Reprints o f the present article, the previous article on the development o f theSAS, and the SAS scale itself are available from the first-listed author at 308 CedarBuilding, University Park, PA 16802.Copyright O 1982 Educational and Psychological Measurementm.;« U
908EDUCATIONAL A N D PSYCHOLOGICAL MEASUREMENTpart of a larger investigation concerned more generally with theidentification of useful measures for prediction of performance in abasic statistics course.MethodsSubjectsc Subjects were 132 students from an introductory statistics courseat The Pennsylvania State University. In the initial pool of 132subjects, 98 were females and 34 were males. In some analyses,however, sample size was smaller because of attrition. The course ismade up of both advanced undergraduates and graduates—in thepresent case, 36 and 96, respectively. Of the graduates, 69 werefirst-year students. A l l students received bonus course credit forparticipation.* VariablesAs most variables are self-explanatory, they are only described,as needed, in the Results section. However, some variates representscores on instruments that are described here.1. Basic Mathematics Test: A multiple-choice measure consistingof 36 items (two of which were not scored for present purposes), theBasic Mathematics Test, is routinely used as the basic skillsmathematics examination at The Pennsylvania State University.Skills sampled include those involving whole numbers, fractions,decimals, ratio/proportions, and tables and graphs.2. Basic Statistics Test: A multiple-choice measure containing 20items, the Basic Statistics Test, was constructed by the authors.Items cover basic descriptive statistics from frequency distributionsto correlation. Approximately one-half of the items requires simplecalculations.3. Statistics Attitude Scale: The Statistics Attitude Scale is aLikert-type instrument consisting of 33 items. Items tap such areasas usefulness of statistics and anxieties of students who must takestatistics. More information on the development of this homogeneous scale can be found in Roberts and Bilderback (1980).4. Calculator Attitude Scale: Also of the Likert-type, the 20 itemCalculator Attitude Scale is reported on in more detail by Geisingerand Roberts (1978). This reasonably homogeneous measure ofattitudes about calculators assesses such components as the educational value of calculators and the trustworthiness of calculatorsthemselves.
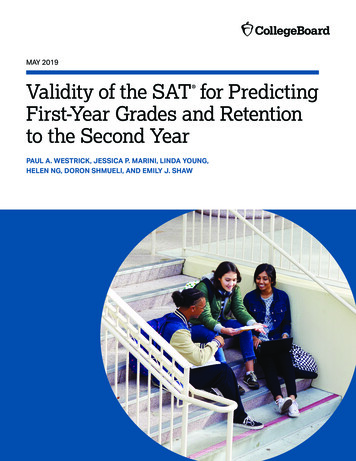
ROBERTS A N D S A X EGeneral ProceduresBasic information about the students (e.g., sex and age) plusattitude survey responses were gathered during the first week of aten-week term. Data on the statistics and mathematics tests werecollected at an evening session several days later. At the end of theterm, posttest data were obtained on the attitude surveys, statisticsmeasure, course and instructor evaluations, and course grades. Alldata gathering was done by the authors.ResultsReliabilitiesTable 1 presents coefficient alpha reliability estimates on the testscore variables as mentioned in the section on Variables. With theexception of the Basic Statistics Test, which was not piloted, allinternal-consistency reliability estimates were judged as quite satisfactory.CorrelationsTable 2 presents the correlations between pretest SAS scores andthe other variables used in the study and between posttest scoresand the same other variables. Males did tend to have higher SASscores than did females. In a cluster of similar variables, higher SASscores were associated with having had more previous mathematicscourses, higher basic mathematics skills, more previous statisticalknowledge, and higher grades in the present statistics course. Forthese measures, correlations betwen SAS and each variable tendedto average about .08 higher for posttest SAS scores than for pretestSAS scores. This outcome might have been simply due to the largerposttest SAS standard deviation (SD) in the bivariate sample(pretest SD 14.86, posttest SD 16.36). Students who elected toReliabilityand StandardTABLE 1Errors of Measurementfor ScaleScorePretestDataPosttestMeasureAlphaSE Meas.AlphaSE Meas.Basic Mathematics Test*Basic Statistics TestStatistical AttitudesCalculator 4.683.53' Basic Mathematics Test was given only during pretesting.
9MEDUCATIONAL A N D PSYCHOLOGICAL MEASUREMENTCorrelationsTABLE 2of SAS Scores with Other StudentVariablesSAS T i m eVariableSexAgeN u m b e r o f Math CoursesRequired/ElectiveStudent StatusB i r t h OrderWanted CourseBasic M a t hBasic Stat PreBasic Stat PostCalculator Attitude PreCalculator Attitude PostCourse EvaluationInstructor EvaluationGradeGlad T o o k coursePre",26**.15.30**-.25**A4 .02.66»*.27".27**.32**»" - j« vAtf.1326".43'*Post". T- ,. - ' .04.25'».21*.41".32*** For bivariate comparisons. ATs ranged from 127 to 95. For bivariate comparisons. ATs ranged from 101 to S3. Correlation different from 0 at p .05 level.Correlation different from 0 at p .05 level.take the statistics course had higher SAS scores than did thosestudents taking it as a requirement. In this context, it was nosurprise then that students saying they were more positive aboutwanting to take the course—and subsequently glad they took thecourse—also had higher SAS scores. In a similar vein, students whorated both the course and instructor more positively also exhibitedhigher SAS scores. It should be noted that the course and instructorevaluation measures were only single items requiring the student togive a verbal rating (on a 7-point scale) of the course and instructor.Students who exhibited more positive attitudes about calculators(pretest only) tended to have higher SAS scores. However, thisrelationship appeared to be low at best. Age of the student andstatus (term standing) were unrelated to SAS scores just as was birthorder. In summary, SAS scores were clearly related to a variety ofcognitive and non-cognitive measures.Gain ScoresAs one final analysis, pretest and posttest SAS scores werecompared to determine whether that was a significant change.Pretest mean SAS score was 105.28 [SD 14.86) compared to a
ROBERTS A N D S A X E911posttest mean of 109.94 (SD 16.36). The resulting diflference wasstatistically significant {t 3.448, df 95, p .01).Brief DiscussionThe present data again provided some support for the notion thattoo much anxiety can interfere with cognitive functioning. Certainlyin the area of statistics (and mathematics in general), many studentsarrive at their first or second exposure to course work with fears andanxieties about mathematics greatly exaggerated in relation to thetrue difficulty of the subject matter. Students seem to feel that if theymake mistakes statistics is going to "bite" them. Obviously, manyof these anxieties are the result of erroneous perceptions about howsophisticated mathematics proficiencies have to be in order toachieve reasonable competence in elementary statistical procedures.One of the ways to approach the "anxiety attacks" situation is todeal directly with negative attitudes about statistics. The presentdata indicate that more positive attitudes are associated with higherlevels of performance. Thus, it may be helpful at the beginning ofstatistics courses to run routine SAS checks on students. It may bethat precourse identification of students who have low SAS scoreswill allow an instructor to discuss with them the realities of the skillsneeded to perform satisfactorily. In addition, the instructor may beable to outline strategies that will enable the student to organize his/her study time to utilize it with increasing effectiveness.Of special interest was the fact that SAS scores changed significantly in a positive direction from the beginning to the end of thecourse. Although one may not infer that the experience in the course"caused" the change, it is not unreasonable to include such anexplanation. Students who enter the statistics course and who aregenerally "mathematics anxious" (as they are) and who later findthat a statistics course is not so terrifying as they envisioned maydevelop more positive attitudes about statistics. However, an alternative explanation may be that initial student anxiety has produceddepressed SAS scores at the beginning of the course. When studentsfind out later that the course was not so distressing as they hadfeared, their "true" SAS scores may exert an impact. In either casethough, reducing the unnecessary negative perceptions about eitherthe students' abilities to handle statistics or the usefulness oflearning statistical procedures would probably allow the student tobe more productive in his/her statistical training.
912EDUCATIONAL A N D PSYCHOLOGICAL MEASUREMENTREFERENCESGeisinger, K. F. and Roberts, D. M . Individual diflFerences incalculator attitudes and performance in a statistics course. Paperpresented at .American Educational Research Association, Toronto, 1978.Roberts, D. M . and Bilderback, E. Reliability and validity of astatistics attitude survey. E D U C A T I O N A L A N D PSYCHOLOGICALMEASUREMENT, 1980, 40, 235-238.
statistics problem. 4. Statistics will be useful to me to test the superiority of one method over another. 5. I normally am able to solve statistics problems without too much difficulty. 6. I might use statistics at my job but wouldn't like doing it. 7. Statistics will be useful to me in evaluating the ef