Transcription
Chair for Network Architectures and Services—Prof. CarleDepartment of Computer ScienceTU MünchenWhat can go wrong with statistics:Some typical errors &How to lie with statisticsMany slides borrowed from:Lutz PrecheltDaniel HuffJon Hasenbank
Motivation“There are three kinds of lies:Lies, Damned Lies, and Statistics.”– attributed to Benjamin Disraeli Statistics are commonly used to make a point or back-up one‟sposition 82.5% of all statistics are made up on the spot. Three sources of errors: If done in manipulative way, statistics can be deceiving If not done carefully, statistics can be deceiving Inadvertent methodological errors also will fool the person whois doing the statistics! If not read carefully, statistics can be deceivingNetwork– Security,IN2045Discrete EventWS 2008/09,Simulation,ChapterWS92010/20112
Purpose of this section Avoid common inadvertent errors “Lessons for author” Be aware of the subtle tricks that othersmay play on you (and that you should never play on others!) “Lessons for reader”Network– Security,IN2045Discrete EventWS 2008/09,Simulation,ChapterWS92010/20113
Source Large parts of this slide set is based on ideas fromDarrell Huff: "How to Lie With Statistics",(Victor Gollancz 1954, Pelican Books 1973, Penguin Books 1991) but the slides use different examplesMost slides made by Lutz PrecheltThe book is short (120 p.), entertaining, and insightfulMany different editions availableOther, similar booksexist as wellNetwork– Security,IN2045Discrete EventWS 2008/09,Simulation,ChapterWS92010/20114
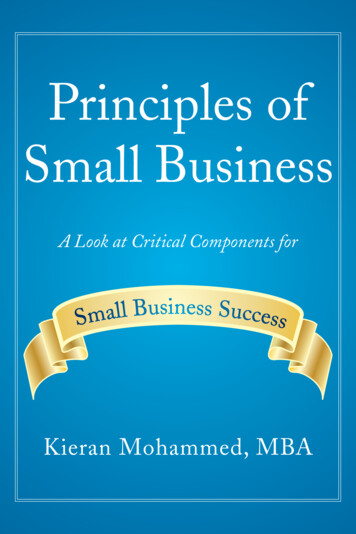
Example: Human Growth Hormone Spam (HGH)Network– Security,IN2045Discrete EventWS 2008/09,Simulation,ChapterWS92010/20115
Remark We use this real spam email as an arbitrary exampleand will make unwarranted assumptions about what is behind it for illustrative purposes I do not claim that HGH treatment is useful, useless, or harmfulNote: HGH is on the IOC doping list http://www.dshs-koeln.de/biochemie/rubriken/01 doping/06.html "Für die therapeutische Anwendung von HGH kommen derzeit nurzwei wesentliche Krankheitsbilder in Frage: Zwergwuchs beiKindern und HGH-Mangel beim Erwachsenen" "Die Wirksamkeit von HGH bei Sportlern muss allerdings bisherstark in Frage gestellt werden, da bisher keine wissenschaftlicheStudie zeigen konnte, dass eine zusätzliche HGH-Applikation beiPersonen, die eine normale HGH-Produktion aufweisen, zuLeistungssteigerungen führen kann."Network– Security,IN2045Discrete EventWS 2008/09,Simulation,ChapterWS92010/20116
Problem 1: What do they mean? "Body fat loss: up to 82%" OK, can be measured "Wrinkle reduction: up to 61%" Maybe they count the wrinkles and measure theirdepth? "Energy level: up to 84%" What is this? Also note they use language loosely: Loss in percent: OK; reduction in percent: OK Level in percent? (should be 'increase')Network– Security,IN2045Discrete EventWS 2008/09,Simulation,ChapterWS92010/20117
Lesson for readers: What did they actually measure? Always question the definition of the measures forwhich somebody gives you statistics Surprisingly often, there is no stringent definition at all Or multiple different definitions are used and incomparable data get mixed Or the definition has dubious value e.g. "Energy level" may be a subjective estimate of patientswho knew they were treated with a "wonder drug"Network– Security,IN2045Discrete EventWS 2008/09,Simulation,ChapterWS92010/20118
Lesson for authors: Be clear about what you measure Before you start: What effect do you want to analyze? What could be good metrics to measure it? Try out different metrics and compare them When writing things up: Define your metrics clearly and understandable. Bad example: “We analyzed the delays in our simulatednetwork”. One-way or RTT? Total delays? But what if wire length is constant? Good example: “We analyzed the one-way delays inour simulated network. Since propagation delays areconstant in a wired network, we analyzed only thequeueing delays and transmission delays.”Network– Security,IN2045Discrete EventWS 2008/09,Simulation,ChapterWS92010/20119
Problem 2: A maximum does not say much Wrinkle reduction: up to 61%So that was the best value. What about the rest?Maybe the distribution was like this:Mo o oooo ooooooo o o oooo oooo ooooooooooo o ooo ooooooooooo oooo oooooooooooo010oo oo20oooo30reductionNetwork– Security,IN2045Discrete EventWS 2008/09,Simulation,ChapterWS92010/201140506010
Lesson for readers: Dare ask for unbiased measures Always ask for neutral, informative measures in particular when talking to a party with vested interest Extremes are rarely useful to show that someting isgenerally large (or small) Averages are better But even averages can be very misleading see the following example later in this presentation If the shape of the distribution is unknown, we needsummary information about variability at the very least e.g. the data from the plot in the previous slide hasarithmetic mean 10 and standard deviation 8 Note: In different situations,rather different kinds of informationmight be required for judging somethingNetwork– Security,IN2045Discrete EventWS 2008/09,Simulation,ChapterWS92010/201111
Lesson for authors: Is it really significant? Are there many outliers?Do not use minimum or maximum values forcomparison of, e.g., “before – after” Compare the means Think about what kind of mean to use: Arithmetic mean? Hyperbolic mean? Geometric mean? Better: compare the medians Or even better: Use statistical tests (e.g., Student‟s ttest) to prove that the change (before – after) isstatistically significantNetwork– Security,IN2045Discrete EventWS 2008/09,Simulation,ChapterWS92010/201112
Problem 3: Underlying population Wrinkle reduction: up to 61%Maybe they measured a very special set of people?MheartAttackooooooooooo o o ooooooooooooooooooooooooooooooooo ooo ooooo o ooooMhealthyoooo ooooooooooooooooooo ooooooo oooooooooo ooooooooooooo ooooo-200Network– Security,IN2045Discrete EventWS 2008/09,Simulation,ChapterWS92010/2011ooooo ooo o20reductiono406013
Lesson: Insist on unbiased samples How and where from the data was collected can havea tremendous impact on the resultsIt is important to understand whether there is a certain(possibly intended) tendency in thisA fair statistic talks about possible bias it containsIf it does not, ask.Notes: A biased sample may be the best one can get Sometimes we can suspect that there is a bias,but cannot be sureNetwork– Security,IN2045Discrete EventWS 2008/09,Simulation,ChapterWS92010/201114
Lesson 4: „Cum hoc ergo propter hoc‟ is wrong! Translation: “With this, therefore because of this”Meaning: Correlation does not mean causationCorrelation may suggest causation (effect A causeseffect B), but there also can be other reasons for acorrelation between A and BNitpicking: „Post hoc ergo propter hoc‟ is almost the same thing: After this, therefore because of this Implies a temporal relation between A and B, whereas „cum hoc ‟ only implies some correlationNetwork– Security,IN2045Discrete EventWS 2008/09,Simulation,ChapterWS92010/201115
Correlation does not mean causation “If A is correlated with B, then A causes B” Perhaps neither of these things has produced the other, but bothare a product of some third factor C It may be the other way round: B causes A Correlation can actually be of any of several types and can belimited to a range The correlation may be pure coincidence,e.g. #pirates vs. global temperature Given a small sample, you are likely to find some substantialcorrelation between any pair of characters or events Ex: “Queueing delays increased, therefore throughput forindividual TCP connections decreased” Could be true Could be due to an increased # of total TCP conections Could be actually unrelatedNetwork– Security,IN2045Discrete EventWS 2008/09,Simulation,ChapterWS92010/201116
Lesson: Question causality Sometimes the data is not just biased,it contains hardly anything else than bias If you see a presumably ( author) or assertedly( reader) causal relationship ("A causes B"), askyourself: Does it really make sense?Would A really have this much influence on B?Couldn„t it be just the other way round?What other influences besides A may be important?What is the relative weight of A compared to these?Network– Security,IN2045Discrete EventWS 2008/09,Simulation,ChapterWS92010/201118
Example 2: Tungu and Bulugu We look at the yearly per-capitaincome in two small hypotheticisland states:Tungu and Bulugu Statement:"The average yearly incomein Tungu is 94.3% higherthan in Bulugu."Network– Security,IN2045Discrete EventWS 2008/09,Simulation,ChapterWS92010/201119
Problem 1: Misleading averages The island states are rather small:81 people in Tungu and 80 in BuluguAnd the income distribution is not as even in Tungu:MTunguooo oooooooooooooooooooooooooo oo oo o oo o o oooooooooo oooooooo ooooooooooooMBuluguoo0o o o o oooooooooo o ooooooooo o oo ooo oooo oo ooo ooo oooooo o o oooo oo o oo o oooo oo o10002000o3000o40005000incomeNetwork– Security,IN2045Discrete EventWS 2008/09,Simulation,ChapterWS92010/201120
Misleading averages and outliers The only reason is Dr. Waldner, owner of asmall software company in Berlin, whosince last year is enjoying his retirement inTunguTunguBuluguMoooooooooooooooooooooooooo oooo o ooooooooooooooooooooooooooooooooooMo ooooooooo o oo ooo oooooooo ooooooooooooooooooooooooooooooooooooo10 3.0o10 3.5Network– Security,IN2045Discrete EventWS 2008/09,Simulation,ChapterWS92010/201110 4.0income10 4.510 5.021
Lesson: Question appropriateness A certain statistic (very often the arithmetic average)may be inappropriate for characterizing a sampleIf there is any doubt, ask that additional information beprovided such as standard deviation or some quantiles, e.g.: 0, 0.25, 0.5, 0.75, 1Note: 0.25 quantileis equivalent o oooo o oooooooooooooooooooooooooooooooooNetwork– Security,IN2045Discrete EventWS 2008/09,Simulation,ChapterWSM92010/2011o22
Logarithmic axes Waldner earns 160.000 per year.How much more that is than the other Tunguanshave, is impossible to see on the logarithmic axis wejust Network– Security,IN2045Discrete EventWS 15000023
Lesson: Beware of inappropriate visualizations (#1) Lesson for reader: Always look at the axes. Are theylinear or logarithmic? Lesson for author: Logarithmic axes are very useful for reading hugelydifferent values from a graph with some precision But they totally defeat the imagination! If you decide to use logarithmic axes, always state thisfact in your text! There are many more kinds of inappropriatevisualizations see later in this presentationNetwork– Security,IN2045Discrete EventWS 2008/09,Simulation,ChapterWS92010/201124
Problem 3: Misleading precision "The average yearly income in Tungu is 94.3% higherthan in Bulugu" Assume that tomorrow Mrs. Alulu Nirudu from Tungugives birth to her twins There are now 83 rather than 81 people on TunguThe average income drops from 3922 to 3827The difference to Bulugu drops from 94.3% to 89.7% Network– Security,IN2045Discrete EventWS 2008/09,Simulation,ChapterWS92010/201125
Lesson for reader: Do not be easily impressed The usual reason for presenting very precise numbersis the wish to impress people „Round numbers are always false“ But round numbers are much easier to remember andcompare Clearly tell people you will not be impressed byprecision in particular if the precision is purely imaginaryNetwork– Security,IN2045Discrete EventWS 2008/09,Simulation,ChapterWS92010/201126
Lesson for author: Think about precision Do you really have enough data that would makesense to give out precise numbers? Compromise: Give exact number in tables/figures, butround them in text.Do not exaggerate: If you find your systems yields a53,9% increase in throughput Don‟t say: “Our system increases throughput by morethan 50%” Do say: “Our experiments suggest that our system canachieve throughput increases of around 50%”Network– Security,IN2045Discrete EventWS 2008/09,Simulation,ChapterWS92010/201127
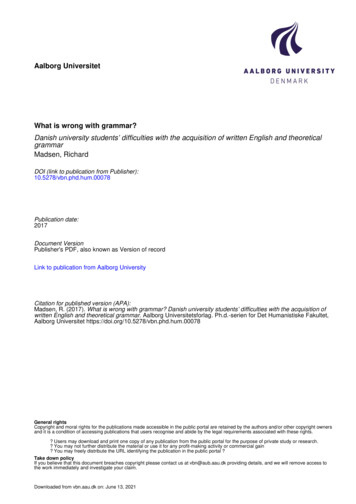
190188186184182180 We look at therecentdevelopment of theprice of shares forPhantasmoCorporation"Phantasmo showsa remarkablystrong andconsistent valuegrowth andcontinues to be atoprecommendation"stock price 192Example 3: Phantasmo Corporation stock price0100200300400dayNetwork– Security,IN2045Discrete EventWS 2008/09,Simulation,ChapterWS92010/201129
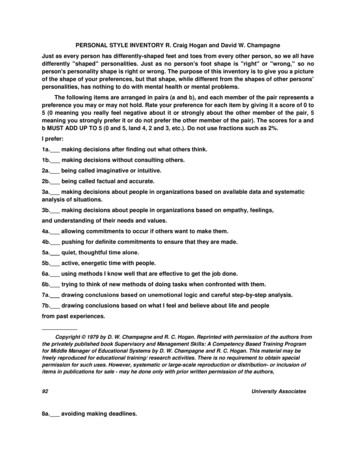
Problem: Looks can be misleading192 The following two plots showexactly the same data!1861840180 182 184 186 18 190 192stock price180182stock price188190 and the same as theplot on the previous slide!100200300400day0100200300400dayNetwork– Security,IN2045Discrete EventWS 2008/09,Simulation,ChapterWS92010/201130
Problem: Scales can be misleadingWhat really happened isshown here:200 10001861840182stock price18850190192stock price150We intuitively interpret atrend plot on a k– Security,IN2045Discrete EventWS 2008/09,Simulation,ChapterWS92010/201131
Problem: Scales can be missingThe most insolentpersuaders mayeven leave the scaleout altogether! Never forget to puta scale on youraxes!186184182180 Never forget tolabel your axes!stock price188190192 0100200300400dayNetwork– Security,IN2045Discrete EventWS 2008/09,Simulation,ChapterWS92010/201133
Problem: Scales can be abused Observethe globalimpressionfirst2005Network– Security,IN2045Discrete EventWS 2008/09,Simulation,ChapterWS92010/201134
Problem: People may invent unexpected things Quelle: Werbeanzeige derDonau-Universität Krems DIE ZEIT, 07.10.2004 What„s wrong?2 Jahre 4 JahreNetwork– Security,IN2045Discrete EventWS 2008/09,Simulation,ChapterWS92010/201135
Pie charts (1/3)Network– Security,IN2045Discrete EventWS 2008/09,Simulation,ChapterWS92010/201136
Pie charts (2/3)Network– Security,IN2045Discrete EventWS 2008/09,Simulation,ChapterWS92010/201137
Pie charts (3/3) What percentages do the two graphs show?Guess! Answer: Both show the same data: A 94% : 6% ratio! The difference only lies in the angle of the pies.Network– Security,IN2045Discrete EventWS 2008/09,Simulation,ChapterWS92010/201138
Lesson: Distrust pie charts! Pie charts should not be used Perception dependent on the angle Even worse with 3D pie charts:Parts at the front are artificially increased due to thepie‟s 3D height; they thus seem to be bigger A very subtle way to visually tune your data Unfortunately, still very common Distrust pie charts that do not give numbers as well Think about the numbers, compare them Think about the presentation: are they trying to beautifythe impression?Network– Security,IN2045Discrete EventWS 2008/09,Simulation,ChapterWS92010/201139
Bubble charts Whichdiagram shows the values 2, 3, 4? Both do! Left one: Radius is proportional to measurements Exaggerates differences: 4 looks much larger than 2 Rightone: Area is proportional to measurements Underestimates differences: 4 looks only slightly larger than 2Network– Security,IN2045Discrete EventWS 2008/09,Simulation,ChapterWS92010/201140
Lesson: Bubble charts This lession is more or less similar to pie charts : Bubble charts usually should not be used Radius proportionality exaggerates differences,area proportionality lets underestimate differences A very subtle way to visually tune your data Of course, a bubble chart pie chart may convey moreinformation, but please try to visualize it differently If you really, really want to use a bubble chart, then use thearea proportionality variant, and clearly explain this in your text Distrust bubble charts that do not give the numbers as well Think about the numbers, compare them Think about the presentation: Did they really need to use bubblecharts? Or are they trying to beautify the impression?Network– Security,IN2045Discrete EventWS 2008/09,Simulation,ChapterWS92010/201141
Summary lesson for the reader: Seeing is believing but often, it shouldn't be! Always consider what it really is that you are seeingDo not believe anything purely intuitivelyDo not believe anything that does not have a welldefined meaning Network– Security,IN2045Discrete EventWS 2008/09,Simulation,ChapterWS92010/201142
Example 4: blend-a-med Night Effects What do they not say? Think about it What exactly does "sichtbar" mean?What exactly does „hell“ or „heller“ mean?What was the scope, what were the results of theclinical trials?What other effects does Night Effects have? Network– Security,IN2045Discrete EventWS 2008/09,Simulation,ChapterWS92010/201143
Example 5: The better tool? We consider the time it takes programmers to write acertain program using different IDEs: Aguilder or Egglips Statement (by the maker of Aguilder):"In an experiment with 12 persons, the ones usingEgglips required on average 24.6% more time tofinish the same task than those using Aguilder.Both groups consisted of equally capable people andreceived the same amount and quality of training." Assume Egglips and Aguilder are in fact just as good.What may have gone wrong here?Network– Security,IN2045Discrete EventWS 2008/09,Simulation,ChapterWS92010/201144
Problem: Has anybody ignored any data?0 Solution: Justrepeat theexperiment a Egglipsfew times andAguilderpick theoutcome youlike best10020034MooMoooooooooMoooo o ooo12MEgglipsMooo oooo ooo oMAguilderoo0o100oooMoo300oMo o200oo ooo300timeNetwork– Security,IN2045Discrete EventWS 2008/09,Simulation,ChapterWS92010/201145
Lesson for the reader: Demand complete information If somebody presents conclusions based on only a subset of the available data and has selected which subset to use then everything is possible There is no direct way to detect such repetitions,BUT for any one single execution . . .Lutz Prechelt, prechelt@inf.fu-berlin.deNetwork– Security,IN2045Discrete EventWS 2008/09,Simulation,ChapterWS92010/201146
Digression: Hypothesis testing a significance test (or confidence intervals) candetermine how likely it was to obtain this result if theconclusion is wrong: Null hypothesis: Assume both tools produce equalworktimes overall Then how often will we get a difference this large whenwe use samples of size 6 persons? If the probability is small,the result is plausibly real If the probability is large,the result is plausibly incidentalLutz Prechelt, prechelt@inf.fu-berlin.deNetwork– Security,IN2045Discrete EventWS 2008/09,Simulation,ChapterWS92010/201147
Statistical significance test: Example Our data: Aguilder: 175, 186, 137, 117, 92.8, 93.7 (mean 133) Egglips: 171, 155, 157, 181, 175, 160(mean 166) Null hypothesis: We assume the distributions underlying these data are both normal distributionswith the same variance the means of the actual distributions are in fact equal Then we can compute the probability for seeing this differenceof 33 from two samples of size 6The procedure for doing this is called the t-test(recall the confidence intervals? – It„s a very similar calculation)Results (10 degrees of freedom): p value: 0.08 the probability of the above result if the null hypothesis is true(i.e., difference is indeed zero) 95% confidence interval for true difference: -5 71Network– Security,IN2045Discrete EventWS 2008/09,Simulation,ChapterWS92010/201149
So? (Lessons for the author) So in our case we probably would believe the result and not findout that the experimenters had in fact cheated (And indeed they were lucky to get the result they got)Note: There are many different kinds of hypothesis tests and variousthings can be done wrong when using them In particular, watch out what the test assumes and what the p-value means, namely: The probability of seeing this data if the null hypothesis is true Note: The p-value is not the probability that the null hypothesis istrue! But unless the distribution of your samples is very strange or verydifferent, using the t-test is usually OK. Note: There are quite a number of different tests called “t test”. They have subtle yet important differences Network– Security,IN2045Discrete EventWS 2008/09,Simulation,ChapterWS92010/201150
Example: Error bars “Although a high variability in our measurementsresults in rather large error bars, our simulation resultsshow a clear increase in [whatever].”What‟s wrong here?Network– Security,IN2045Discrete EventWS 2008/09,Simulation,ChapterWS92010/201151
Lesson: Error bars What are the error bars? How are they defined? Minimum and maximum values? Confidence intervals? If so, at which level? 95%? 99%? Mean two standard deviations? First and third quartile? 10% and 90% quantile? Chebyshov* or Chernoff bounds?*also: Tschebyscheff, Tschebyschow, Chebyshev, Reader: Distrust error bars that are not explainedAuthor: Clearly state what kind of error bars you‟re using Usually, the best choice is to use confidence intervals,but stddev is also quite commonNetwork– Security,IN2045Discrete EventWS 2008/09,Simulation,ChapterWS92010/201152
Lesson for the author:Common errors for t tests and confidence intervals Recall: “But unless the distribution of your samples is very strange orvery different, using the t-test is usually OK.”If you do not have many samples (less than 30), then you must checkthat your input data looks more or less normally distributed At least check that the distribution does not look terribly skewed Better: do a QQ plot Even better: use a normality test You might make many runs, group them together and exploit theCentral Limit Theorem to get normally distributed data, but : Warning: Only defined if the variance of your samples is finite! Therefore won‟t work with, e.g., Pareto-distributed samples (α 2) You must ensure that the samples are not correlated! For example, a time series often is autocorrelated Group samples and calculate their average (Central Limit Theorem); makegroups large enough to let autocorrelation vanish Check with ACF plotor autocorrelation testor stationarity testNetwork– Security,IN2045Discrete EventWS 2008/09,Simulation,ChapterWS92010/201153
Lesson for the author:Check your prerequisites and assumptions! Similar errors can be committed with other statistical methodsUsual suspects: Input has to be normally distributed, or follow some otherdistribution Input must not be correlated Input has to come from a stationary process Input must be at least 30 samples (10; 50; 100; ) The two inputs must have the same variances The variance must be finite The two inputs must have the same distribution types of course, all this depends on the chosen method!Network– Security,IN2045Discrete EventWS 2008/09,Simulation,ChapterWS92010/201154
Summary When confronted with data or conclusions from dataone should always ask: Can they possibly know this? How?What do they really mean?Is the purported reason the real reason?Are the samples and measures unbiased and appropriate?Are the measures well-defined and valid?Are measures or visualizations misleading?Has something important been left out?Are there any inconsistencies (contradictions)?When we collect and prepare data, we should work thoroughly and carefully check our assumptions and prerequisites avoid distortions of any kindNetwork– Security,IN2045Discrete EventWS 2008/09,Simulation,ChapterWS92010/201167
Thank you!Lutz Prechelt, prechelt@inf.fu-berlin.deNetwork– Security,IN2045Discrete EventWS 2008/09,Simulation,ChapterWS92010/201168
Lies, Damned Lies, and Statistics." -attributed to Benjamin Disraeli Statistics are commonly used to make a point or back-up one‟s position 82.5% of all statistics are made up on the spot. Three sources of errors: If done in manipulative way, statistics can be deceiving If not done carefully, statistics can be deceiving