Transcription
StatisticsAuthorTNAU, Tamil Nadu
IndexSN LectureData – definition – Collection of data – Primary and secondary data –1Classification of data – Qualitative and quantitative dataDiagrammatic representation of data – uses and limitations – simple,2Multiple, Component and percentage bar diagrams – pie chartGraphical representation – Histogram – Frequency polygon and Frequency3curveMeasures of averages - Mean – median – mode – geometric mean –harmonic mean – computation of the above statistics for raw and grouped4data - merits and demerits - measures of location – percentiles – quartiles computation of the above statistics for raw and grouped dataMeasures of dispersion - Range, Variance -Standard deviation – co-efficient5of variation - computation of the above statistics for raw and grouped dataProbability – Basic concepts-trial- event-equally likely- mutually exclusive –independent event, additive and multiplicative laws. Theoretical6distributions discreteand continuous distributions, Binomial distributions-properties7 Poisson Distributions - properties, Normal Distributions- propertiesSampling-basic concepts- sampling vs complete enumeration parameter8 and statistic-sampling methods-simple random sampling and stratifiedrandom samplingTest of significance – Basic concepts – null hypothesis – alternative9 hypothesis – level of significance – Standard error and its importance –steps in testingT-test – definition – assumptions – test for equality of two means10independent and paired t testAttributes- Contingency table – 2x2 contingency table – Test for11independence of attributes – test for goodness of fit of mendalian ratioCorrelation – definition – Scatter diagram -Pearson’s correlation co-efficient12– properties of correlation coefficientRegression – definition – fitting of simple linear regression equation –13testing the significance of the regression coefficientDesign of experiments – basic concepts – treatment – experimental unit –14 experimental error - basic principle – replication, randomization and localcontrol.Completely randomized design – description – layout – analysis –15advantages and disadvantagesRandomized blocks design – description – layout – analysis – advantages16and disadvantagesPage -119120-129130-135136-141142-144145-148149-151
17181920212223P1P2P3P4P5P6P7P8P9P10P11P12P13Latin square design – description – layout – analysis – advantages anddisadvantagesFactorial experiments – factor and levels – types – symmetrical andasymmetrical – simple, main and interaction effects – advantages anddisadvantages22 Factorial Experiments in RBD – lay out – analysis23 factorial experiments in RBD – lay out – analysisSplit plot design – layout – ANOVA TableStrip plot design – layout – ANOVA TableLong term experiments – ANOVA table – guard rows – optimum plot size –determination methods.Diagrammatic and graphic representation – simple, multiple, componentand percentage bar diagram – pie chart – histogram. Frequency polygon,frequency curveMeasures of central tendency – mean median, mode, geometric mean,harmonic mean for raw dataMeasures of central tendency – mean, median, mode, geometric mean andharmonic mean for grouped dataMeasures of dispersion – variance, standard deviation and coefficient ofvariation for raw dataMeasures of dispersion – variance, standard deviation and coefficient ofvariation for grouped dataSelection of simple random sampling using lottery method and randomnumbersStudents’s t test – paired and independent t testChi square test – test for association and goodness of fitCalculation of Karl Pearson’s correlation coefficientFitting of simple linear regression of y on xFormation of ANOVA table for completely Randomised design (CRD) withequal replication and comparison of means using critical difference valuesFormation of ANOVA table for Randomised blocks design (RBD) andcomparison of means using critical difference valuesFormation of ANOVA table for Latin square design (LSD) and comparisonof means using critical difference -229230-238239-241242-245246-252253-259260-266
StatisticsLecture.1Data – definition – Collection of data – Primary and secondary data – Classificationof data – Qualitative and quantitative data.Basic ConceptsStatistics (Definition)Quantitative figures are known as data.Statistics is the science which deals with the(i)Collection of data(ii)Organization of data or Classification of data(iii)Presentation of data(iv)Analysis of data(v)Interpretation of dataData and statistics are not same as used commonly.Example for data1. No. of farmers in a block.2. The rainfall over a period of time.3. Area under paddy crop in a state.Functions of statisticsStatistics simplifies complexity, presents facts in a definite form, helps informulation of suitable policies, facilitates comparison and helps in forecasting.Uses of statisticsStatistics has pervaded almost all spheres of human activities. Statistics is usefulin the administration of various states, Industry, business, economics, research workers,banking, insurance companies etc.1www.AgriMoon.Com5
StatisticsLimitations of Statistics1. Statistical theories can be applied only when there is variability in theexperimental material.2. Statistics deals with only aggregates or groups and not with individual objects.3. Statistical results are not exact.4. Statistics can be misused.Collection of dataData can be collected by using sampling methods or experiments.DataThe information collected through censuses and surveys or in a routine manner orother sources is called a raw data. When the raw data are grouped into groups or classes,they are known as grouped data.There are two types of data1. Primary data2. Secondary data.Primary dataThe data which is collected by actual observation or measurement or count iscalled primary data.Methods of collection of primary dataPrimary data is collected in any one of the following methods1. Direct personal interviews.2. Indirect oral interviews3. Information from correspondents.4. Mailed questionnaire method.5. Schedules sent through enumerators.2www.AgriMoon.Com6
Statistics1. Direct personal interviewsThe persons from whom information are collected are known as informants orrespondents. The investigator personally meets them and asks questions to gather thenecessary information.Merits1. The collected informations are likely to be uniform and accurate. The investigatoris there to clear the doubts of the informants.2. People willingly supply information because they are approached personally.Hence more response is noticed in this method then in any other method.LimitationsIt is likely to be very costly and time consuming if the number of persons to beinterviewed is large and the persons are spread over a wide area.2. Indirect oral interviewsUnder this method, the investigator contacts witnesses or neighbors or friends orsome other third parties who are capable of supplying the necessary information.MeritsFor almost all the surveys of this kind, the informants like within a closed area.Hence, the time and the cost are less. For certain surveys, this is the only methodavailable.LimitationsThe information obtained by this method is not very reliable. The informants andthe person who conducts a survey easily distort the truth.3. Information from correspondentsThe investigator appoints local agents or correspondents in different places andcompiles the information sent by them.3www.AgriMoon.Com7
StatisticsMerits For certain kinds of primary data collection, this is the only method available. This method is very cheap and expeditious. The quality of data collected is also good due to long experience of localrepresentatives.LimitationsLocal agents and correspondents are not likely to be serious and careful.4. Mailed Questionnaire methodUnder this method a list of questions is prepared and is sent to all the informantsby post. The list of questions is technically called questionnaire.Merits1. It is relatively cheap.2. It is preferable when the informants are spread over a wide area.3. It is fast if the informants respond duly.Limitations1. Were the informants are illiterate people, this method cannot be adopted.2. It is possible that some of the persons who receive the questionnaires do notreturn them. Their action is known as non – response.5. Schedules sent through enumeratorsUnder this method, enumerators or interviewers take the schedules, meet theinformants and fill in their replies. A schedule is filled by the interviewer in a face to facesituation with the informant.Merits1. It can be adopted even if the informants are illiterate.4www.AgriMoon.Com8
Statistics2. Non-response is almost nil as the enumerators go personally and contact theinformants.3. The informations collected are reliable. The enumerators can be properly trainedfor the same.Limitations1. It is costliest method.2. Extensive training is to be given to the enumerators for collecting correct anduniform informations.Secondary dataThe data which are compiled from the records of others is called secondary data.The data collected by an individual or his agents is primary data for him andsecondary data for all others. The secondary data are less expensive but it may not giveall the necessary information.Secondary data can be compiled either from published sources or fromunpublished sources.Sources of published data1. Official publications of the central, state and local governments.2. Reports of committees and commissions.3. Publications brought about by research workers and educational associations.4. Trade and technical journals.5. Report and publications of trade associations, chambers of commerce, bank etc.6. Official publications of foreign governments or international bodies like U.N.O,UNESCO etc.Sources of unpublished dataAll statistical data are not published. For example, village level officials maintainrecords regarding area under crop, crop production etc. They collect details for5www.AgriMoon.Com9
Statisticsadministrative purposes. Similarly details collected by private organizations regardingpersons, profit, sales etc become secondary data and are used in certain surveys.Characteristics of secondary dataThe secondary data should posses the following characteristics. They should bereliable, adequate, suitable, accurate, complete and consistent.VariablesVariability is a common characteristic in biological Sciences. A quantitative orqualitative characteristic that varies from observation to observation in the same group iscalled a variable.Quantitative dataThe basis of classification is according to differences in quantity. In case ofquantitative variables the observations are made in terms of kgs, Lt, cm etc. Exampleweight of seeds, height of plants.Qualitative dataWhen the observations are made with respect to quality is called qualitative data.Eg: Crop varieties, Shape of seeds, soil type.The qualitative variables are termed as attributes.Classification of dataClassification is the process of arranging data into groups or classes according tothe common characteristics possessed by the individual items.Data can be classified on the basis of one or more of the following kinds namely1. Geography2. Chronology3. Quality4. Quantity.6www.AgriMoon.Com10
Statistics1. Geographical classification (or) Spatial ClassificationSome data can be classified area-wise, such as states, towns etc.Data on area under crop in India can be classified as shown belowRegionCentral IndiaWestNorthEastSouthArea ( in hectares)-2. Chronological or Temporal or Historical ClassificationSome data can be classified on the basis of time and arranged chronologically orhistorically.Data on Production of food grains in India can be classified as shown -3. Qualitative ClassificationSome data can be classified on the basis of attributes or characteristics. The number offarmers based on their land holdings can be given as followsType of farmersMarginalMediumLargeTotalNumber of farmers907104119483896Qualitative classification can be of two types as follows(i)Simple classification(ii)Manifold classification7www.AgriMoon.Com11
Statistics(i) Simple ClassificationThis is based on only one quality.Eg:Cultivable landRainfedEducational level of farmersIrrigatedliterateIlliterate(ii) Manifold ClassificationThis is based on more than one quality.Eg:No. of FarmsRainfedFood CropsIrrigatedVeg andOthersFood CropsVeg andOthers4. Quantitative classificationSome data can be classified in terms of magnitude. The data on land holdings byfarmers in a block. Quantitative classification is based the land holding which is thevariable in this example.Land holding ( hectare) 11-22-5 5TotalNumber of Farmers44290847112419458www.AgriMoon.Com12
StatisticsDifference between Primary and secondary data1. Original data2. Suitability3. Time and labour4. PrecautionPrimary DataSecondary DataPrimary data are original Secondary data are notbecause investigation himself original since investigatorcollects them.makes use of the otheragencies.If these data are collected These might or might not suitaccurately and systematically the objectives of enquiry.their suitability will be verypositive.These data involve large These data are relatively lessexpenses in terms of money, costly.time and manpowerdon’t need any great These should be used withprecaution while using these great care and caution.data.Questions1. A simple table contains data ona) Two characteristicsc) One characteristicb) Several characteristicsd) Three characteristicsAns: One characteristic2. When the collected data is grouped with reference to time, we havea) Quantitative classificationb) Qualitative classificationc) Geographical Classificationd) Chorological ClassificationAns: Chorological Classification3. Geographical classification means, classification of data according to Region.Ans: True4. An arrangement of data into rows and columns is known as Tabulation.Ans: True5. Data on yield is a quantitative variableAns: True9www.AgriMoon.Com13
Statistics6. Qualitative variables are also called as attributes.Ans: True7. Define primary and secondary data8. Give the advantages of tabulation.9. Write a detail note on the types of classification10. What are the essential characteristics of a good table?10www.AgriMoon.Com14
StatisticsLecture.2Diagrammatic representation of data – uses and limitations – simple, Multiple,Component and percentage bar diagrams – pie chartDiagramsDiagrams are various geometrical shape such as bars, circles etc. Diagrams arebased on scale but are not confined to points or lines. They are more attractive and easierto understand than graphs.Merits1. Most of the people are attracted by diagrams.2. Technical Knowledge or education is not necessary.3. Time and effort required are less.4. Diagrams show the data in proper perspective.5. Diagrams leave a lasting impression.6. Language is not a barrier.7. Widely used tool.Demerits (or) limitations1. Diagrams are approximations.2. Minute differences in values cannot be represented properly in diagrams.3. Large differences in values spoil the look of the diagram.4. Some of the diagrams can be drawn by experts only. eg. Pie chart.5. Different scales portray different pictures to laymen.Types of DiagramsThe important diagrams are1. Simple Bar diagram.2. Multiple Bar diagram.3. Component Bar diagram.4. Percentage Bar diagram.1www.AgriMoon.Com15
Statistics5. Pie chart6. Pictogram7. Statistical maps or cartograms.In all the diagrams and graphs, the groups or classes are represented on the x-axisand the volumes or frequencies are represented in the y-axis.Simple Bar diagramIf the classification is based on attributes and if the attributes are to be comparedwith respect to a single character we use simple bar diagram.Example1. The area under different crops in a state.2. The food grain production of different years.3. The yield performance of different varieties of a crop.4. The effect of different treatments etc.Simple bar diagrams Consists of vertical bars of equal width. The heights of thesebars are proportional to the volume or magnitude of the attribute. All bars stand on thesame baseline. The bars are separated from each others by equal intervals. The bars maybe coloured or marked.ExampleThe cropping pattern in Tamil Nadu in the year 1974-75 was as follows.CropsCerealsOilseedsPulsesCottonOthersArea In 1,000 hectares39401165464249822The simple bar diagram for this data is given below.2www.AgriMoon.Com16
StatisticsMultiple bar diagramIf the data is classified by attributes and if two or more characters or groups are tobe compared within each attribute we use multiple bar diagrams. If only two charactersare to be compared within each attribute, then the resultant bar diagram used is known asdouble bar diagram.The multiple bar diagram is simply the extension of simple bar diagram. For eachattribute two or more bars representing separate characters or groups are to be placed sideby side. Each bar within an attribute will be marked or coloured differently in order todistinguish them. Same type of marking or colouring should be done under each attribute.A footnote has to be given explaining the markings or colourings.ExampleDraw a multiple bar diagram for the following data which represented agriculturalproduction for the priod from 2000-2004Year20002001200220032004Food grains (tones)100120130150Vegetables (tones)30404550Others (tones)101525253www.AgriMoon.Com17
StatisticsComponent bar diagramThis is also called sub – divided bar diagram. Instead of placing the bars for eachcomponent side by side we may place these one on top of the other. This will result in acomponent bar diagram.Example:Draw a component bar diagram for the following dataYearSales (Rs.)Gross Profit (Rs.)Net Profit www.AgriMoon.Com18
StatisticsPercentage bar diagramSometimes when the volumes of different attributes may be greatly different formaking meaningful comparisons, the attributes are reduced to percentages. In that caseeach attribute will have 100 as its maximum volume. This sort of component bar chart isknown as percentage bar diagram.Percentage ,Example:Draw a Percentage bar diagram for the following dataUsing the formula Percentage , the above table isconverted.YearSales (Rs.)Gross Profit (Rs.)Net Profit 512.5197766.6722.2211.115www.AgriMoon.Com19
StatisticsPie chart / Pie DiagramPie diagram is a circular diagram. It may be used in place of bar diagrams. Itconsists of one or more circles which are divided into a number of sectors. In theconstruction of pie diagram the following steps are involved.Step 1:Whenever one set of actual value or percentage are given, find the correspondingangles in degrees using the following formulaAngle (or) Angle Step 2:Find the radius using the area of the circle π r2 where value of π is 22/7 or 3.14ExampleGiven the cultivable land area in four southern states of India. Construct a pie diagram forthe following data.StateCultivable area( in hectares)Andhra Pradesh663Karnataka448Kerala290Tamil Nadu556Total1957Using the formulaAngle (or)Angle 6www.AgriMoon.Com20
StatisticsThe table value becomesStateAndhra PradeshKarnatakaKeralaTamil NaduCultivable area121.9682.4153.35102.28Radius πr2Here πr2 1957r2 r 24.96r 25 TamilNaduQuestions1. In a component bar diagram the length of the bara) Will be same for allb) Depends on the totalc) will not be samed) none of theseAns: Depends on the total7www.AgriMoon.Com21
Statistics2. The length of the bar will be same for all categories ina) Multiple bar diagramb) component bar diagramc) Percentage bar diagramd) none of theseAns: Percentage bar diagram3. Sub-divided bar diagram are also called Component bar diagram.Ans: True4. The multiple bar diagram is the extension of simple bar diagram.Ans: True5. In a bar the width of the bars should be equal.Ans: True6. In a percentage bar diagram the length of the bars will not be equal.Ans: False7. How diagrams are useful in representing statistical data?8. How to draw a pie chart?9. Explain how to draw simple and multiple bar diagrams.10. Explain how to draw Component and percentage bar diagrams.8www.AgriMoon.Com22
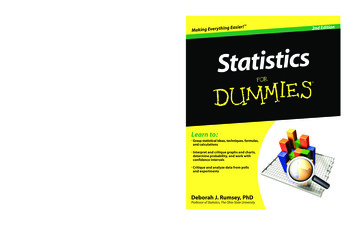
StatisticsLecture.3Graphical representation – Histogram – Frequency polygon andFrequency curveGraphsGraphs are charts consisting of points, lines and curves. Charts are drawn ongraph sheets. Suitable scales are to be chosen for both x and y axes, so that the entire datacan be presented in the graph sheet. Graphical representations are used for groupedquantitative data.HistogramWhen the data are classified based on the class intervals it can be represented by ahistogram. Histogram is just like a simple bar diagram with minor differences. There isno gap between the bars, since the classes are continuous. The bars are drawn only inoutline without colouring or marking as in the case of simple bar diagrams. It is thesuitable form to represent a frequency distribution.Class intervals are to be presented in x axis and the bases of the bars are therespective class intervals. Frequencies are to be represented in y axis. The heights of thebars are equal to the corresponding frequencies.ExampleDraw a histogram for the following dataSeed Yield -9.59.5-10.5No. of Plants46102624151051www.AgriMoon.Com23
StatisticsHistogram302No. .58.59.59.5-010.5SeedYieldFrequency PolygonThe frequencies of the classes are plotted by dots against the mid-points of eachclass. The adjacent dots are then joined by straight lines. The resulting graph is known asfrequency polygon.ExampleDraw frequency polygon for the following dataSeed Yield (gms)No. of .5-8.5158.5-9.5109.5-10.552www.AgriMoon.Com24
StatisticsFrequency curveThe procedure for drawing a frequency curve is same as for frequency polygon.But the points are joined by smooth or free hand curve.ExampleDraw frequency curve for the following dataSeed Yield (gms)No. of .5-8.5158.5-9.5109.5-10.553www.AgriMoon.Com25
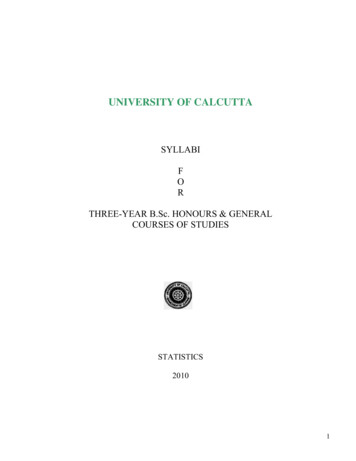
StatisticsOgivesOgives are known also as cumulative frequency curves and there are two kinds ofogives. One is less than ogive and the other is more than ogive.Less than ogive: Here the cumulative frequencies are plotted against the upper boundaryof respective class interval.Greater than ogive: Here the cumulative frequencies are plotted against the lowerboundaries of respective class 0-4040-50Mid PointFrequency515253545476102 cumulativeFrequency411172729 cumulativefrequency2925181224www.AgriMoon.Com26
Cumulative FrequencyStatisticsBoundary valuesQuestions1. With the help of histogram we can draw(a) Frequency polygon(b) frequency curve(c) Frequency distribution(d) all the aboveAns: all the above2. Ogives for more than type and less than type distribution intersect at(a) Mean(b) median(c) Mode(d) originAns: median3. To draw the frequency polygon we take the mid values in the X axis.4. To draw the frequency polygon we take the mid values in the X axis.5. In a frequency curve the points are joined by bits of straight linesAns: False6. He stogram can be drawn for equal and unequal classesAns: True7. Explain how to draw frequency curve8. Explain how to draw histogram.9. Explain the diagrams that can be drawn for a frequency distribution table10. Explain how to draw less than and more than Ogives.5www.AgriMoon.Com27
StatisticsLecture.4Measures of averages - Mean – median – mode – geometric mean – harmonic mean –computation of the above statistics for raw and grouped data - merits and demerits measures of location – percentiles – quartiles - computation of the above statistics for rawand grouped dataIn the study of a population with respect to one in which we are interested we may get alarge number of observations. It is not possible to grasp any idea about the characteristic whenwe look at all the observations. So it is better to get one number for one group. That numbermust be a good representative one for all the observations to give a clear picture of thatcharacteristic. Such representative number can be a central value for all these observations. Thiscentral value is called a measure of central tendency or an average or a measure of locations.There are five averages. Among them mean, median and mode are called simple averages andthe other two averages geometric mean and harmonic mean are called special averages.Arithmetic mean or meanArithmetic mean or simply the mean of a variable is defined as the sum of theobservations divided by the number of observations. It is denoted by the symbolIf thevariable x assumes n values x1, x2 xn then the mean is given byThis formula is for the ungrouped or raw data.Example 1Calculate the mean for pH levels of soil 6.8, 6.6, 5.2, 5.6, 5.8SolutionGrouped DataThe mean for grouped data is obtained from the following formula:www.AgriMoon.Com28
StatisticsWhere x the mid-point of individual classf the frequency of individual classn the sum of the frequencies or total frequencies in a sample.Short-cut methodWhereA any value in xn total frequencyc width of the class intervalExample 2Given the following frequency distribution, calculate the arithmetic meanMarks: 646362616059:1812976Number 347445494203543713D x-A210-1-2-3Fd16180-9-14-18-7Direct methodwww.AgriMoon.Com29
StatisticsShort-cut methodHere A 62Example 3For the frequency distribution of seed yield of seasamum given in table, calculate the mean yieldper plot.Yield per 64.5-84.5plot in(ing)No onYield ( in g)No of Plots (f)Mid 203574.594.5114.5134.5Fd-1012-3074044A 94.5The mean yield per plot isDirect method: 119.64 gmsShortcut methodwww.AgriMoon.Com30
StatisticsMerits and demerits of Arithmetic meanMerits1. It is rigidly defined.2. It is easy to understand and easy to calculate.3. If the number of items is sufficiently large, it is more accurate and more reliable.4. It is a calculated value and is not based on its position in the series.5. It is possible to calculate even if some of the details of the data are lacking.6. Of all averages, it is affected least by fluctuations of sampling.7. It provides a good basis for comparison.Demerits1. It cannot be obtained by inspection nor located through a frequency graph.2. It cannot be in the study of qualitative phenomena not capable of numerical measurement i.e.Intelligence, beauty, honesty etc.,3. It can ignore any single item only at the risk of losing its accuracy.4. It is affected very much by extreme values.5. It cannot be calculated for open-end classes.6. It may lead to fallacious conclusions, if the details of the data from which it is computed arenot given.MedianThe median is the middle most item that divides the group into two equal parts, one partcomprising all values greater, and the other, all values less than that item.Ungrouped or Raw dataArrange the given values in the ascending order. If the number of values are odd, medianis the middle valueIf the number of values are even, median is the mean of middle two values.By formulaWhen n is odd, Median Md www.AgriMoon.Com31
StatisticsWhen n is even, Average ofExample 4If the weights of sorghum ear heads are 45, 60,48,100,65 gms, calculate the medianSolutionHere n 5First arrange it in ascending order45, 48, 60, 65, 100Median 60Example 5If the sorghum ear- heads are 5,48, 60, 65, 65, 100 gms, calculate the median.SolutionHere n 6Grouped dataIn a grouped distribution, values are associated with frequencies. Grouping can be in theform of a discrete frequency distribution or a continuous frequency distribution. Whatever maybe the type of distribution, cumulative frequencies have to be calculated to know the totalnumber of items.www.AgriMoon.Com32
StatisticsCumulative frequency (cf)Cumulative frequency of each class is the sum of the frequency of the class and thefrequencies of the pervious classes, ie adding the frequencies successively, so that the lastcumulative frequency gives the total number of items.Discrete SeriesStep1: Find cumulative frequencies.Step3: See in the cumulative frequencies the value just greater thanStep4: Then the corresponding value of x is median.Example 6The following data pertaining to the number of insects per plant. Find median number of insectsper plant.Number of insects per plant (x)No. of plants(f)Solution112335465106 713 98593102112121Form the cumulative frequency 75255575960Median size ofHere the number of observations is even. Therefore median average of (n/2)th item and(n/2 1)th item.www.AgriMoon.Com33
Statistics (30th item 31st item) / 2 (6 6)/2 6Hence the median size is 6 insects per plant.Continuous SeriesThe steps given below are followed for the calculation of median in continuous series.Step1: Find cumulative frequencies.Step2: FindStep3: See in the cumulative frequency the value first greater than, Then the correspondingclass interval is called the Median class. Then apply the formulaMedian wherel Lower limit of the medianal classm cumulative frequency preceding the medianal classc width of the classf frequency in the median class.n Total frequency.Example 7For the frequency distribution of weights of sorghum ear-heads given in table below. Calculatethe median.Weights of earhead
Statistics simplifies complexity, presents facts in a definite form, helps in formulation of suitable policies, facilitates comparison and helps in forecasting. Uses of statistics Statistics has pervaded almost all spheres of human activities. Statistics is useful in the administration of various states, Industry, business, economics, research .