Transcription
ARIZONAMOTOR VEHICLE CRASH FACTS2016
2016 Arizona Crash Facts SummaryIntentionally left blank2016 Motor VehicleCrash Facts for the State of ArizonaPrepared by:The Arizona Department of TransportationTransportation Systems Management and OperationsPublication Date: February 1, 2018This publication is an annual statistical review of the motor vehicle crashes in the State of Arizona for the calendar year 2016. Theresults are compiled from Arizona Traffic Crash Reports submitted to the Arizona Department of Transportation by state, county, city,tribal, and other law enforcement agencies. Specific inquiries regarding the data in this report should be directed to:The Arizona Department of TransportationTransportation Systems Management and OperationsTraffic Safety Section1615 West Jackson StreetPhoenix, AZ 85007E-mail: azcrashfacts@azdot.gov0HIn order to provide the most current information, preliminary data is utilized when necessary. For this reason, previous or futurereports may differ slightly and we encourage you to refer to the latest issue of Motor Vehicle Crash Facts.This issue as well as previous issues of this publication may be viewed and downloaded from ADOT’s Web Site at:www.azdot.gov/crashfacts1H2016 Arizona Crash Facts SummaryPage i
2016 Arizona Crash Facts SummaryDouglas A. DuceyGovernorArizona Department of TransportationJohn S. HalikowskiDirectorState Transportation BoardDeanna L. Beaver – District 6ChairwomanWilliam F. Cuthbertson – District 3Vice ChairmanMembersJoseph E. La Rue – District 1Jack Sellers – District 1Michael S. Hammond – District 2Steve Stratton – District 4Arlando S. Teller – District 5Page ii2016 Arizona Crash Facts Summary
2016 Arizona Crash Facts SummaryOVERVIEWSection 1: – Highlights and Historical Trends . 1Section 2: – Geographic Location . 9Section 3: – Crash Descriptions. 17Section 4: – Safety Devices . 23Section 5: – Motor Vehicle and Driver Descriptions . 26Section 6: – Alcohol Related Crashes . 33Section 7: – Pedestrian and Pedalcyclist Crashes . 42Section 8: – Motorcycle (MC) Crashes . 48Acknowledgements . 582016 Arizona Crash Facts SummaryPage iii
2016 Arizona Crash Facts SummaryTable of ContentsSection 1: Highlights and Historical Trends .1Arizona Crash Facts Summary and Comparison.2Arizona at a Glance – 2016 .2Licensed Drivers, Motor Vehicle Registration and Crash History in Arizona 3Historical Trends – VMT and Rates. . .3Statewide Economic Loss Due to Motor Vehicle Crashes .4Average Economic Cost per Incident .4Traffic Crashes in Arizona by Year .5Victims of Motor Vehicle Crashes .6Fatalities by Person Type 2012-2016 . .6Young Drivers (age 15-24) killed in crashes 2012-2016 . 6Vehicle Miles Traveled .7Arizona Fatality Rate vs. Injury Rate . .7Traffic Fatalities by Geographic Region .7Traffic Injuries by Geographic Region 7Holiday Crash Statistics .8Section 2: Geographic Location .9Crash Severity by First Harmful Event Statewide .10Crashes by County .10Crash Severity by First Harmful Event in Urban Areas 11Crash Severity by First Harmful Event in Rural Areas .11Analysis by Jurisdiction .12Total Fatalities by County for 2015 and 2016 .15Urban and Rural Crashes by Day of Week .16Urban and Rural Fatal Crashes by Day of Week .16All Urban and Rural Crashes vs. Urban and Rural Fatal Crashes by Month .16Section 3: Crash Descriptions .17Manner of Collision in Multi-Vehicle Crashes .18Lighting Conditions .18Weather Conditions .18Road Surface Conditions .19Roadway Grade .19Roadway Alignment .19All Crashes vs. Fatal Crashes by Time of Day - Weekdays .20All Crashes vs. Fatal Crashes by Time of Day - Weekends .20Crashes by Day of Week 21Fatal Crashes by Day of Week .21All Crashes vs. Fatal Crashes by Month 21Crashes by Hour and Day of Week 22Section 4: Safety Devices .23Child Safety Device Usage (less than five years old) . .24Driver Safety Device Usage .24Passenger Safety Device Usage .24Driver Safety Device Usage by Gender .25Driver Safety Device Usage by Age .25Section 5: Motor Vehicle and Driver Descriptions .26Arizona Motor Vehicle Registrations . .27Motor Vehicle Crash Involvement by Vehicle Type .27Page iv2016 Arizona Crash Facts Summary
2016 Arizona Crash Facts SummaryHit and Run Drivers Involved in Crashes .28Gender of Drivers Involved in Crashes .28License Status of Drivers Involved in Crashes .28Passengers Killed and Injured by Age and Gender .28Drivers and Passengers Killed and Injured by Vehicle Type 29Drivers Killed and Injured by Age and Gender .29Licensed Drivers in Arizona by Age .30Driver Involvement by Age .30Driver Violations .31Driver Physical Condition .31Distracted Driving Behavior .32Secondary Crashes .32Section 6: Alcohol Related Crashes .33Economic Loss Due to Alcohol Related Crashes in Arizona for 2016 .34Alcohol Related Crash History .34Manner of Collision in Alcohol Related Crashes .34Alcohol Related Crashes by First Harmful Event . .35Alcohol Related Crashes by Vehicle Type 35Lighting Conditions in Alcohol Related Crashes .36Road Surface Conditions in Alcohol Related Crashes .36Gender of Drivers Involved in Alcohol Related Crashes .36Driver Involvement by Age in Alcohol Related Crashes .37When Alcohol Related Crashes Occurred in 2016 37Safety Device Usage for Drinking Drivers 37Persons Killed and Injured in Alcohol Related Crashes 38Alcohol Related Crashes by County .38All Alcohol Related Crashes vs. Fatal Alcohol Related Crashes by Day of Week .39All Alcohol Related Crashes vs. Fatal Alcohol Related Crashes by Month .39All Alcohol Related Crashes vs. Fatal Alcohol Related Crashes - Weekdays .40All Alcohol Related Crashes vs. Fatal Alcohol Related Crashes - Weekends .40Alcohol Related Crashes by Hour and Day of Week 41Section 7: Pedestrian and Pedalcyclist Crashes .42Pedestrians Killed and Injured By Age and Gender .43Pedestrian Crashes by Geographic Location .43Pedestrian Crash History .43Pedestrians Killed by Age and Action .44Pedestrians Injured by Age and Action .44Pedestrian Physical Condition in Motor Vehicle Crashes .44Lighting Conditions in Pedestrian Crashes 45Weather Conditions in Pedestrian Crashes 45Pedalcyclists Killed and Injured by Age and Gender . .45Pedalcycle Crashes by Geographic Location .46Pedalcycle Crash History .46Lighting Conditions in Pedalcyclist Crashes .46Weather Conditions in Pedalcyclist Crashes .46Pedestrian Crashes by County .47Pedalcyclist Crashes by County .47Section 8: Motorcycle (MC) Crashes .48MC Fatalities by Year 49MC Registrations in Arizona .49Fatality Rate per Registered MC 49Percent of MC Crashes to All Crashes .49MC Crashes by First Harmful Event .50Lighting Conditions in MC Crashes .50Road Surface Conditions in MC Crashes .502016 Arizona Crash Facts SummaryPage v
2016 Arizona Crash Facts SummaryMC Crashes by Geographic Location 51Operator Involvement by Age in MC Crashes .51MC Operator Physical Condition .51Helmet Use by Gender . .52MC Operator’s Helmet Use .52MC Passenger’s Helmet Use .52MC Operators and Passengers Killed and Injured .53MC Operator Violations. .53All MC Crashes vs. Fatal MC Crashes by Time of Day - Weekdays 54All MC Crashes vs. Fatal MC Crashes by Time of Day - Weekends 54All MC Crashes vs. Fatal MC Crashes by Day of Week .55Alcohol Related MC Crashes vs. Fatal Alcohol Related MC Crashes by Day of Week .55MC Crashes by Hour and Day of Week 56MC Crashes by County .57Manner of Collision in MC Crashes .57Acknowledgements .58Page vi2016 Arizona Crash Facts Summary
2016 Arizona Crash Facts SummaryBREAKDOWN OF ALL CRASHES IN ARIZONATOTALFATALINJURYPROPERTY DAMAGE ONLYURBANRURALALCOHOL RELATEDPEDES TRIANPEDALCYCLEMOTORCYCLES INGLE 3,6484,9421,6431,4793,11520,073106,914BREAKDOWN OF FATAL CRASHES IN ARIZONATOTALALCOHOL RELATEDURBANRURALS INGLE VEHICLEMULTI-VEHICLEALCOHOL RELATED S INGLE VEHICLEALCOHOL RELATED MULTI-VEHICLE85626748936729556199168BREAKDOWN OF PERSONS KILLED AND INJUREDTYPEIN ALL CRAS HESIN ALCOHOL RELATED CRAS HESIN URBAN CRAS HESIN RURAL CRAS HESS PEED RELATED*US ING S AFETY DEVICENOT US ING S AFETY DEVICEDRIVERS AGE 24 OR YOUNGERDRINKING DRIVERS AGE 24 OR OWN OF CRASHES BY TIMEPEAK MONTH FOR ALL CRAS HESPEAK DAY FOR ALL CRAS HESPEAK HOUR FOR ALL CRAS HESPEAK HOUR FOR FATAL CRAS HESPEAK DAY FOR FATAL CRAS HESPEAK DATE FOR ALL CRAS HES IN 2016PEAK DATE FOR FATAL CRAS HES IN 2016PEAK HOUR FOR ALCOHOL RELATED CRAS HESPEAK DAY FOR MOTORCYCLE CRAS HESPEAK HOUR FOR ALL MOTORCYCLE CRAS HESM ARCHFRIDAY4 PM - 5 PM7 PM - 8 PMSATURDAYJANUARY 7TH (577 CRASHES)NOVEM BER 8TH (8 CRASHES)2 AM - 3 AMSATURDAY4 PM - 5 PMOTHER FACTSMOS T COMMON MANNER OF COLLIS IONMOS T COMMON DRIVER VIOLATIONREAR ENDSPEED TOO FAST FOR CONDITIONS*Note: These numbers represent the total number of fatalities and injuries in crashes where the violation "speed too fastfor conditions" or "exceeded lawful speed" was marked on the crash form.2016 Arizona Crash Facts SummaryPage vii
2016 Arizona Crash Facts SummaryTHIS PAGE LEFT BLANK FOR PRINTING PURPOSESPage viii2016 Arizona Crash Facts Summary
Section 1Highlights and Historical TrendsTotal 19320.27%Page 1 – 2016 Arizona Crash Facts SummaryProperty DamageOnly %Pedalcyclists313.26%
Section 1: – Highlights and Historical TrendsTable 1 – 1Arizona Crash Facts Summary and ComparisonCategoryTotal CrashesTotal FatalitiesTotal InjuriesAlcohol Related FatalitiesAlcohol Related InjuriesUrban FatalitiesUrban InjuriesRural FatalitiesRural InjuriesMC Operator and Passenger FatalitiesMC Operator and Passenger InjuriesPedestrians FatalitiesPedestrians InjuriesPedalcyclist FatalitiesPedalcyclist InjuriesMillions of vehicle miles traveled (VMT)Fatalities per 100 million VMTInjuries per 100 million 01%10.71%5.63%0.86%5.22%4.75%Arizona at a Glance – 2016 Approximately 2.61 persons were killed each day. One person was killed every 9.21 hours. There were 155.38 persons injured every day. One person was injured every 9.27 minutes. Alcohol Related crashes accounted for 3.89% of all crashes and 31.19% of all fatal crashes. Of all alcohol related crashes, 78.71% occurred in Urban areas and 21.29% occurred in Rural areas,while 66.67% of all alcohol related fatal crashes occurred in Urban areas and 33.33% occurred inRural areas. Single vehicle crashes accounted for 15.81% of all crashes and 34.46% of all fatal crashes. Of all Pedestrian crashes, 11.75% were fatal while 2.10% of Pedalcycle crashes were fatal. Crashes which occurred during daylight hours (6:00 a.m. to 6:00 p.m.) accounted for 72.4% of allcrashes. Motor vehicle crashes resulted in 10.707 billion in economic losses to Arizona. Children age 14 and younger accounted for 36 fatalities and 3,597 injuries in motor vehicle crashes.Page 2 – 2016 Arizona Crash Facts Summary
Section 1: – Highlights and Historical TrendsTable 1 – 2Licensed Drivers, Motor Vehicle Registrationand Crash History in rashesPropertyDamage 08Table 1 – 3Historical Trends – VMT and ateArizonaTrafficFatalitiesEstimated MotorVehicle MilesTraveledArizona FatalCrash ,0451.2520161.4586.5195265,6061.30Vehicle miles traveled are shown in million miles and rates per 100 million milesPage 3 – 2016 Arizona Crash Facts Summary
Section 1: – Highlights and Historical TrendsStatewide Economic Loss Due to Motor Vehicle CrashesFatalitiesIncapacitating InjuriesNon-Incapacitating InjuriesPossible InjuriesProperty Damage Only 5,521,600,000 1,828,000,000 1,717,680,000 1,289,904,000 350,060,000TOTAL 10,707,244,000Table 1 – 4Estimated Economic Loss by CountyCountyCost of Traffic ninoGilaGrahamGreenleeLa PazMaricopaMohaveNavajoPimaPinalSanta CruzYavapaiYuma 00104,400,000 086,000 1,476,0001,640,0009,888,0006,772,000 4,000208,258,000TOTALS 5,521,600,000 4,835,584,000 350,060,000 10,707,244,000Table 1 – 5Average Economic Cost per Incident1.Fatality 5,800,0002.Incapacitating Injury3.Non-Incapacitating Injury 80,0004.Possible Injury 42,0005.Property Damage Only 400,000 4,000Source: www.cmfclearinghouse.org/resources servlifecrashcostguide.cfmPage 4 – 2016 Arizona Crash Facts Summary
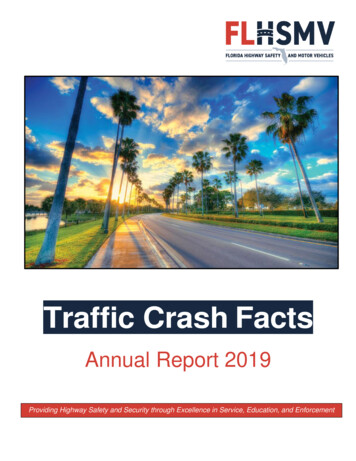
Section 1: – Highlights and Historical TrendsTraffic Crashes in Arizona by YearChart 1 – 1Chart 1 – 2Total CrashesFatal 0162013201420152016Chart 1 – 3Chart 1 – 4Injury CrashesProperty Damage Only age 5 – 2016 Arizona Crash Facts Summary2013201420152016
Section 1: – Highlights and Historical TrendsTable 1 – 6Victims of Motor Vehicle CrashesPersons KilledPersons InjuredAge 55-6465-7475 & 5Table 1 – 7Fatalities by Person Type 2012-2016YearDriversPassengersPedestrians 19331952TOTAL2,3929648021354,293Table 1 – 8Young drivers (age 15-24) killed in crashes 2012-2016YearAge of 5067706553441Page 6 – 2016 Arizona Crash Facts Summary
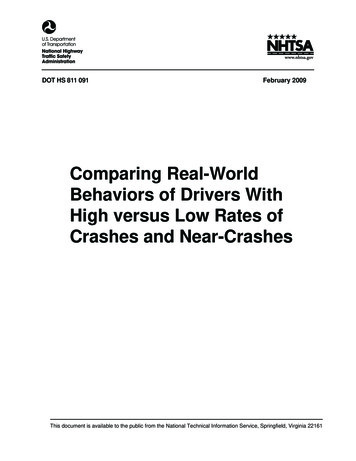
Section 1: – Highlights and Historical TrendsChart 1 – 5Chart 1 – 6Vehicle Miles TraveledArizona Fatality Rate vs. Injury Rate86.5165,60666,0008665,0452.10In 20132014201520161.10762012201320142015Fatal Rate2016Injury RateSource: ADOT – Multimodal Planning DivisionChart 1 – 7Chart 1 – 8Traffic Fatalities by Geographic RegionTraffic Injuries by Geographic 00041,79242940,91443440,397750Number of InjuriesNumber of 4Urban Fatalities20152016Rural FatalitiesPage 7 – 2016 Arizona Crash Facts SummaryUrban Injuries20152016Rural Injuries
Section 1: – Highlights and Historical TrendsTable 1 – 9Holiday Crash StatisticsHolidays such as Memorial Day, Labor Day, and Thanksgiving are regarded as three or four day weekend holidays for statisticalpurposes. Holidays such as Christmas, New Year’s Day, and the Fourth of July are celebrated on specific dates; which make theholiday period range from two to five days in length.Holiday fatality statistics are based on fatal crashes occurring from 6:00 p.m. on the last working day prior to the holiday through 5:59a.m. the day following the holiday period. Example: Thanksgiving fatalities are counted from Wednesday evening at 6:00 p.m.through 5:59 a.m. of the following Monday.Beginning at6:00 p.m.Ending at5:59 11/28/2016FridayTuesday12/23/201612/27/2016Fatal Crashesby YearNew Year’sDayMemorialDayJuly 4th201214751520133915201437201571020166713Persons KilledNew Year’sDayMemorialDayJuly 4th2012148618201341016201438201571120166715Number of DaysNew Year’sDayMemorialDayJuly 4th20124424201354520142442015542016442016 HolidaysNew Year’s DayMemorial DayJuly 4thLabor DayThanksgiving DayChristmas DayAlcohol Related Alcohol RelatedFatal CrashesFatalitiesNumberof 4511115544611Christmas DayTotal114568111477414742111010452711448Christmas DayTotal114618141539618852111016661811653Christmas DayTotal55244522545524445426445425Labor Day ThanksgivingLabor Day ThanksgivingLabor Day ThanksgivingPage 8 – 2016 Arizona Crash Facts Summary
Section 2Total Crashes126,987100.00%Geographic 33981.38%IncapacitatingInjuries3,400PropertyDamage 41.85%23,64818.62%PropertyDamage Only16,25568.74%Page 9 – 2016 Arizona Crash Facts SummaryIncapacitatingInjuries1,17011.07%
Section 2: – Geographic LocationFatal Crashes in Arizona (856) accounted for 0.67% of all crashes, Injury Crashes(38,616) accounted for 30.41%, and Property Damage Only (PDO) Crashes (87,515)accounted for 68.92%.Table 2 – 1Crash Severity by First Harmful Event StatewideNumber of CrashesFirst Harmful Event TypeNumber of ,507Collision with Pedestrian1,4291851,207371851,299Collision with Pedalcyclist1,380291,251100301,286Collision with 75,242125264,70412624Vehicle Fire or Explosion3361632918Other 140126,98785638,61687,51595256,753Collision with Motor Vehicle in TransportCollision with Fixed ObjectCollision with Non-fixed Object*UnknownTOTAL*Includes Collision with Parked Vehicles, Trains, Railway Vehicles, and Work Zone Equipment**Includes Vehicle Immersion, Jackknife, and Cargo Loss or ShiftTable 2 – 2Crashes by CountyCountyNumber of CrashesNumber of seCoconinoGilaGrahamGreenleeLa PazMaricopaMohaveNavajoPimaPinalSanta 921,241TOTAL126,98785638,61687,51595256,753Page 10 – 2016 Arizona Crash Facts Summary
Section 2: – Geographic LocationTable 2 – 3Crash Severity by First Harmful Event in Urban AreasFirst Harmful Event TypeNumber of CrashesNumber of ,58756,13821136,2909513667623941838Collision with Pedestrian1,2961481,114341481,199Collision with sion with Fixed Object8,605762,5016,028853,019Collision with Non-fixed Object*4,10454123,6875464Vehicle Fire or Explosion1030010300Other 03,33948931,59071,26051846,181Collision with Motor Vehicle in TransportOverturningCollision with AnimalUnknownTOTAL*Includes Collision with Parked Vehicles, Trains, Railway Vehicles, and Work Zone Equipment**Includes Vehicle Immersion, Jackknife, and Cargo Loss or ShiftTable 2 – 4Crash Severity by First Harmful Event in Rural AreasFirst Harmful Event TypeNumber of CrashesNumber of 0229,1981616,5091,917961,1226991091,669Collision with Pedestrian1333793337100Collision with Pedalcyclist14191122010115Collision with Animal1,86711621,7041203Collision with Fixed Object4,458831,3273,048911,728Collision with Non-fixed Object*1,13871141,0177160Vehicle Fire or Explosion2331622618Other 483677,02616,25543410,572Collision with Motor Vehicle in TransportOverturningTOTAL*Includes Collision with Parked Vehicles, Trains, Railway Vehicles, and Work Zone Equipment**Includes Vehicle Immersion, Jackknife, and Cargo Loss or ShiftWhile Urban Crashes in Arizona (103,339) accounted for 81.38% of all crashes, theyaccounted for 57.13% of all Fatal Crashes (489) occurring in 2016.While Rural Crashes in Arizona (23,648) accounted for 18.62% of all crashes, theyaccounted for 42.87% of all Fatal Crashes (367) occurring in 2016.Page 11 – 2016 Arizona Crash Facts Summary
Section 2: – Geographic LocationTable 2 – 5Analysis by JurisdictionCOUNTIESCitiesNumber of CrashesTotalFatal Injury PDONo. of PersonsAlcohol RelatedKilled Injured Crashes Killed InjuredApache CountyEagarSt. Cochise CountyBensonBisbeeDouglasHuachuca CitySierra 051028Coconino 3031761836400101160390171108Gila 9265240086037529301100434000004293006038Graham reenlee 011325441301400112002Page 12 – 2016 Arizona Crash Facts Summary
Section 2: – Geographic LocationTable 2 – 5Analysis by JurisdictionCOUNTIESCitiesLa Paz CountyParkerQuartziteTOTALNumber of CrashesTotalFatal Injury PDO3833046459121215Maricopa CountyAvondaleBuckeyeCave CreekChandlerEl MirageGila BendGilbertGlendaleGoodyearMesaParadise WickenburgYoungtownGuadalupeLitchfield ParkQueen CreekFountain 5481,0477,5202
Page 2 - 2016 Arizona Crash Facts Summary Table 1 - 1 Arizona Crash Facts Summary and Comparison . Arizona at a Glance - 2016 Approximately 2.61 persons were killed each day. One person was killed every 9.21 hours. There were 155.38 persons injured every day.