Transcription
2016CRASH FACTSA L A B A M A D E PA R T M E N TO F T R A N S P O R TAT I O N
L E T T E R FR O M TH ETransportation DirectorProviding a safe transportation system is key to the mission of the AlabamaDepartment of Transportation. Analyzing data about crashes is an importantpart of how ALDOT personnel identify specific opportunities for improving thesafety of our transportation system. We then use innovative engineeringtechniques, perform routine maintenance, and manage funding in a fiscallyresponsible and priority-based manner to create safer roads.As you review the data in the 2016 Crash Facts book, I challenge you toconsider your personal commitment to safety and the things you can do to helpreduce the number of crashes in Alabama. Always follow speed limits; drivesober; buckle up; share the road with motorcycles, bicycles and pedestrians;obey railroad crossing signals; avoid any and all forms of distracted driving; andlead by example by teaching young people safe driving habits.Wearing a seat belt and making sure that everybody in the vehicle is wearing aseat belt is the single most important safety habit you can adopt. You will seeon page 22 of 2016 Crash Facts that ALMOST 60 PERCENT OFPEOPLE WHO DIED IN CRASHES WERE NOT WEARING ASEAT BELT. Statistics clearly show seat belts and using proper safetyrestraints save lives. Violators of Alabama’s restraint laws may be fined andassessed points on their driver licenses. Simply put, there are plenty of goodreasons to buckle up.I hope you will look further into 2016 Crash Facts to find even more importantinsights into making our roads safe.Drive Safe Alabama!John R. CooperTransportation Director22016 Crash FactsAlabama Department of Transportation
2016 CRAS H FACTSTable of 035374447Quick FactsTen-Year Crash DataFatality Rate TrendsTypes of CrashesTime DataInvolvement by Age and GenderCrash LocationIDK Teen Driver Quiz CampaignCrash EnvironmentHoliday Crash StatisticsType of RoadwayAlcohol and Drug InvolvementIntersection Crashes by CountyNon-Intersection Crashes by CountyThe DriverMotorcycle Crash StatisticsSafety Restraint UsageBicycle Crash StatisticsPedestrian Crash StatisticsTrain Involved Crash StatisticsWork Zone Crash StatisticsTruck Crash StatisticsFatalities by CountyTraffic Crashes by CountyComparative County StatisticsComparative City StatisticsTransforming Alabama's Safety CultureMedia Contact InformationData for this report is provided by the Center forAdvanced Public Safety at The University of Alabama.DriveSafeAlabama.org3
2016 Cra sh DataQuick Facts2016 CRASH DATA2016 VS. 2015There were 1,089 people killed in 994 fatal crashes.All Crashes155,907 Increased 5.73%Injuries47,653 Increased 8.25%A traffic crash was reported every 3 minutes and22 seconds.994 Increased 25.98%A person was injured in a traffic crash every 11minutes and 2 seconds.1,089 Increased 28.27%Speeding is the leading cause of fatal crashes.Registered Vehiclesin Alabama5,504,068 Decreased 0.51%For fatal crashes where a restraint was available foruse, almost 60 percent of fatalities were unrestrained.Licensed Driversin Alabama3,947,628 Increased 0.89%69,610,272,000 Increased 1.62%Most Alabama crashes (78 percent) occurred in urbanareas, but most fatalities (60 percent) occurred inrural areas.Fatal CrashesFatalitiesVehicle Miles Traveledin AlabamaOf all fatal crashes, 9 percent were caused by drivers19 or under, and 22 percent were caused by driversunder 25 years of age.For each fatality, there were over 43 injuries.Based on 2016 data, typical drivers in Alabamahave greater than a onein three chance ofinvolvement in an injury or fatal crashoperating a vehicle over their lifetimes.Of all fatal crashes, over 50 percent occurred at night(including dusk and dawn).The pedestrian death toll was 122.There were 114 fatalities involving motorcycle ormoped riders.Bicyclists accounted for 4 fatalities.The probabilityof individuals being ina crash of any severity during their lifetimes isgreater than 98% .42016 Crash FactsThere were 9 fatalities with train involvement.For front seat occupants who are in vehicle crashes,the probability of being killed is 57 times higher forthose not wearing safety belts than those who areproperly restrained.Alabama Department of Transportation
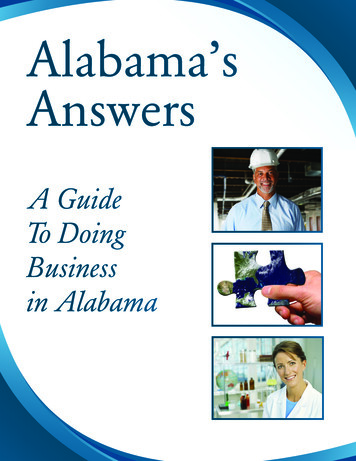
Ten Year CRASH DATA 2 0 07-201 6CRASHES UP 15.23%FATALITIES DOWN 1.89%I N THOUSANDS OF C RASHES06080 2016201520142013201220112010200920082007 1 00 120 14 0 160 2016201520142013201220112010200920082007 40 42 44 46 48 50 2016201520142013201220112010200920082007 3.2 3.4 3.6 3.8 4.0 2016201520142013201220112010200920082007 12 1000 1100 1200 14 2.0 I N M I L L I O NS O F V E H I C L E S2 . 5 3 .03.54 .0 2016201520142013201220112010200920082007ECONOMIC LOSS UP 44.85% 900 MOTOR VEHICLE REGISTRATIONS UP 6.88% I N B IL L IONS OF DOLLA R S06810 I N FATAL I T I E S P E R 10 0 M I L L I O N V E H I C L E M I L E S00.751.01. 2 51. 51 D DRIVERS UP 6.72% MILEAGE DEATH RATE DOWN 13.81% I N MIL L IONS OF DR IV ER S02.62.83.0 2016201520142013201220112010200920082007INJURIES UP 20.03%I N THOUSANDS OF IN J U R IES0 28 3 0 3 2 3 4 3 6 3 8I N NU M B E R O F FATAL I T I E S0600700800 4.5 5 .0 5.5 6 .0 VEHICLE MILES TRAVELED UP 13.54%16 18 20 22 I N B I L L I O NS O F M I L E S T RAV E L E D030354045 2016201520142013201220112010200920082007 50 5565 70 The increase/decrease percentage of change includes the entire time frame represented.DriveSafeAlabama.org5
Fatality Rate T R E NDSC RASH TOTALS AN D RAT E S FO R TH E PAST F IV E Y E A R SY EARTOTAL TOTA L TOTA LALABAM A FATAL I TY NAT I O NAL FATAL I TYCRASHES IN J U R IESFATA LIT I E S RAT E (P E R H M V M * ) RAT E (P E R H M V M * )2012128,307 40,20220132014 870 1.34126,862 133,219 2015147,452 44,0202016155,907 47,653 1.1437,559 852 39,518 821 1.31 1.101.24 1.08 849 1089 1.24 1.131.56 1.15***Hundred Million Vehicle Miles** NHTSA estimate for the first 9 months of 2016. The official 2016 rate has not yet been released.FATALITY RAT E : STAT E V E R SU S N ATIO N A L ALABAM A N AT I O NAL2.0%1.5%1.0%0.5%0.0%Y EAR201262 01 32016 Crash Facts2 014Alabama Department of Transportation2 0152 016
Types O F CRASH E SFIRST HARM F U L E V E NT (OR DERE D BY FATA LIT IE S)E V ENTTOTA L% O FNO N-FATALFATAL I T I E SC RASHESTOTAL C RAS H E S I NJ U R I E SHit Other Vehicle111,982 71.8% 32,222 456Hit Fixed Object or Other Object17,504 11.2% 6,794 349641 0.4% 538 67*Hit PedestrianOverturning1,720 1.1% 1,180 50Hit Parked Vehicle7,680 4.9% 375 9Hit Bicyclist183 0.1% 150 2Hit Railway Train61 0.0% 39 6Hit Animal2,665 1.7% 313 3355 0.2% 98 6Other Non-CollisionAll OtherTOTAL13,116 8.4% 4,157 141155,907 100% 45,886 1,089*Includes only those pedestrian events in the First Harmful Event; for more details, see pedestrian crashstatistics on page 25.VEHICLE TY P ETYPEV EHIC LES% OFIN VOLVED VEHIC LESPassenger Car152,686 52.7%Pick-up and SUV110,670 38.2%Van11,159 3.9%Truck9,623 3.3%Motorcycle/Moped1,867 0.6%Other3,712 1.3%TOTAL289,717 100%0 10 % 20% 30% 40% 50% 60% H AZARDOUS CA R G OCARGO TYPEC RASHESGas/Flammable142 65.7%Corrosive42 19.5%Explosive8 3.7%Radioactive0 0.0%Other24 11.1%TOTAL216 100%DriveSafeAlabama.org7
Time DATAT IM E OF DAY CRASHES FATA LIT IESH OUR B EGINS AT:Midnight1,89334 1.2%3.1%1:00 AM1,59929 1.0%2.8%2:00 AM1,50829 1.0%2.7%3:00 AM1,27731 0.8%2.8%4:00 AM1,38939 0.9%3.6%5:00 AM2,29944 1.5%4.0%6:00 AM3,72238 2.4%3.5%7:00 AM9,54059 6.1%5.4%8:00 AM6,84432 4.4%2.9%9:00 AM5,97425 3.8%2.3%10:00 AM7,00732 4.5%2.9%11:00 AM8,42046 5.4%4.2%Noon10,27443 6.6%3.9%1:00 PM10,02548 6.4%4.4%2:00 PM11,06552 7.1%4.8%3:00 PM14,22558 9.1%5.3%4:00 PM13,39258 8.6%5.3%5:00 PM14,30552 9.2%4.8%6:00 PM9,32560 6.0%5.5%7:00 PM6,10163 3.9%5.8%8:00 PM5,30660 3.4%5.5%9:00 PM4,33350 2.8%4.6%10:00 PM3,29553 2.1%4.9%11:00 PM2,51245 1.6%4.1%Unknown2777 0.2%0.6%TOTAL155,9071,08980 2016 Crash Facts1% 2% 3% 4% 5% 6% 7% 8% 9% Alabama Department of Transportation1 0%
M ONTH OF Y E A R CRASHES FATA LIT IESJanuary12,10774 7.8%6.8%February12,53275 8.0%6.9%March13,74194 8.8%8.6%April13,29168 8.5%6.2%May12,788101 8.2%9.3%June12,180103 7.8%9.5%July12,46983 8.0%7.6%August13,82294 8.9%8.6%September12,877102 8.3%9.4%October13,613114 8.7%10.5%November12,90086 8.3%7.9%December13,58795 8.7%8.7%TOTAL155,9071,08902% 4% 6% 8% 10 % DAY OF WE E K CRASHES FATA LIT IES15,029 9.6%Sunday174 16.0%Monday22,702129 14.6%12.2%Tuesday23,500150 15.1%13.8%Wednesday22,742118 14.6%10.8%Thursday24,417152 15.7%14.0%Friday27,649169 17.7%15.5%Saturday19,868197 12.7%18.1%TOTAL155,9071,0890 2 % 4 % 6% 8 % 10 % 12 % 14 % 16 % 18 % 2 0 % THE MOSTCRASH-PRONE PERIODOF THE DAY IS3pm-6pm.THE MOSTCRASH-PRONE DAYOF THE WEEK ISFriday.MOST CRASHESWITH FATALITIESOCCUR ONSaturday.DriveSafeAlabama.org9
INVOLVEME N T BYAge and GenderPERCENTAGE CAU SA L DR I V E R S * IN VO LV E D INALL TRAFF I C CRASH E S BY AG E A N D G E N D E R M AL E F E M AL E10%9%8%7%6%5%4%3%2%1%0%AG E 0-14 15-19 20-24 25-29 30-34 35-39 40-44 45-49 50-54 55-59 60-64 65-69 70-74 75-79 80-84 84-89 90 * The Causal Driver is the driver of the vehicle that was determined to have caused the traffic crash. Crashes for all vehicle typesare included. Each crash has only one causal driver.FATALITIES BY AG EAGEFATAL ITIE S(Y 12TOTAL0 20 40 60 80 10 0 12 0 1,089102016 Crash FactsAlabama Department of Transportation
D R IVERS IN VO LV E D* I N A L LC RASH ES A N D FATA L CRASH E SBY AGED R IV E R S IN VO LV E D * IN A L LC RAS H E S A N D FATA L C RAS H ESBY G E N D E RAG EG E ND E R83 119 3Male1,929,052 142,388 1066 29,259 120Female2,045,576 128,019 36520-24327,633 37,869 140Unknown25-29344,923 31,092 162TOTAL30-34314,454 26,133 16435-39304,705 23,268 12940-44293,645 20,624 12245-49317,944 19,757 12950-54330,367 19,300 11855-59339,786 17,989 100 7311,485 6970-74208,039 7,532 37 74353,513 9,420 61TOTAL0 21,357 353,974,628 289,717 1,462*Involved drivers include both causal and victim drivers.19,310 31289,717 1,46244%7%49%U N KN O WN14,513 G E N D E R O F D R IV E R S IN VO LVED I NGenderof DriversFATAL C RASH E S Involved in Fatal Crashes25%2%UN KNO WN 275,808MA L E313,42765-6903,974,628G E N D E R O F D R IV E R S IN VO LVED I NA L L C RAS H E SM ALE60-64UnknownFATAL CRASHES250,301F EMA L E15-19L I C E N S E DALL CRASHESF EM ALE 15L ICENS EDALL CRASHESFATAL CRASHES73%DriveSafeAlabama.org11
C RASHLocationRU RAL VS. U R BA N T RA F F I C FATA L ITIE S 1 0 Y E A R DATAY EARTOTALR U RA LU R BA N20071,110 751 3592008964 647 3172009848 526 3222010862 514 3482011899 542 3572012870 495 3752013852 521 3312014821 510 3112015849 508 34120161,089 660 4290200 400 600 800 10 0 012 0 0 RU RAL LOCAL E1 4 00 C RAS H LO CATIO NLOCAL E TYPE C RASHESLO CAT I O NC RAS H ESOpen Country28,250 83.60%On Roadway123,241 79.05%Residential2,997 8.87%Off Roadway21,224 13.61%Business2,153 6.37%Intersection2,922 1.87%School/Playground158 0.47%Median1,679 1.08%Industrial156 0.46%Private Property5 0.00%Other39 0.12%DrivewayUnknown39 0.12%Other33,792 100%TOTALTOTAL15 0.01%6,821 4.38%155,907 100%UR BAN LOCAL ECAU SA L D R IV E R ’S R E S ID E N CELOCAL E TYPE C RASHESR E S I D E N C E WI T H I N 2 5 M I L E SBusiness72,176 59.10%Yes68.68%Residential29,357 24.04%No18.32%Open CountryUnknown13.00%14,054 11.51%Industrial2,342 1.92%School/Playground2,638 2.16%Other1,528 1.25%20 0.02%122,115 100%UnknownTOTALMOST CRASHES OCCURwithin 25miles of home.122016 Crash FactsThe number of RURALfatalities increased 29.92% from2015 to 2016 and decreased 12.12% from 2007 to 2016.The number of URBANfatalities increased 25.81% from2015 to 2016 and increased 19.50% from 2007 to 2016.Alabama Department of Transportation
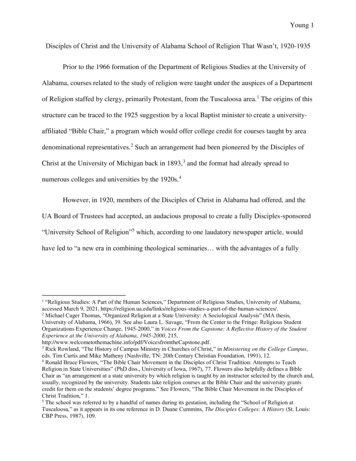
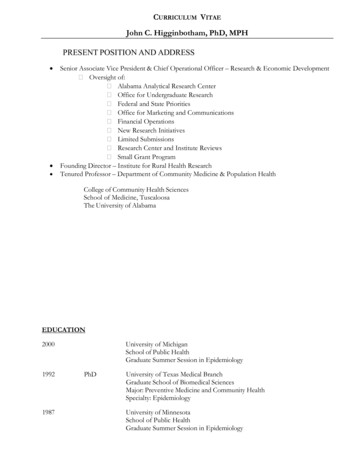
IDK TEEN DR I V E R Q U I ZCampaignTo reach a tech-savvy teen audience, theAlabama Department of Transportationdeveloped a teen-focused educational quizthat was served to the 15-19 year-olddemographic through animated Instagramand Facebook ads.The goal of the initiative was to increaseawareness of safe driving habits amongteens and encourage engagement with theDrive Safe Alabama website by leveragingthe appeal of a quiz game through socialmedia.A custom theme and logo/brand wasdeveloped to appeal to the target audience.The objective was to influence betterbehavior behind the wheel by engaging asmany teens as possible with clever copyand graphics to take the quiz and learnabout safe driving habits.Over 1,900 participants completed the quizin the five week campaign push, with a1.62% click through rate (higher than theindustry average).Instagram AdIDK Teen Driver CampaignFacebook AdIDK Teen Driver CampaignDriveSafeAlabama.org QuizIDK Teen Driver CampaignDriveSafeAlabama.org13
C RASHEnvironmentT RAFFIC CO N T R O LR OA D CO N D ITIO NCONTROL TYPECO N D I T I O NNo Control PresentNo Passing ZoneStop SignTraffic SignalRailroad DeviceC RASHESFATAL I T I E SC RAS H E SFATALIT IE S75,64648.52% 56451.79%Dry122,75578.74% 95787.88%11,9727.68% 30027.55%Wet21,27713.65% 11010.10%13,4218.61% 877.99%Icy/Slushy1740.11% 10.09%35,70022.90% 555.05%Muddy650.04% 00.00%1600.10% 70.64%Other/Unknown3,4522.21% 10.09%TOTALOther3,6472.34% 544.96%Not Stated11,9097.64% 211.93%155,907100% 1,089100%Yield SignTOTALLIGH T CONDI T I O NCONDITIONC RASHESFATAL I T I E S11,6367.46% 211.93%155,907100% 1,089100%W E ATH E RCO N D I T I O NC RAS H E SFATALIT IE SClear111,72571.66% 81775.02%Cloudy26,32516.89% 18617.08%Rain16,45410.55% 746.80%Day112,81372.36% 54149.68%Snow/Sleet2580.17% 10.09%Dark14,4929.30% 34331.50%Fog5890.38% 80.73%StreetlightsOther5560.36% 320,99113.46% 16014.69%Dusk4,3392.78% 211.93%Dawn1,7971.15% 181.65%Other/Unknown1,4750.95% 60.55%155,907100% 1,089100%TOTAL155,907100%Curve on Hill8,2155.27% 17616.16%Downgrade13,4768.64% 12511.48%Level Curve7,5454.84% 13011.94%10,5386.76% 938.54%1,4020.90% 363.31%TOTAL11,5977.44% 181.65%155,907100% 1,089100%%43%8%5%3% 2%29.19% 27825.53%15,1309.70% 746.80%Five5,1133.28% 191.74%Three7,2264.63% 121.10%One3,0251.94% 10.09%Not Stated12,1647.80% 211.93%155,907100% 1,089100%TOTAL142016 Crash Facts7%2% 1% 1% 0%Alabama Department of TransportationNOTSTATED45,509Six or moreONEFour26%THREE62.81%FIVE684SIX ORMORE FOUR43.45%TWO67,740FiveNot StateFatalities Per Number of LanesC RASHESFATAL I T I E STwoFourSixFATALITIES PER NUMBER OF LANESNU M BER OF LA N E SLANESThree10ONE46.92%FIVE511THREE Other/UnknownTwoFOURSIX ORMORENOTSTATED66.15%Hillcrest or SagOneC RASHESFATAL I T I E S103,134Upgrade100%29%TWOLevel 1,089CRASHES PER NUMBER OF LANESROAD CU RVAT U R E AN D G RAD ECURVE/GRADE0.28%All Crashes Per Number of LanesTOTAL63%
Holiday CRASH STAT I ST I CS2015 VS. 2 016H OL IDAYYEA R FATA LIT IESP ER IOD0 2 4 6 8 10 12 14 16 6 pm, Tues., December 30, 2014 until 6 pm, Fri., December 30, 2015 until 6 pm, Fri., May 22, 2015 until 6 pm, Fri., May 27, 2016 until 6 pm, Fri., July 3, 2015 until 6 pm, Fri., July 1, 2016 until 6 pm, Fri., September 4, 2015 until 6 pm, Fri., September 2, 2016 until 6 pm, Wed., November 25, 2015 until 6 pm, Wed., November 23, 2016 until 6 pm, Thur., December 24, 2015 until 6 pm, Fri., December 23, 2016 until New Year2015 8 11:59 pm, Sun., January 3, 2015 (84 hrs)2016 12 11:59 pm, Sat., January 2, 2016 (78 hrs)Memorial Day 2015 8 11:59 pm, Mon., May 25, 2015 (78 hrs)2016 10 11:59 pm, Mon., May 30, 2016 (78 hrs)July4th2015 6 11:59 pm, Sun., July 5, 2015 (54 hrs)2016 13 11:59 pm, Mon., July 4, 2016 (78 hrs)Labor Day2015 10 11:59 pm, Mon., September 7, 2015 (78 hrs)2016 7 11:59 pm, Mon., September 5, 2016 (78 hrs)Thanksgiving 2015 9 11:59 pm, Sun., November 29, 2015 (102 hrs)2016 17 11:59 pm, Sun., November 27, 2016 (102 hrs)Christmas2015 10 11:59 pm, Sun., December 27, 2015 (84 hrs)2016 14 11:59 pm, Mon., December 26, 2016 (78 hrs)*Note that the hours for each holiday period may vary from one year to the other.See table above for hours for each holiday period.DriveSafeAlabama.org1518
TYPE OFRoadwayTOTAL FOR STAT E CRASHES FATA LIT IESInterstate16,203140 10.4%12.9%U.S. Route21,188199 13.6%18.3%State Route27,667301 17.7%27.6%County21,188293 13.6%26.9%City63,744149 40.9%13.7%Other5,9177 3.8%0.6%TOTAL155,9071,0890 10 20 30 40 50607080901 0050607080901 0050607080901 00 RU RAL ARE AS CRASHES FATA LIT IESInterstate6,29185 18.6%12.9%U.S. Route5,031116 14.9%17.6%State Route7,425199 22.0%30.2%County14,824256 43.9%38.8%City1842 0.5%0.3%Other372 0.1%0.3%TOTAL33,7926600 10 20 30 40 UR BAN ARE AS CRASHES FATA LIT IESInterstate9,9128.1%5512.8%U.S. Route16,157 13.2%8219.1%State Route20,242 16.6%10324.0%County6,364 5.2%378.6%City63,560 52.0%14734.3%Other5,880 4.8%51.2%TOTAL122,115429160 2016 Crash Facts10 20 30 40 Alabama Department of Transportation
Alcohol and Drug I N VO LV E M E N TC ITED DRIV E R S I N F LU E N CE D BY A LCO H O L O R D R U G SAGEAL L* MA LEF EMA LEU N KN OWN0-141 1 0 015-19273 217 56 020-24890 701 187 225-29976 721 253 230-34820 593 223 435-39664 479 185 040-44500 348 151 145-49502 366 135 150-54461 323 138 055-59362 274 88 060-64217 161 56 065-69123 96 27 070-7437 31 6 075-over24 14 10 0Unknown139 51 4 84TOTAL5,989 4,376 1,519 94010 0 200300 400 500600 70 0 8 00 9 00 *All crash causal drivers who were cited for DUI.D UI CRASHE S BY T I M E25%20%15%10%5%0%MIDNIGHT 1 A M 23456789101112 P M1234567891011D UI CRASHE S BY DAY25%27.19%15%13.60%than 1 percent ofcrashes end in a fatality . However, for10% 6.58%DUI crashes, the probability is much greater.18.42% 18.42%20%8.77%7.02%5%The proportion of fatality0%SUNMO NOn average, lessT U ESW EDT HU RFRISATcrashesinvolving DUI (3.85 percent) is 7.6 timesthat of crashes in general (0.51percent), as reported in 2016.DriveSafeAlabama.org17
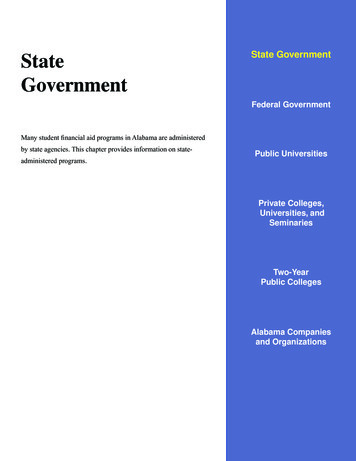
Intersection CRASH E S BY CO U N TY86,644TOTAL INTERSECTION-RELATED 08DALE811 470COFFEE324261PIKE248 DWIN2016 Crash 9570CHOCTAWCLAY LHOUN989SHELBY148CHEROKEE2,288 231ETOWAHJEFFERSONGREENE5971,588ST. 0WALKERLAMARJACKSONCULLMANWINSTON196MADISON657 8,238COLBERTAlabama Department of TransportationHENRY103HOUSTON1,795ALABAMA COUNTY REGION KEYNNNNorth RegionWest Central RegionEast Central RegionNNSoutheast RegionSouthwest Region
Non-Intersection CRAS H E S BY CO U N TYTOTAL NON-INTERSECTION-RELATED CRASHES69,263LAUDERDALE875LIMESTONEMADISON934 LKER786114 156PICKENS1,385BLOUNTCALHOUN1,062 SCAMBIA500LEE2,78550390BARBOUR340294627DALE479 497COFFEECOVINGTONRUSSELL1,335BULLOCKPIKE459 Y RANDOLPH123 183TALLAPOOSACOOSACHILTON656HALE203CHEROKEE1,107 300ETOWAHST. ,856ALABAMA COUNTY REGION KEYNNNNorth RegionWest Central RegionNNSoutheast RegionSouthwest RegionEast Central RegionDriveSafeAlabama.org19
THEDriverD R IVER CO N T R I B U T I N G CI R CU M STA N C E SW IT H PERCENTAGE OF FATAL C RAS H ES TO A LL C RAS H E SCI R CUMSTANCEA LLFATAL0 0. 5 %C RASHES C RAS H E S Speeding7,229 153Driving Under the Influence4,368 123Failed to Yield Right of Way23,329 80Ran off Road3,412 84Improper Lane Change/Use11,975 58785 32Wrong Side of RoadUnseen Object/Person/Vehicle10,698 40Fatigued/Asleep2,681 36Failure to Heed Sign/Signal/Officer5,815 42Swerved to Avoid Vehicle/Object7,310 44Misjudged Stopping Distance14,578 3Tailgating22,756 8309 340,662 288155,907 994Driver Not in ControlAll OtherTOTAL1% 1. 5 % 2% 2.5% 3% 3.5% 4% 4 .5% There may be multiple contributing circumstances in each crash. The table above shows the primary cause determined by theofficer reporting the crash.202016 Crash FactsAlabama Department of Transportation5%
Motorcycle CRASH STAT ISTICST EN YEAR DATAY EARMOTOR CYC LISTSINVOLVED20072,032 1,426 8420082,106 1,495 9820091,647 1,205 7720101,729 1,319 8620111,925 1,438 9720121,912 1,477 92IN J U R IESFATAL I T I E S20131,583 1,173 7620141,650 1,251 6420151,601 1,254 7420161,828 1,297 1140 500 1,0 0 0 1, 5 0 0 2 ,0 0 0 2,500 M OTORCYC L E CAU S E D CRASH E SBY DRIVER AG E I NC LUDES MOTORSCOOT ERS A ND M OPEDSAGECRASHES IN J U R IESFATAL I T I E S0-1410 4 015-19121 50 320-24224 129 1125-29173 111 1030-34154 92 1435-39107 66 840-44112 84 845-49135 103 850-54151 92 455-59116 82 460-6495 58 265-6958 28 270-7438 19 075-over31 11 1UnknownTOTAL64 5 01,589 934 75The numbers above will be different from the previous tablebecause this table reflects crashes CAUSED by motorcycles, notall crashes involving motorcycles.DriveSafeAlabama.org21
Safety Restraint U SAG ESA FETY RE ST RAI NT U SAG ERESTRAINT USEDSEV ER ITYD R IVERKILLED Wearing Lap andINJURED Shoulder BeltsNO HARM SUBTOTAL KILLED Wearing LapINJURED Belt OnlyNO HARM SUBTOTAL KILLED Wearing ShoulderINJURED Belt OnlyNO HARM SUBTOTAL KILLED NoneINJURED UsedNO HARM SUBTOTAL KILLED INJURED NO HARM SUBTOTAL 10,034UnknownF R O NT S E ATPASS E NG E R0.10% 27,15011.34%212,13688.57%239,52057810.68% 64788.63% 730100% 40.56% 7510.47% 63788.97% 716100% 3276.02% 2,68449.41% 2,42144.57% 5,432100%400.40%1,59115.86%8,40383.75%100%234BAC K S E ATPASS E NG E RTOTALS 3250.11%35,46211.81%490.11% 6,35214.72% 1,96011.19% 36,75285.17% 15,51988.57% 264,407 88.08%100% 43,153100% 17,521100% 300,194100%0.68% 10.00% 10.14% 70.40%4716.67% 11615.83% 24113.73%24483.33% 61684.04% 1,50785.87%292100% 733100% 1,755100%10.87% 00.00% 50.55%2118.26% 1012.66% 10611.65%9380.87% 6987.34% 79987.80%115100% 79100% 910100%725.35% 423.61% 4415.55%74255.17% 48141.39% 3,90749.21%53139.48% 63954.99% 3,59145.23% 1,345100% 1,162100% 7,939100% 151.12% 40.56% 590.49% 36727.45% 19226.74% 2,15017.78% 95571.43% 52272.70% 9,88081.73% 1,337100% 718100% 12,089100%420.24%*Seat belt use for non-fatal injured passengers may be over-estimated because reporting officers have no way to make a directobservation. Additionally, 59 fatalities had unknown restraint use.PE RCENTAGE O F O CCU PAN TS IN VO LV E D IN C RAS H E S PROPER RESTRAIN T0% N O/ IMP R OP ER R EST RAI NT1 0%2 0% 3 0% 40% 50% 60% 70 % 80% 90% KilledInjuredNo HarmUsageAccording to the crash reports, overall only 3.4percent of people involved incrashes were not using safety restraints ; however almost 60 percent ofall fatalities were not restrained .In contrast, 97.8percent of people involved in crashes but not harmed werereported to have been wearing their seat belts .222016 Crash FactsAlabama Department of Transportation1 00%
C HILD RESTRA I NT U SAG E (UND ER 6 YEA RS OLD)RESTRAINT USEDSEV ER ITYF R ON T SEATPASSEN G ERBAC K S E ATPASS E NG E R 6927.62% 7147.65%8,38492.30% 8,60392.27%9,083100% 9,324100%20.10% 20.09%2039.97% 23910.51%1,83189.93% 2,03289.40%100% 2,2731001.41% 31.74%5236.62% 6336.63%8861.97% 10661.63%100% 172100%0.00% 00.00% 5
4 2016 Crash Facts Alabama Department of Transportation There were 1,089 people killed in 994 fatal crashes. A traffic crash was reported every 3 minutes and 22 seconds. A person was injured in a traffic crash every 11 minutes and 2 seconds. Speeding is the leading cause of fatal crashes. For fatal crashes where a restraint was available for