Transcription
DOT HS 811 091February 2009Comparing Real-WorldBehaviors of Drivers WithHigh versus Low Rates ofCrashes and Near-CrashesThis document is available to the public from the National Technical Information Service, Springfield, Virginia 22161
DISCLAIMERThis publication is distributed by the U.S. Department of Transportation, NationalHighway Traffic Safety Administration, in the interest of information exchange.The opinions, findings, and conclusions expressed in this publication are those ofthe authors and not necessarily those of the Department of Transportation or theNational Highway Traffic Safety Administration. The United States Governmentassumes no liability for its contents or use thereof. If trade names, manufacturers’names, or specific products are mentioned, it is because they are consideredessential to the object of the publication and should not be construed as anendorsement. The United States Government does not endorse products ormanufacturers.
Technical Report Documentation Page1. Report No.DOT HS 811 0912. Government Accession No.4. Title and SubtitleComparing Real-World Behaviors of Drivers With High versus LowRates of Crashes and Near-Crashes7. AuthorsKlauer, S. G., Dingus, T. A., Neale, V. L., Sudweeks, J. D., andRamsey, D. J.9. Performing Organization Name and AddressVirginia Tech Transportation Institute3500 Transportation Research Plaza (0536)Blacksburg, Virginia 2406112. Sponsoring Agency Name and AddressOffice of Human-Vehicle Performance ResearchHuman Factors/Engineering Integration Division (NVS-331)National Highway Traffic Safety Administration1200 New Jersey Avenue SE., W46-424Washington, DC 2059015. Supplementary Notes3. Recipient’s Catalog No.5. Report DateFebruary 20096. Performing Organization Code8. Performing Organization Report No.10. Work Unit No. (TRAIS)11. Contract or Grant No.DTNH22-00-C-07007 Task Order 2313. Type of Report and Period CoveredFinal Letter Report14. Sponsoring Agency CodeNHTSA NPO-11316. AbstractIn-depth analyses were conducted examining both quantitative and qualitative differences between drivers whowere involved in a high number of crashes and near-crashes (mean of 1,438.1 per MVMT) versus drivers whowere involved in far fewer crashes and near-crashes (mean of 195.4 per MVMT). These two groups of driverswere labeled as safe and unsafe, respectively.Primary findings indicated that unsafe drivers exhibited more hard deceleration, acceleration, and swervemaneuvers during baseline driving than did the safe drivers. Results also indicated that risky driving behaviorssuch as traveling at inappropriate speeds and improper braking may increase drivers’ relative crash risk above thatof normal driving. Exploratory analyses were also conducted to assess engagement in risky driving behaviorduring a variety of environmental and roadway conditions. The results from this analysis indicated that all driverswere willing to engage in risky behaviors during moderately high traffic densities when their speed was impededthan during very low traffic densities when speed selection was not impeded. The results from analyses withquestionnaire data also indicated that seven questionnaire/survey/performance-based tests demonstrated that safedrivers could be differentiated from the unsafe drivers. These types of tests have never been compared to actualcrash/near-crash involvement prior to these analyses. The results presented in this report are the first to evaluategeneral driving behavior in relation to the driver’s actual crash/near-crash involvement during one year of driving.The results point to a variety of driving behaviors that are associated with higher crash risk. This is importantinformation as it supports the development of driver monitoring systems for teens or older drivers in that itprovides further evidence that specific kinematic and driver behaviors can potentially be monitored, and iffeedback reduced these behaviors, those drivers would lower their risk of being involved in crashes or near-crash.17. Key Words100-Car, Naturalistic, Fatigue, Intelligent VehicleInitiative, Driver Behavior, Human Factors, Eyes offForward Roadway19. Security Classif.20. Security Classif.(of this report)(of this page)UnclassifiedUnclassified18. Distribution StatementThis document is available to the public through theNational Technical Information Service, Springfield, VA2216121. No. of Pages22. Price204Form DOT F 1700.7 (8-72)i
EXECUTIVE SUMMARYIndividual variability among drivers has long been an interest in transportation research andindustry. The National Highway Traffic Safety Administration crash rate statistics have longcited wide variability in crash involvement based upon driver age, gender, geographic locations,and other factors (NHTSA Traffic Safety Facts, 2002). Younger and older drivers are generallyover-represented in crashes than are middle-aged drivers. Licensed male drivers tend to be over represented in crashes as compared to licensed female drivers. Also, urban areas generally havehigher crash rates than do rural areas. Given that over 40,000 people die on U.S. highways eachyear, these high-risk categories of drivers are of particular interest to government andtransportation safety professionals.Risky driving behaviors (speeding, tailgating, etc.) have also been well-researched in thetransportation community (Boyce & Geller, 2002; Evans & Wasielewski, 1984). Previousstudies have used a variety of methods to assess both risky driving habits and crash involvement.Some of these methods include traffic observation techniques, Department of Motor Vehiclerecords, self-reported crashes or traffic violations, and driving performance in a simulator, testtrack, or instrumented vehicle. There are several limitations with this type of research. Neithercrash involvement nor engaging in risky driving behavior is accurately reported by drivers.Participants’ ability to remember or assess the frequency of these behaviors over periods of timeis not a reliable estimate of either crash involvement or risky driving behavior engagement.Drivers may either be too embarrassed or fear their insurance rates will go up if they admit tobeing in minor collisions. Drivers also may not assess their driving habits as particularly risky ifthey have not been involved in any crashes.The 100-Car Naturalistic Driving Study (Dingus et al., 2006) database provides a uniqueopportunity to compare those drivers who were excessively involved in crashes/near-crasheswith those drivers who were not involved in any type of traffic conflict. The drivers in the 100 Car Study demonstrated high variability in driving performance and crash involvement. Itshould be noted that a crash in the 100-Car Study was operationally defined as any physicalcontact with a vehicle, object, or pedestrian, which also included high-g tire strikes (hitting acurb while traveling over 35 mph). The results indicated that 7 percent of the drivers were notinvolved in any crashes, near-crashes, or incidents, while the worst 7 percent of drivers wereinvolved in at least three crashes or minor collisions within a 12-month data collection period.Four research objectives were analyzed in this report.Objective One: (1) Determine the differences in demographic data, test battery results,and performance-based measures between safe and unsafe drivers. (2) Analyze the crashrate involvement and violations prior to the study for safe and unsafe drivers, noting thatdrivers may not be honest in reporting their driving history information.Drivers were categorized into the “safe” and “unsafe” categories as well as safe, moderately safe,and unsafe categories based on their crash/near-crash involvement rates per mile traveled. Theresults of these analyses indicated that seven of the scores from the survey, questionnaire, andperformance-based tests demonstrated that unsafe and safe drivers could be differentiated.ii
Driver age and experience were significant in that unsafe drivers tended to be younger and haveless driving experience than safe drivers. Two of the subscales from the Dula DangerousDriving Inventory (Dula & Ballard, 2003) demonstrated statistical differences when the driverswere divided into three levels of crash/near-crash involvement. Only one of the NEO FiveFactor Inventory Scales demonstrated statistical differences between drivers with differingcrash/near-crash involvement.A regression analysis was conducted to determine if any of the tests with significant results couldbe used to predict driver involvement in crashes and near-crashes. The results indicated that bothyears of driving experience and the NEO-FFI Agreeableness subscale demonstrated somepredictive abilities when considering involvement in crashes and near-crashes. The results alsosuggest that there is a slight inverse relationship: as a driver’s experience or Agreeableness scoreincreases, the probability of involvement in high numbers of crashes and near-crashes decreases.This regression equation did not demonstrate a strong relationship, and some caution is urged ifusing these scales to predict high involvement in crashes and near-crashes.Objective Two: Determine the relationship between various risky driving behaviors andthe presence of environmental conditions among the safe, moderately safe, and unsafedrivers.Using a modified version of the Virginia State Police accident report Form 16, groups of riskydriving behaviors were recorded for each event. The results of this analysis indicated that hardbraking, driving inattention, and driving in close proximity to other vehicles were the three mostprevalent types of risky behavior among drivers. Other risky driving behaviors were analyzed,but demonstrated low frequency of occurrence; therefore, it was decided to focus this report ononly the top three risky driving behaviors.Unsafe and moderately safe drivers engaged in all three risky driving behaviors far morefrequently than the safe drivers, both in general and during differing environmental conditions.Safe drivers engaged in risky behaviors during moderate traffic flows relative to otherconditions; however, the frequency was still lower relative to the unsafe and moderately safedriver groups.Seat belt use was observed, on average, for 79 percent of all drivers, which is similar to thenational average (Glassbrenner, 2005). However, the results showed a 10-percent decrease inseat belt compliance for the unsafe drivers (mean age of 27) relative to the safe drivers (whowere significantly older with a mean age of 39); this is most likely an artifact of age.Objective Three: Analyze potential patterns in the driving performance-based measuresamong the safe, moderately safe, and unsafe drivers.This analysis is the first investigating driving performance differences between those drivers whoare excessively involved in crashes/near-crashes and those drivers who were rarely, if ever,involved in crashes during a year of data collection. Crash/near-crash involvement and normaldriving were both collected over the same period. The results of this analysis indicate that duringbaseline driving, unsafe drivers turned their vehicles at greater than 0.30 g, decelerated greateriii
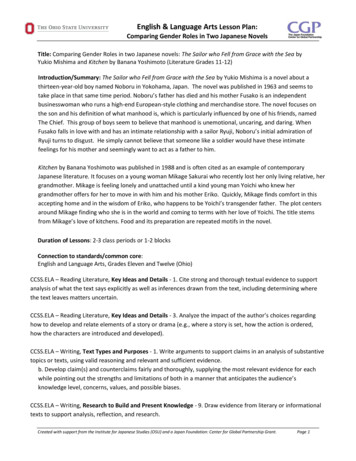
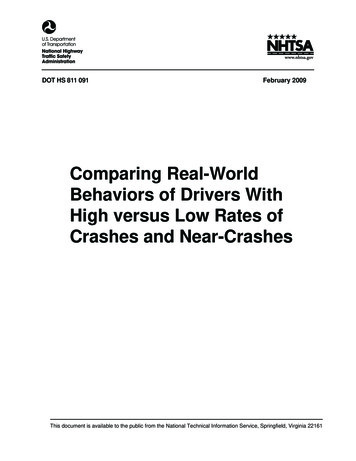
than 0.30 g, and swerved greater than 3 ft/s significantly more frequently than either themoderately safe or safe drivers. These behaviors are potentially leading to the unsafe drivers’increased rates of crash and near-crash involvement.Objective Four: Analyze drivers’ involvement in crashes, near-crashes, and incidents andthe drivers’ behaviors that contributed to their involvement.The above results suggest that risky driving behaviors such as improper braking andinappropriate speeds increase drivers’ relative crash risk above that of normal driving. Whilerelative risk calculations were not conducted, the high frequency of occurrence in associationwith crashes and near-crashes and the low frequency of occurrence during baseline epochs wouldindicate that these relative crash risks are higher than for normal driving. This corroboratesresults found in Klauer, Sudweeks, Hickman, and Neale (2006).The results investigating the presence of multiple risky behaviors indicated that engagement inmultiple risky behaviors is present for both crashes and near-crashes, whereas only one or tworisky behaviors are present for incidents, and zero or one risky behavior for baselines. Given thatthe number of risky behaviors present for baseline epochs is vastly different from crashes andnear-crashes, engaging in multiple risky behaviors may increase crash risk.Seat belt use results for events and baseline epochs indicated an increasing trend with eventseverity, in that observed seat belt use was approximately 50 percent for crashes and increasedup to 78 percent for baseline epochs (Figure 1). This may be due to the fact that younger driverseat belt compliance is generally lower than for older adults, and that younger drivers wereexcessively involved in crashes and near-crashes by a factor of four for some age groups.Unfortunately, it also means that the drivers who are at highest risk of crash involvement are alsothe drivers least likely to be wearing seat belts.iv
Percent of Total Crashes, Near-Crashes, andIncidents9080706050403020100CrashNear CrashIncidentBaselineEvent SeverityFigure 1. Percentage of Drivers Wearing Seat Belts for Event Severitiesv
GLOSSARY OF TERMS AND ACRONYMSANOVA – Analysis of VarianceAdditional Driver – Family or friends of the primary driver who drove the subject’s vehicle andwere not involved with the in-processing.Associative Factor – Any environmental or vehicular factor where direct causation to crashes,near-crashes, or incidents is not possible to attain but correlation may be determined.At-Fault – If a behavior is observed by the subject or the driver of another vehicle thatcontributes to the occurrence of an event, that driver is deemed to be at-fault. If both drivers areobserved exhibiting behaviors that contribute to the occurrence of the event, then the event isdeemed to have partial fault among the drivers involved.Backing Crash – A crash that occurs while the driver’s vehicle is in reverse gear.Chase Vehicle – Vehicle designated for locating (through GPS or other means) anddownloading data from subject vehicles.Contributing Factor – Any circumstance that leads up to or affects the outcome of the event.This term encompasses driver proficiency, willful behavior, roadway infrastructure, distraction,vehicle contributing factors, and visual obstructions.Crash – Any contact with an object, either moving or fixed, at any speed in which kinetic energyis measurably transferred or dissipated. Includes other vehicles, roadside barriers, miscellaneousobjects on or off of the roadway, pedestrians, cyclists, or animals.Crash-Relevant Event – Any circumstance that requires a crash avoidance response on the partof the subject vehicle, any other vehicle, pedestrian, cyclist, or animal that is less severe than arapid evasive maneuver (as defined above), but greater in severity than a “normal maneuver” toavoid a crash. A crash avoidance response can include braking, steering, accelerating, or anycombination of control inputs. A “normal maneuver” for the subject vehicle is defined as acontrol input that falls outside of the 95 percent confidence limit for control input as measuredfor the same subject. Note that crash-relevant conflicts and proximity conflicts were combined toform “incidents” as used in this report.Conflict Type – All crashes, near-crashes, crash-relevant conflicts, and proximity conflicts werecategorized based on the initial conflict that led to the crash that occurred or would haveoccurred in the case of near-crashes and incidents (crash-relevant conflicts and proximityconflicts were combined to form incidents, as used in this report). There were 20 types ofconflicts used that are as follows: conflict with lead vehicle, following vehicle, oncoming traffic,vehicle in adjacent lane, merging vehicle, vehicle turning across subject vehicle path (samedirection), vehicle turning across subject vehicle path (opposite direction), vehicle turning intosubject vehicle path (same direction), vehicle turning into subject vehicle path (oppositedirection), vehicle moving across subject vehicle path (through intersection), parked vehicle,vi
pedestrian, pedalcyclist, animal, obstacle/object in roadway, single-vehicle conflict, other, noknown conflict, unknown conflict. This list was primarily made up of National AutomotiveSampling System: General Estimates System (NASS GES) Accident Types.DAS – Data Acquisition SystemData Reduction – Process used by which trained Virginia Tech Transportation Institute (VTTI)employees reviewed segments of driving video and recorded a taxonomy of variables thatprovided information regarding the sequence of events leading up to the crash, near-crash,incident, environmental variables, roadway variables, and driver behavior variables.Driver Impairment – The driver’s behavior, judgment or driving ability is altered or hindered.Includes fatigue, use of drugs or alcohol, illness, lack of or incorrect use of medication, ordisability.Driver Proficiency – Whether the individual’s driving skills, abilities, or knowledge areinadequate. This specifically refers to whether the driver appeared to be aware of specific trafficlaws (i.e., no U-turn), whether the driver was not competent enough to safely perform a drivingmaneuver (i.e., check for traffic before pulling out on a roadway), was unaware of the vehicle’sturning radius, or performed driving maneuvers under the incorrect assumption that it was safe,(i.e., drives over a concrete median).Driver-Related Inattention to the Forward Roadway – Inattention due to a necessary andacceptable driving task where the subject is required to shift attention away from the forwardroadway (e.g., checking blind spots, center mirror, or instrument panel).Driver Reaction – The evasive maneuver performed in response to the precipitating event.Driver Seat Belt Use – Variable indicating if the subject is wearing a seat belt during an event.EDR – Electronic Data RecorderEpoch – Typically, a 90-second period of time around one or more triggers in the data; caninclude one or more events.Events – a term referring to all crashes, near-crashes, and incidents. The “event” begins at theonset of the precipitating factor and ends after the evasive maneuver.Event Nature – Classification of the type of conflict occurring in the event (e.g., conflict withlead vehicle, conflict with vehicle in adjacent lane).Event Severity – Classification of the level of harm or damage resulting from an event. The fivelevels were crash, near-crash, crash-relevant, proximity, non-conflict.FARS – Fatality Analysis Reporting Systemvii
FOV – Field of ViewFV – Following VehicleGPS – Global Positioning System – used by data reductionists to locate participant vehicle forinformation on an event.Improper Braking – The subject brakes suddenly or in an improper manner that could put thesubject or other vehicles at risk (late braking, hard braking).Inattention Event – Any event where fatigue, driver-related inattention to the forward roadway,driver secondary tasks, or non-specific eyeglance away from the forward roadway wereidentified as contributing factors to the event.Incident – Encompasses the event severities of crash-relevant conflicts and proximity-conflicts.IVI – Intelligent Vehicle InitiativeIR LEDs – Infrared Light-Emitting DiodesInvalid Trigger – Any instance where a pre-specified signature in the driving performance datastream is observed but no safety-relevant event is present.LV – Lead VehicleMVMT – Million Vehicle Miles TraveledNHTSA – National Highway Traffic Safety AdministrationNaturalistic – Unobtrusive observation; observation of behavior taking place in its naturalsetting.Near-Crash – Any circumstance that requires a rapid, evasive maneuver by the subject vehicle,or any other vehicle, pedestrian, cyclist, or animal in order to avoid a crash. A rapid, evasivemaneuver is defined as steering, braking, or accelerating, or any combination of control inputsthat approaches the limits of the vehicle capabilities.Non-Conflict – Any incident that increases the level of risk associated with driving, but does notresult in a crash, near-crash, or incident as defined above. Examples include driver control errorwithout proximal hazards being present, driver judgment error such as unsafe tailgating orexcessive speed, or cases in which drivers are visually distracted to an unsafe level.Non-Subject Conflict – Any incident that gets captured on video (crash-relevant, near-crash, orcrash) that does not involve the subject driver. Labeled as a non-subject conflict but datareduction was not completed.viii
Onset of Conflict – Sync number designated to identify the beginning of a conflict; also knownas the beginning of the precipitating factor.ORD – Observer Rating of Drowsiness; measured on a scale from 0 to 100 in increasing severityof drowsiness. Based on Wierwille and Ellsworth, 1994.Precipitating Factor – The driver behavior or state of the environment that initiated the crash,near-crash, or incident and the subsequent sequence of actions that result in an incident, nearcrash, or crash.Primary Driver –The recruited participant designated as the main the driver of his/her ownvehicle or the leased vehicleProximity Event – Any circumstance resulting in extraordinarily close proximity of the subjectvehicle to any other vehicle, pedestrian, cyclist, animal, or fixed object where, due to apparentunawareness on the part of the drivers, pedestrians, cyclists or animals, there is no avoidancemaneuver or response. Extraordinarily close proximity is defined as a case where the absence ofan avoidance maneuver or response is inappropriate for the driving circumstances (includingspeed, sight distance, etc.). Note that crash-relevant conflicts and proximity conflicts werecombined to form “incidents” as used in this report.Pre-Incident Maneuver – The maneuver that the driver was performing immediately prior to anevent.Precipitating Factor –The action of a driver that begins the chain of events leading up to acrash, near-crash, or incident. For example, for a rear-end striking collision, the precipitatingfactor most likely would be “lead vehicle begins braking” or “lead vehicle brake lightsilluminate.”Secondary Task – Task, unrelated to driving, which requires drivers to divert attention from thedriving task (e.g., talking on a cell phone, talking to passengers, eating, etc.).Rear-End Striking – Refers to the subject vehicle striking a lead vehicle.Rear-End Struck - Refers to the subject vehicle being struck by a following vehicle.Risky Driving Behavior - When a driver engages in any one or multiple behaviors listed in the“driver behavior” variable, the driver is said to be engaging in risky driving. These behaviors arelisted in the Data Reduction Variable list in Appendix C.Sideswipe – Refers to either a vehicle in the adjacent lane changing lanes into the subject vehicleor the subject vehicle changing lanes into a vehicle in the adjacent lane.SUV – Sport Utility VehicleSV – Subject Vehicleix
Trigger/Trigger Criteria – A signature in the data stream that, when exceeded, results in 90 s ofvideo and corresponding driving performance data being copied and saved to a database (60 sprior and 30 s after the data exceedance). Trained data reductionists assess these segments ofvideo and driving performance data to determine whether or not this segment of data contains asafety-relevant conflict (i.e., crash, near-crash, or incident). Examples of triggers include adriver braking at 0.76 g longitudinal deceleration or swerving around an obstacle with 0.8 glateral acceleration.U.S. DOT – United States Department of TransportationValid Event or Valid Trigger – Those events where a specific signature in the data stream wasidentified, viewed by a data reductionist, and deemed to contain a safety-relevant conflict. Datareductionists record all relevant variables and store this data in the 100-Car Database.Vehicle Run-Off-Road – Describes a situation where the subject vehicle departs the roadway.VDOT – Virginia Department of TransportationVirginia Tech Fleet Services – An extension of the Virginia Tech Office of Transportation.VTTI – Virginia Tech Transportation InstituteVisual Obstruction – This variable refers to glare, weather, or an object obstructing the view ofthe driver that influences the event in any way.Willful Behavior – The driver knowingly and purposefully drives in an unsafe or inappropriatemanner. Willful behavior includes: aggressive driving, purposeful violation of traffic laws, anduse of vehicle for improper purposes (e.g., intimidation).Yaw Rate – The data collected by the data acquisition system gyro indicating rate of rotationaround the vertical axis.x
TABLE OF CONTENTSExecutive Summary. iiiGlossary of Terms and Acronyms.viTABLE OF CONTENTS . .ixList of Figures . xiiiList of Tables.xvChapter 1: Introduction and Method .1BACKGROUND .1METHOD .2Instrumentation .2Subjects .5Vehicles.7PROCEDURE FOR DATA REDUCTION: 100-CAR STUDY EVENT DATABASE.7Sensitivity Analysis.7Recruiting and Training Data Reductionists .11Event Database Reduction Software Framework.11Baseline Database Framework .13Data Reduction Inter- and Intra-Rater Reliability for the 100-Car Study Event Database .15Baseline Database .17SURVEYS, QUESTIONNAIRES AND PERFORMANCE-BASED TESTS .17Chapter 2: Objective 1: Determine the Differences in Demographic Data, Test Battery Results, andPerformance-Based Measures Between Safe and Unsafe Drivers. Analyze the Crash Rate Involvement andViolations Prior to The Study for These Safe and Unsafe Drivers.19Data Used in This Analysis.19Assignment of Safety-Level for Drivers .20Analysis One: Analysis for the “Safe and Unsafe” Groups .21Demographic Data and Self-Reported Data Analyses .21Test Battery Analyses .25Performance-Based Test Analyses.32Analysis Two: Analysis of Variance (ANOVA) Statistical Tests for the Safe, Moderately Safe, and UnsafeDriver Groups .34Demographic Data and Self-Reported Data Analyses .34Test Battery Analyses .36Analysis Three: Correlation Analysis .39Analysis Four: Logistic Regression Using Significant Demographic, Test Battery, and Performance-BasedTes
crash/near-crash involvement prior to these analyses. The results presented in this report are the first to evaluate general driving behavior in relation to the driver's actual crash/near-crash involvement during one year of driving. The results point to a variety of driving behaviors that are associated with higher crash risk. This is important