Transcription
SPSS TutorialMelany MorrisonCOMP1001A 100605379Due: May 31, 2010SPSS tutorial-1
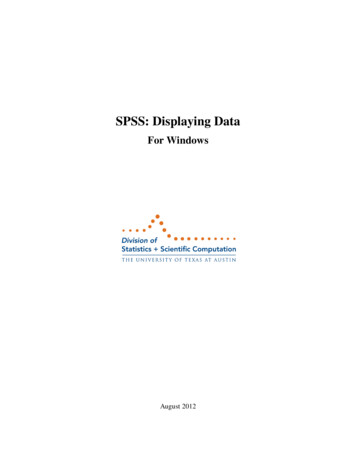
SPSS STATISTICAL SOFTWAREIf you have never used SPSS before, this tutorial will familiarize you with some of the basics ofgetting started and will then move into two more advanced techniques that will be useful foranalyzing data.Much like other Windows software, SPSS is a similar program with a user friendly interface andeasy to use toolbar to perform the most commonly used functions. Used in the world of statisticseither for beginner statisticians or for the more advanced users, SPSS can be used to perform anystatistical task by using the tools that are provided within the program.GETTING STARTEDOnce you have downloaded a version of SPSS, open the program by either clicking on the shortcuton your desktop or by locating the program in your start menu under programs. Once the programis loaded a screen will appear.Refer to Figure 1. Go to the file menu open data, this will allow you to open existing data thathas been pre-entered and saved into your program.FIGURE 1SPSS tutorial-2
Once the data has appeared in the data view spread sheet, you can alter the variable headings andtypes of variables you are using by clicking on the variable view tab at the bottom left hand cornerof the screen. This will change the spreadsheet view. Refer to Figure 2 and 3.FIGURE 2FIGURE 3SPSS tutorial-3
The data set that appears in Figure 2 is data from a psychological experiment looking at twodifferent experimental conditions, measuring the amount of time (seconds) it takes participantsfrom each group who are looking at a stereo dot diagram to fuse the image.In psychology experiments are done to support research hypothesis. Inorder to prove that a hypothesis is not occurring due to chance,researchers must collect data, enter it into the SPSS, explore and thenanalyze their results.Using the results from the fusion time experiment, we will first explore the data. The purpose ofexploring results first, before conducting any analysis, is to make sure the results meet therequirements for type of tests that will be used for the analysis. Psychologists use a number of tools,depending on the types of variables and type of experiment being conducted, to explore theirresults.EXPLORING THE RESULTSIn statistics, histograms, scatter plots, bar graphs etc. are used to explore the results of anexperiments to look for trends in the data, outliers (results that appear to be out of range comparedto the rest of the results), and to see if there is normalcy in the data. Let us look at how to constructa Histogram.STEP 1Refer to Figure 4. Using the opened data set “Fusion times” go to the graphs tabDrag the mouse over the legacy dialogue optionSlide down the menu and select Histogram FIGURE 4SPSS tutorial-4
FIGURE 5Once you have selected the histogram option, the histogram dialog box will appear,refer to Figure 5.STEP 2Refer to Figure 6. Highlight the fusion times for stereogram and click the arrow to moveit over to the variable box.Highlight the treatment group and click on the corresponding arrow to move it over tothe rows box.SPSS tutorial-5
Click OK .FIGURE 6FIGURE 7The histograms will appear in the output screen as shown in Figure 7.SPSS tutorial-6
STEP 3After you have created the histograms, double click on the charts to edit the chartThe edit chart dialogue box will appear as shown is Figure 8.You can then double click on any area of the chart editor (i.e the axis, the title, the bars)to bring up the properties box, refer to Figure 8 to make changes to any part of thehistograms.FIGURE 8In Figure 9 you can see that the colour of the bars has changed and the background iswhite.SPSS tutorial-7FIGURE 9
FIGURE 10ANALYSIS OF DATAAfter exploring the data, the research psychologist will want to conduct tests to see if the resultsobtained prove to be significant therefore supporting the research hypothesis.In SPSS there are a multitude of tests that can be conducted, depending on what statistic you withto analyze for example; mean, median etc.For the data on Fusion times, we will analyze the mean fusion time for each group. This means wewill have to conduct of test of the means. Let us try an independent samples t-test.STEP 1Select the Analyze in the tool bar.Scroll down to the compare means iconSelect independent samples t-test . Refer to Figure 10 to see what this step looks like.STEP 2Highlight the fusion time variable and click on the arrow key to move it to the testvariable box.Highlight the treatment group and click the arrow to move it to the groupingvariables box. Figure 11 shows what this should look like.SPSS tutorial-8
FIGURE 11STEP 3Next, you need to define the “group variables”Click on Define groups. Another dialogue box will pop up.Define group 1and group 2, refer to Figure 12 (In this experiment group 1 is the NVgroup, and group two is the VV group.)Label each group according to what the variable is calledClick Continue Then click OK The t-test results will take a few seconds to processThe results should then appear in your output screen then same way screen where yourhistograms were. Figure 13 is a good image to refer to. You can see the results from thet-test we conducted!FIGURE 12SPSS tutorial-9
FIGURE 13Most of the time in psychology, researchers do not leave their results in theSPSS program. They need to publish the findings should they findsomething significant. You can take the results and the importantdescriptive stats from SPSS and then create a table in Microsoft Wordand input the result for future publication.STEP 4This step is an aside.Below is a table created using the results from the independent samples t-test in SPSS.TreatmentGroupNVVVSPSS tutorial-10NMeanStd. Deviationt-testSig43358.565.558.094.081.940.56
BRINGING IT TOGETHERThis program is very useful for all types of research and analysis, it is user friendly and there is ahelp tool that can be used in cases where you are not sure about what step to complete next. Thereare also built into tutorials in the program that can get you to build sample charts and completesample tests.REFERENCEWebsite (n.d) SPSS, retrieved from www.mwp.spss.com, May 29, 2010SPSS tutorial-11
SPSS tutorial-2 SPSS STATISTICAL SOFTWARE If you have never used SPSS before, this tutorial will familiarize you with some of the basics of getting started and will then move into two more advanced techniques that will be useful for analyzing data. Much like other Windows software, SPSS is a similar program with a user friendly interface and