Transcription
Sensitivity analyses: a brief tutorial withR package pseChalom, A. †Mandai, C.Y. Prado, P.I. Version 0.3.1, November 23, 2013This document presents a brief practical tutorial about the use of sensitivityanalyses tools in the study of ecological models. To read about the underlyingtheory, please refer to our work in [1].We presume for this tutorial that you are already familiar with the R programingenvironment and with your chosen model. We will illustrate the techniques using asimple model of population growth.You should have installed R 1 along with an interface and text editor of yourliking, and the package “pse”. This package is based on the “sensitivity” package,and is designed to resemble its uses, so researchers who already use it will be ableto write code with the pse package easily. Major differences will be noted on thehelp pages and in this tutorial.This tutorial focuses on the parameter space exploration of deterministic models. For a discussion of stochastic models, see the ‘multiple’ vignette on the samepackage.1Input parametersThe first thing that must be done is to determine exactly what are the input parameters to your model. You should list which parameters should be investigated,what are the probability density functions (PDFs) from which the parameter valueswill be calculated, and what are the arguments to these PDFs.In the examples, we will use a simple model of logistical population growth, inwhich a population has an intrinsic rate of growth r, a carrying capacity of K and astarting population of X0 . In each time step, the population may grow or diminishafter the following expression:Xt 1 Xt rXt (1 Xt /K) (1)Theoretical Ecology Lab, LAGE at Dep. Ecologia, Instituto de Biociências, Universidade deSão Paulo, Rua do Matão travessa 14 nº 321, São Paulo, SP, CEP 05508-900, Brazil.†email: andrechalom@gmail.com1This tutorial was written and tested with R version 3.0.1, but it should work with newerversions1
We are interested in studying the effects of the parameters r, K and X0 on thefinal population. After researching on our databases, we have decided that, for ourspecies of interest, r and K follow a normal distribution with known parameters.However, we could not reliably determine what the initial population should be,so we have used an uniform distribution covering all the reasonable values. Thefollowing table summarizes rgumentsµ 1.7, σ 0.3µ 40, σ 1min 1, max 50We next translate this table to three R objects that will be used in the sensitivityanalyses, containing (1) the names of the parameters, (2) the probability densityfunctions, and (3) a list containing the lists with all the parameters to the densityfunctions: factors - c("r", "K", "X0") q - c("qnorm", "qnorm", "qunif") q.arg - list( list(mean 1.7, sd 0.3), list(mean 40, sd 1), list(min 1, max 50) )A fundamental question in this stage is to determine whether, inside the ascribed parameter ranges, every parameter combination is meaningful. See the nextexamples on this:Example 1:We would like to run a model for a species abundance distribution (SAD), andwe decided to examine the effect of N , the total number of individuals in thecommunity, and S, the total number of species. We can run the model with N 100and S 50 or with N 15 and S 3, so there is nothing wrong with these values.However, the combination N 15, S 50 is meaningless, as it would implythat there are more species than individuals. One solution to this problem is torun the models with the parameters modified as following: N is the total numberof individuals, and ŝ is the average number of individuals for each species. So,ŝ N S, and now every combination of N and ŝ is meaningful.Example 2:In a model of structured population growth, we have estimated independentlytwo parameters for each class: S, the probability that a given individual survivesand does not move into the next size class, and G, the probability that a givenindividual survives and grows into the next class. We can run the model withS 0.2 and G 0.7, or S 0.8 and G 0.1. However, if we try to run the modelwith S 0.8 and G 0.7, we arrive at the conclusion that, for every individual inthe original size class, in the next time step we will have 0.8 individuals in the sameclass and more 0.7 in the next, giving a total of 1.5 individuals! The problem isthat the sum of S and G must be smaller than 1. One way to solve this is to definenew parameters ŝ and ĝ such that ŝ is the survival probability, independently of the2
individual growing, and ĝ is the growth probability for each surviving individual.We can relate these parameters to the former ones, as G ŝ ĝ and S ŝ (1 ĝ).Note:When transforming parameters like done on the above examples, it is importantto remember that the new parameters may not have the same probability densityfunctions as the original ones.1.1Optional: More details about the quantilesThe quantile functions used can be any of the built-in quantile functions as qnormfor normal, qbinom for binomial, qpois for poison, qunif for uniform, etc; lesscommon distributions can be found on other packages, like the truncated normaldistribution on package “msm”. You can even define other quantile functions, giventhat their first argument is the probability, and that they are able to work on avector of probabilities. For example:The quantiles of an empirical data set can be used by creating a wrapper functionfor the quantile function: qdata - function(p, data) quantile(x data, probs p)A discrete uniform density function, usefull for parameters that must be integernumbers, can be given by qdunif -function(p, min, max) floor(qunif(p, min, max))2Your modelThe model that you wish to analyse must be formulated as an R function thatreceives a data.frame, in which every column represent a different parameter, andevery line represents a different combination of values for those parameters. Thefunction must return an array with the same number of elements as there were linesin the original data frame, and each entry in the array should correspond to theresult of running the model with the corresponding parameter combination. Wewill cover the case in which a model outputs more than a single number in section4.If your model is already written in R, and accepts a single combination of values,it is easy to write a “wrapper” using the function mapply to your model. In theexample below, the function oneRun receives three numbers, corresponding to r,K and X0 , and returns a single value corresponding to the final population. Thefunction modelRun encapsulates this function, in a manner to receive a data.framecontaining all parameter combinations and returning the results in one array.Make SURE that the order in which the parameters are defined above is thesame in which they are being passed to the function. oneRun - function (r, K, Xo) { X - Xo3
for (i in 0:20) { X - X r*X*(1-X/K) } return (X) } modelRun - function (my.data) { return(mapply(oneRun, my.data[,1], my.data[,2], my.data[,3])) }If your model is written in a different language, as C or Fortran, it is possible towrite an interface with R by compiling your model as a shared library, and dynamically loading this library [2]. Also, you should consider uncoupling the simulationand the analyses (see section 5).3Uncertainty and sensibility analysesWe first use the LHS function to generate a hypercube for your model. The mandatory arguments for this function are: model, the function that represents your model;factors, an array with the parameter names; N, the number of parameter combinations to be generated; q, the names of the PDF functions to generate the parametervalues; and q.arg, a list with the arguments of each pdf. We have already constructed suitable objects to pass to this function above, so now we simply call theLHS function: library(pse) myLHS - LHS(modelRun, factors, 200, q, q.arg, nboot 50)The extra parameter nboot is used to bootstrap the correlation coefficients (seebelow).To access the values of the parameters used in the model, use the functionget.data(myLHS). To access the results, use get.results(myLHS).With the object returned by the function LHS, we will exemplify in this sectionfour techniques that can be used: the uncertainty analysis using the ecdf, scatterplots of the correlation between each parameter and the result using the functionplotscatter, partial rank correlation using the function plotprcc and agreementbetween different hypercube sizes with the function sbma.4
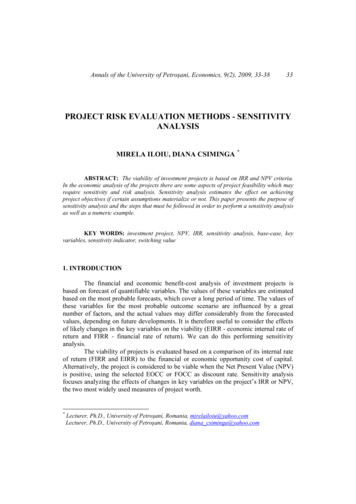
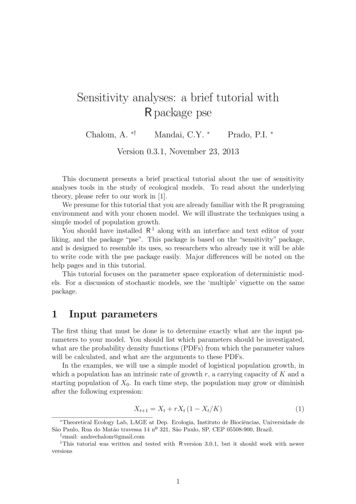
3.1ECDFThe ecdf, short for empirical cumulative distribution function, may be used toillustrate the distribution of the model results, in our case the final population.With this graph, we can see that the final population for our species is, with highprobability, between 35 and 45.0.60.40.20.0Proportion x0.81.0 plotecdf(myLHS)25303540O1n:200 m:054550
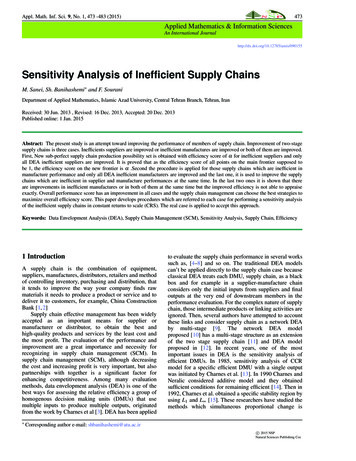
3.2ScatterplotsHere, we can see a scatterplot of the result as a function of each parameter. As allthe parameters are being changed for each run of the model, the scatterplots looklike they were randomly generated, even if the underlying model is deterministic.Actually, what scatterplots show is the distribution of values returned by the modelin the parameter space sampled by the hypercube and how sensible are these modelresponses to the variation of each parameter.Note that population sizes bifurcate above a given value of parameter r. Thisis a well known behaviour of many population models and will ultimately lead tochaotic solutions [4, O1404550 plotscatter(myLHS)37 38 39 40 41 42 43K0102030X064050
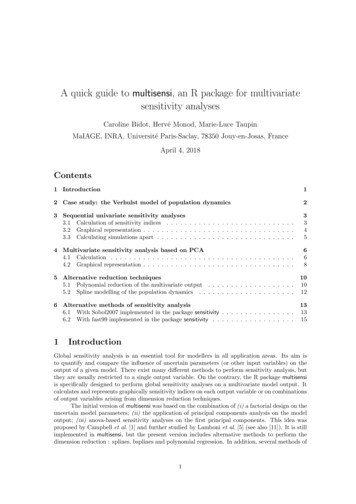
3.3Partial correlationThe partial (rank) correlation coefficient (pcc or prcc) measures how strong are thelinear associations between the result and each input parameter, after removing thelinear effect of the other parameters.The confidence intervals shown in this plot are generated by bootstraping. plotprcc(myLHS)0.0 1.0 0.5O10.51.0PRCCrKX0In the ecological literature, it is usual to refer to the partial derivatives of themodel response in respect to each parameter as “the sensitivity” of the model response in respect to each parameter. One analog measure in stochastic models isthe Partial Inclination Coefficient (pic) of the model response in respect to eachparameter. pic(myLHS, nboot 40)[[1]]Call:pic.default(X L, y r, nboot nboot, conf conf)Partial Inclination Coefficients (PIC):originalbias std. error min. c.i. max. c.i.7
r -1.90799288 0.128319193K1.07256615 0.034158670X0 -0.00668281 0.0032302363.41.6951612 -6.3230128 1.58100740.2028570 0.6415686 1.55684980.0172535 -0.0393534 0.0234695Agreement between runsIn order to decide whether our sample size was adequate or insufficient, we calculatethe Symmetric Blest Measure of Agreement (SBMA) between the PRCC coeffientsof two runs with different sample sizes. newLHS - LHS(modelRun, factors, 250, q, q.arg) (mySbma - sbma(myLHS, newLHS))[1] 0.375A value of -1 indicates complete disagreement between the runs, and a value of1 indicates total agreement. As the SBMA seldom reaches 1 for realistic models,some criterion must be used to indicate when the agreement should be consideredgood enough. More details about how the SBMA is calculated can be found on [1].It should be stressed that there is no “magical” number for deciding how closeto unity the SBMA should be. It is reasonable to expect agreements around 0.7 to0.9 in well-behaved models, but two cases require attention. If the total numberof factors is very low, the SBMA may converge slowly. Also, if none of the modelparameters happen to be monotonically correlated with the output, the agreementbetween runs may stay as low as 0.2 even for very large hypercubes.8
4Multiple response variablesIn the previous section, we have examined a model that returned a single number,namely, the final population. However, we might be interested in examining theeffects of the parameters in several distinct responses from the model. The responsesmay be (1) different variables, like “total population” and “species richness”, (2) thesame variable in different time points, or (3) the same variable calculated by differentmethods.In our example, we are interested in determining the effect of the parametersto the population in each of the first 6 time steps. The theory and tools for thisanalysis remain mostly the same. We will write our model to return an array now,as: factors - c("r", "K", "X0")q - c("qnorm", "qnorm", "qunif")q.arg - list( list(mean 1.7, sd 0.3), list(mean 40, sd 1),list(min 1, max 50) )Time - 6oneRun - function (r, K, Xo) {X - array();X[1] - Xo; # Caution, X1 gets overwrittenfor (i in 1:Time) {Xl - X[length(X)]X[i] - Xl r*Xl*(1-Xl/K)}return (X)}modelRun - function (dados) {mapply(oneRun, dados[,1], dados[,2], dados[,3])}The hypercube is generated exactly in the same way. We also have the optionto give names (which will be used in the plots below) to each response variable. res.names - paste("Time",1:Time) myLHS - LHS(modelRun, factors, 100, q, q.arg, res.names, nboot 50)9
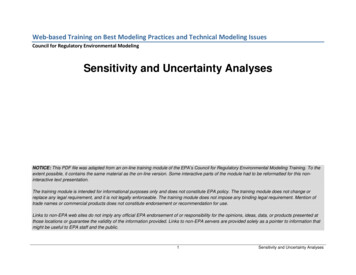
4.1ECDFThe first plot we will produce will, again, be the ECDF. We may produce severalplots using the parameter “stack FALSE”, or stack all the plots in the same graph,using “stack TRUE”:1.0 plotecdf(myLHS, stack TRUE)0.650.4Proportion x0.8460.00.22311020304050LHS resultsn:600 m:0We may notice that the population values are spread over a wider range in thefirst time steps, but converge to a narrow distribution on time 6.10
4.2ScatterplotsNext, we investigate the correlation plots for the variables with each input parameter. To reduce the number of plots, we will present results just for the time steps 1,3 and 6, using the “index.res” parameter, and supress the linear model from beingploted with the parameter 40414030203835Time 640Time Time 6Time 320103030404540K4035Time 11.5r40rTime 14030201.035Time 640Time 330302010Time 140 plotscatter(myLHS, index.res c(1,3,6), add.lm FALSE)01020304050X00102030X0114050
4.3Partial correlationThe partial correlation plots also accept the “index.res” argument: plotprcc(myLHS, index.res c(1,3,6))rKX01.00.5 1.0 0.50.0Time 60.5 1.0 0.50.0Time 30.50.0 0.5 1.0Time 1PRCC1.0PRCC1.0PRCCrKX012rKX0
4.4Agreement between runsWe have seen how the function sbma measures the agreement between two runsin the previous section. Now, we will use the function target.sbma to run severalhypercubes until a pair of runs provides us with an agreement equal to or betterthan a limit specified in its first argument. targetLHS - target.sbma (target 0.3, modelRun, factors, q, q.arg, res.names, FUN min)[1][1][1][1][1]"INFO: initial run.""INFO: LHS with N 105""sbma of -1 (target 0.3)""INFO: LHS with N 205""sbma of 0.375 (target 0.3)"As the SBMA is calculated for each response variable independently, we mustdecide how to combine these values. The argument “FUN min” is telling thefunction to consider only the minimum value, and may be ignored for models thatreturn a single response variable.5Uncoupling simulation and analysisIn many scenarios, it is necessary to run the simulation and the analyses at differenttimes, and even in different computers. It may be the case, for example, thatyour lab computer is not fast enough to run the simulations, but that the highperformance cluster in which the simulations are to be run does not have R installed.In order to do this, however, you must generate the Latin Hypercube in the labcomputer, transfer this information to the cluster, run the simulations there, transferthe results back to the lab computer, and then run the analyses.In order to generate the samples without running a model, use the function LHSwith the parameter model NULL and save the samples in the desired format: uncoupledLHS - LHS(model NULL, factors, 50, q, q.arg) write.csv(get.data(uncoupledLHS), file "mydata.csv")Then run the model using the data. To incorporate the results into the LHSobject, use the function tell: 2 coupledLHS - tell(uncoupledLHS, myresults)Then you may proceed with the analyses using prcc, ecdf, etc.2Please note that the tell method implemented in the sensitivity package alters its argument.This is not the case with the LHS tell method.13
References[1] A. Chalom and P.I.K.L. Prado, Parameter space exploration of ecological models,arXiv:1210.6278 [q-bio.QM], 2012.[2] C. Geyer, Calling C and Fortran from R, http://users.stat.umn.edu/ geyer/rc/[3] J.D. Murray, Mathematical Biology I: An Introduction, vol. 17 of Interdisciplinary Applied Mathematics, Springer, New York, NY, USA,2002.[4] R.M. May, Simple mathematical models with very complicated dynamics, Nature261: 459–466, 1976.14
Version 0.3.1, November 23, 2013 This document presents a brief practical tutorial about the use of sensitivity analyses tools in the study of ecological models. To read about the underlying theory, please refer to our work in [1]. We presume for this tutorial that you are already familiar with the R programing environment and with your chosen .