Transcription
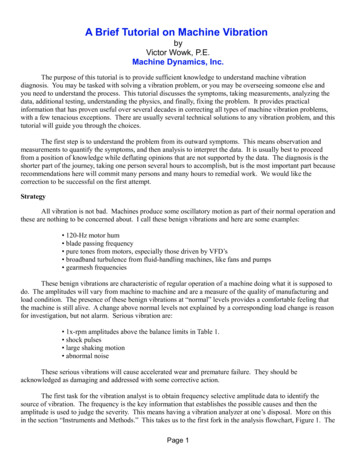
A Brief Tutorial on Machine VibrationbyVictor Wowk, P.E.Machine Dynamics, Inc.The purpose of this tutorial is to provide sufficient knowledge to understand machine vibrationdiagnosis. You may be tasked with solving a vibration problem, or you may be overseeing someone else andyou need to understand the process. This tutorial discusses the symptoms, taking measurements, analyzing thedata, additional testing, understanding the physics, and finally, fixing the problem. It provides practicalinformation that has proven useful over several decades in correcting all types of machine vibration problems,with a few tenacious exceptions. There are usually several technical solutions to any vibration problem, and thistutorial will guide you through the choices.The first step is to understand the problem from its outward symptoms. This means observation andmeasurements to quantify the symptoms, and then analysis to interpret the data. It is usually best to proceedfrom a position of knowledge while deflating opinions that are not supported by the data. The diagnosis is theshorter part of the journey, taking one person several hours to accomplish, but is the most important part becauserecommendations here will commit many persons and many hours to remedial work. We would like thecorrection to be successful on the first attempt.StrategyAll vibration is not bad. Machines produce some oscillatory motion as part of their normal operation andthese are nothing to be concerned about. I call these benign vibrations and here are some examples: 120-Hz motor hum blade passing frequency pure tones from motors, especially those driven by VFD’s broadband turbulence from fluid-handling machines, like fans and pumps gearmesh frequenciesThese benign vibrations are characteristic of regular operation of a machine doing what it is supposed todo. The amplitudes will vary from machine to machine and are a measure of the quality of manufacturing andload condition. The presence of these benign vibrations at “normal” levels provides a comfortable feeling thatthe machine is still alive. A change above normal levels not explained by a corresponding load change is reasonfor investigation, but not alarm. Serious vibration are: 1x-rpm amplitudes above the balance limits in Table 1. shock pulses large shaking motion abnormal noiseThese serious vibrations will cause accelerated wear and premature failure. They should beacknowledged as damaging and addressed with some corrective action.The first task for the vibration analyst is to obtain frequency selective amplitude data to identify thesource of vibration. The frequency is the key information that establishes the possible causes and then theamplitude is used to judge the severity. This means having a vibration analyzer at one’s disposal. More on thisin the section “Instruments and Methods.” This takes us to the first fork in the analysis flowchart, Figure 1. ThePage 1
appropriate question to ask when armed with the frequency and amplitude data is whether the vibration isbenign or serious. If it is benign, then we can safely ignore it. It may, however, cause concern for a sensitiveoccupant nearby by virtue of transmitting to that space and interfering with that process. An example is arooftop fan that shakes a delicate optical microscope below. In this case the fan may be O.K. but we need totreat the path of vibration. The corrective action to take for benign vibrations that are not bothering anyone is toexplain this to those concerned, and perhaps monitor this vibration for a time to verify that it is not trendingupward in amplitude.Figure 1. Vibration FlowchartIf the vibration is deemed to be serious, then this takes us to the second fork in the flowchart—forcedversus natural vibration. This requires additional testing; usually stopping the machine to do resonance testing, avisual inspection, cleaning if necessary, and runout measurements with a dial indicator. The reason fordetermining early whether the vibration is forced or natural is because the fixes are completely different. Forcedvibrations on machines are corrected by mass balancing, aligning, or changing the bad parts. Natural vibrationsare a structural effect, where some structure behaves like a mechanical amplifier that is frequency sensitive. Thesymptoms of natural vibrations, or resonance, are:1.2.3.4.The vibration is very bad, in other words, abnormally high amplitude.The vibration is strongly directional.The amplitude is not steady, but varies up and down.Rumbles during runup or coastdown as harmonics pass through the natural frequency.Once a resonance is suspected from the symptoms, then it needs to be verified with some additionaltests. These resonance tests are:Page 2
1.2.3.4.Impact testing of the major components to find their natural frequencies.Variable-speed shakerRunup or coastdownOperating deflection shapesThese tests require specialized equipment and methods to obtain valid results. For example, Tests 1 and2 are done with the machine stopped using an instrumented hammer or a electrodynamic shaker with a poweramplifier. Test 3 requires recording the data and Test 4 is done during normal operation taking amplitude, andperhaps phase, measurements along a grid pattern. The positive outcome of this is that during the testing acorrective fix usually becomes obvious. The five known fixes for resonance are:1.2.3.4.5.Change speedChange the natural frequency of the responding part with added mass or stiffness.Add dampingReduce the source vibration input.Dynamic absorberTable 1. Vibration LimitsVibration LimitsBalance ConditionDisplacement, milsPeak to Peakat 1x rpmOverall Velocityin/sec Peak10 - 1,000 HzOverall Acceleration, gPeak0 - 5,000 HzElectric Motors1,000 - 2,000 rpm2.00.20.5 2,000 rpm1.00.21.0Generators2.00.20.5Centrifugal Fans 600 rpm4.00.30.5600 -1,000 rpm3.00.31.01,000 – 2,000 rpm2.00.31.5 2,000 rpm1.00.32.0Vaneaxial ugalCompressors1.00.23.0Cooling TowerGearboxes3.00.42.0Reciprocating EnginesGas or 0Twin ScrewCompressors1.01.015.0Page 3
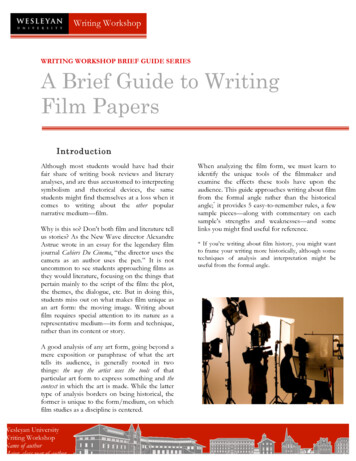
These fixes are very different from the balancing, alignment, or changing parts for forced vibrations, soit is important to identify this fork in the road before proceeding down the wrong path.What is AcceptableTable 1 is a general guide for acceptable vibration on many classes of common machines. This table wascompiled from industry standards, some published specifications, from manufacturers’ factory balance levels onnew equipment, and from field experience. These limits apply for measurements at, or as close as safelypossible to, the bearings. These guidelines are general in that they are economically achievable and vibrationbelow these levels will allow the machine to survive a normal life in service. These levels may need to bereduced for product-quality purposes, or for stealthiness in military applications. The levels may need to beallowed to float above these levels for flexible-mounting conditions, such as springs or elevated platforms.Higher levels may also need to be allowed when higher-vibration sources are nearby. An example is a dieselengine driving a gearbox and a high-speed pump, all on the same common skid base. The gearbox and pumpvibration may not meet their specified levels because of the thumping from the engine, but all three machinesmay be O.K. to operate as is.Instruments and methodsA vibration measuring instrument separates the frequencies and quantifies the amplitude, Figure 2. Itconverts the physical motion into an electrical signal that can be further processed and displayed along afrequency axis. It provides us with the “big picture” of vibration by identifying the specific causes with thefrequency and judging acceptability with the amplitude. There are three major categories of vibrationinstruments, each of which can use a velocity transducer or accelerometer as the sensor.Figure 2. An FFT SpectrumThe simplest, and least expensive, is an overall meter. It provides no frequency information, onlyoverall amplitudes, so it is useless for analysis. It is useful for trending or comparison measurements on similarmachines, but for diagnosing problems on machines it is best left turned off.Page 4
The other two major vibration instruments are tuneable filters and FFT (Fast Fourier Transform)analyzers. Analyzer is a misnomer because analysis is a human function. An electronic “analyzer” does noanalysis. It only measures and display electrical signals. The electrical signals from accelerometers and velocitytransducers are very small AC voltages, typically millivolts. Hence, the tuneable filters and FFT instruments arenothing more than fancy AC voltmeters with a frequency display axis. Vibration instruments have been grosslyoversold in the past two decades under the guise of computer intelligence. Any of these two major vibrationmeasuring instruments, from any manufacturer, can be used effectively to diagnose machine vibrations. Nospecific instrument or manufacturer has a unique connection to a higher intelligence. However, some are anorder of magnitude or two more complicated to use by design. The instrument in use is the least significantfactor in diagnosis. The instrument operator and the methods employed are the most significant.The fundamental method of using a vibration instrument is to conduct a survey of the entire machinesystem; driver, driven, and any intermediary machines such as gearboxes. The purpose of this survey is to mapout the entire system at least once so as not to overlook anything before diving into details. Calmly, andobjectively, gather the numbers in tabular form to be able to view it all in one image. Table 2 is a sample form.Table 2. Vibration Survey EHorizontalVerticalAxialDisplacementMils, peak-to-peakFiltered to 1xRPMOverall VelocityIn/sec, RMS10-1,000 HzOverall Accelerationg/ peak0 – 5,000 HzThe first column measures the balance condition. The second column measures vibration severity inaccordance with ANSI S2.41 in the low-frequency spectrum. The third column characterizes the shock pulsesfrom the bearings. The survey technique is to concentrate on obtaining valid measurements while at themachine, and not focusing immediately on any specific peak. Hand-held, or magnet-mounted, data isacceptable if care is taken in hand holding in a steady manner, perpendicular to the surface, with a constantpressure, and with a magnet to verify that it does not rock. Quality of data acquisition is important in this initialsurvey, rather than quantity. Analysis will come later after the complete picture is assembled.This initial survey allows us to determine quickly if the problem is in the motor or the pump, whether itis directional, the balance condition, the bearing condition, and some information about possible distortion fromthe velocity overall. The displacement and velocity numbers can be compared to national standards foracceptability, some of which are in Table 1. There are no standards for acceleration to determine bearingacceptability because the shock pulses must be tempered with size of bearing and speed of rotation, but therelative measurements allow us to quickly identify the worst and best bearings.Page 5
In addition to this tabulated data, listen to the bearings with a stethoscope and hand feel the vibration.Ten mils should feel like 10.0 mils. This protects us from “meterosis and digitosis,” diseases of the mind uniqueto vibration analysts. I, for one, do not trust any electronic instrument, but I will accept the numbers withcaution.Machines produce an abundance of vibration data coded in the vibration signal. Machine environmentsalso produce plenty of contaminating signals that corrupt the real data, at no extra charge. It is the analyst'sresponsibility to recognize contaminating signals as invalid data and reject them. Be suspicious of anything atexactly 60 Hz and its harmonics. It is probably electrical noise invading the measurement system. Intermittentelectrical connections produce signals similar to Figure 3. The time trace is not symmetrical about the zeroamplitude line. Normal physical vibration swings both positive and negative and spends an equal amount oftime above the zero axis line as below it. Thefrequency spectrum in Figure 3 is from anintermittent connection and has unusually highbroadband energy.Any time trace signal that has verysharp rise times is not real physical motion.Physical objects cannot jump from oneposition to another in microseconds. Sharprise times are probably intermittent cableconnections or electromagnetic noise frompower semiconductor switches or radiotransmissions nearby. The time display showsthis better. The bane of vibrationmeasurements is that we are dealing withextremely low-level AC signals that are easilycontaminated in machine-room environments.As an option, consider measuringphase also at 1x-rpm to visualize how themachine is shaking. Phase at any otherfrequency is undefined. This is akin to doingmodal analysis in-situ.A final method, to protect you, theanalyst, is to repeat the survey at a later time,perhaps the next day. Never condemn amachine on a single reading. Machinevibration is always changing with load,sometimes transient, and sometimes I make amistake in instrument setup. Better yet, have acolleague repeat the vibration survey with aseparate measurement system. It is a certaintythat the data will be attacked if it represents aFigure 3. Intermittent Electrical Connectionfinancial loss to someone, or anembarrassment. Beware of attempts to “shoot the messenger.” It is always a healthy attitude to be suspicious ofyour own measurements, but at some point we must accept it as valid and proceed on. The repeat measurementsprovide this additional level of confidence.Page 6
Analysis of
A Brief Tutorial on Machine Vibration by Victor Wowk, P.E. Machine Dynamics, Inc. The purpose of this tutorial is to provide sufficient knowledge to understand machine vibration diagnosis. You may be tasked with solving a vibration problem, or you may be overseeing someone else and you need to understand the process. This tutorial discusses the symptoms, taking measurements, analyzing the


![Unreal Engine 4 Tutorial Blueprint Tutorial [1] Basic .](/img/5/ue4-blueprints-tutorial-2018.jpg)