Transcription
A new high-frequency impedance tube for measuring soundabsorption coefficient and sound transmission lossMasateru KIMURA1; Jason KUNIO INCE Bd. Cert.2; Andreas SCHUHMACHER3, Yunseon RYU4123,4Brüel & Kjær Japan, JapanBrüel & Kjær North America, USABrüel & Kjær Sound & Vibration Measurement, DenmarkABSTRACTA high-frequency Impedance Tube (HF Tube) that can measure acoustic performance (sound absorptioncoefficient and sound transmission loss) up to 12.8 kHz was developed. This frequency range has becomeimportant due to trends in the automotive and cell phone industry. The trend toward more electric andhybrid vehicles has brought about new noise sources and challenges. One in particular is electrical invertornoise in the 10 kHz range, which is one of the dominant noise sources in these vehicles. In cell phone andsmart phone applications, the trend is to improve telephone speech quality. High frequency audible noisehas a major influence on perceived quality. Previously, conventional impedance tubes (for example the Brueland Kjaer Type 4206) could not evaluate acoustic performance in the frequency range of 8 10 kHz. Theusable frequency range of the standard tube was limited to 6.4 kHz based on the microphone spacing andtube diameter. Therefore, based on ASTM E1050/ISO 10534-2 standard (for sound absorption coefficient)and ASTM E2611 standard (for sound transmission loss), a newly developed HF Tube allows formeasurements of acoustic performance up to 12.8 kHz. The tube was designed with a 15 mm inner diameterand 11.9 mm microphone spacing. It was designed to use Brüel & Kjær's 1/4 inch microphones and preamplifiers, Type 4187/2670, from the conventional impedance tubes. In this paper, the HF Tube was verifiedby measurements an air cavity (empty tube) and some acoustic absorber materials with the results comparedwith the conventional impedance tubes.Keywords: Impedance Tube, Absorption, Transmission I-INCE Classification of Subjects Number(s): 72.71. INTRODUCTIONRecently, demand for control of high frequency noise has been increasing. For example, ElectricVehicles (EV) and Hybrid Vehicles (HV) are becoming popular in the automotive industry. Inverternoise around 10 kHz that does not occur in a conventional automobile has become a new noise problem.Additionally, the noise in the frequency range above 5 kHz has become one of the important issuesfor cell phones and smartphones. This frequency range affects sound quality during a call andvarious remedies have already been taken in small devices to improve the perceived quality.Oneof the more popular remedies is the use of strategically placed acoustic materials.One of the ways to characterize acoustic materials used for noise control is the measurement of thenormal incidence sound absorption coefficient (SAC) and sound transmission loss (STL) . Thesemeasurements can easily be performed using an impedance tube. One of the big advantages in usingthe impedance tube measurement system is that it can measure SACs and STLs using a small testsample (general less than 100mm) of acoustic material. It can also be used to calculate additionalacoustic properties (characteristic impedances, propagation wavenumbers, etc.) of porous materials.To observe acoustic properties around 8 10 kHz using the tube, a smaller diameter tube withsmaller microphone spacing is required. However, it is difficult to increase the maximum omInter-noise 2014Page 1 of 10
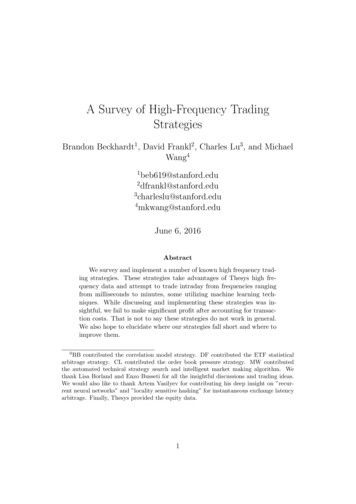
Page 2 of 10Inter-noise 2014in conventional designs because with the smaller diameter of the tube comes an increase in theattenuation of the air and the minimum microphone spacing is limited by physical size of themicrophone holders.In this study, a new high-frequency impedance tube (HF Tube) was developed by redesigning themicrophone holder to allow smaller microphone spacing and by using a high frequency loudspeakerwhich can provide sufficient acoustic excitation to 12.8kHz. The performance of the HF tube wasverified by measuring an air cavity (zero absorption and zero transmission) and some commonacoustic materials then comparing the results with the conventional tubes.2. IMPEDANCE TUBE TEST FOR MEASURING ACOUSTIC PROPERTYTo measure specific impedances, sound absorption coefficients (SACs), sound transmission losses(STLs) and acoustic properties (characteristic impedances, propagation wavenumbers, effectivedensities, bulk moduli) of acoustic materials in normal incidence condition , an impedance tube iscommonly used.For measuring specific impedances and SACs, the two microphone transfer function method usingan impedance tube is shown in Figure 1. This commonly-used measurement technique is specifiedin ISO 10534-2 standard[1] and ASTM E1050 standard[2]. In this method, the frequency responsefunction between the sound pressure at Mic. 2 (shown in Figure 1) and the sound pressure at Mic. 1(H 21) is measured, and the sound reflection coefficient (R) is calculated using H21 byR H 21 e jks 2 jk l s ,ee jks H 21(1)From the calculation of the reflection coefficient we can now calculate additional material properties,such as the specific impedance ratio (Z/ c) and the SAC ( ) using R by:Z 1 R, c 1 R 1 R2(2).(3)Where is the density of air, c is the speed of sound in air, k is the wave number of air, l is the distancebetween Mic. 2 and the front of the sample, and s is the spacing between the microphones.Mic.1Mic.2slFigure 1 – Setup for the Impedance tube for SAC measurementFor calculating the normal incidence STL, a transfer matrix method using a modified fourmicrophone impedance tube is used as shown in Figure 2. This method is specified in the ASTME2611 standard [3]. In this method, the 2x2 transfer matrix of the sample,T TT 11 12 , T21 T22 Page 2 of 10(4)Inter-noise 2014
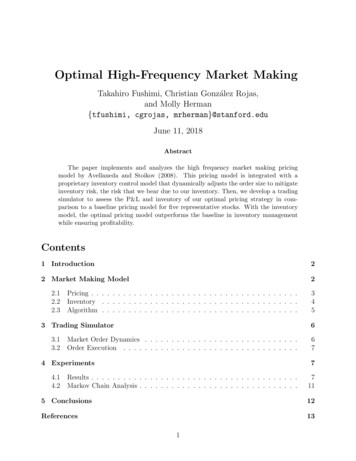
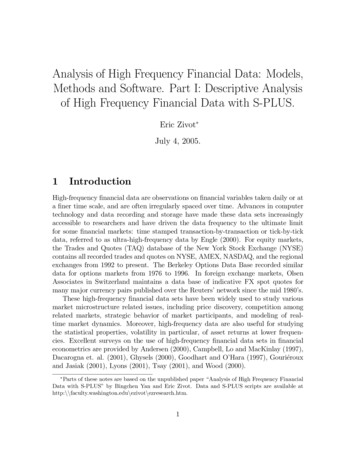
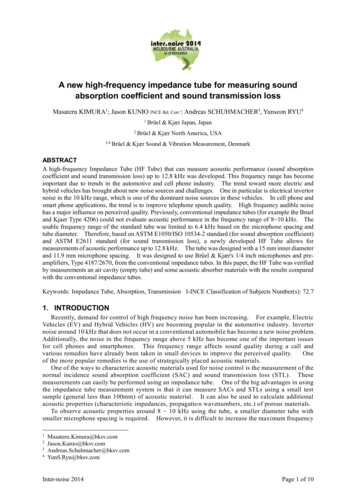
Inter-noise 2014Page 3 of 10is identified from the measurement of the sound pressures and the calculated particle velocities on thefront and back surfaces of the sample[4] based on the measurement of the sound pressures at the fourmicrophone locations. The normal incidence transmission loss (TL n ) and the other acousticproperties (characteristic impedances Zp , propagation wavenumbers kp , etc.) are also calculated usingthe transfer matrix T:TLn 20 log 10T11 T12 c cT21 T22,2e jkdZp kp (5)T12,T21(6)1cos 1 T11 .d(7)Where d is the thickness of the sample.1 2Samplex1 x20d3 4Terminationx3 x4xFigure 2 – Setup for the Impedance tube for STL measurement3. HIGH FREQUENCY IMPEDANCE TUBEA high frequency impedance tube (HF tube) was developed for the purpose of measuring acousticproperties around 8k 10 kHz. The unique features of the HF tube are as follows: Capable of measuring up to 12.8 kHz with a narrowband FFT, in conjunction with the Brüel& Kjær PULSE system, Type 7770 and 7758 software and Type 3160 LAN Xi module.Possible to re-use 1/4 inch microphones and pre-amplifiers, Type 4187/2670 designed for Brüel& Kjær Type 4206 impedance tube5011.930 15.0Source200SampleRigid Plate(3a) Outline drawing(3b) PictureFigures 3a and 3b – Setup of the High frequency impedance tube for absorption meaurementInter-noise 2014Page 3 of 10
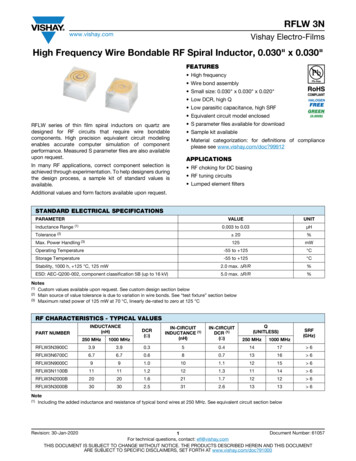
Page 4 of 10Inter-noise 20145023011.9 15.03011.9SampleRigid PlateSource(4a) Outline drawing (hard wall termination)(4b) PictureFigures 4a and 4b – Setup of the High frequency impedance tube for transmission lossmeasurementTable 1 – Specification of High-Frequency Impedance Tube (d is thickness of sample [mm])SAC setupSTL setup1.0 kHz (for ASTM E1050)Lower Frequency1.0 kHz (for ASTM E2611)1.5 kHz (for ISO 10534-2)Upper Frequency12.8 kHz12.8 kHzInner Diameter15.0 mm15.0 mmDistance from source to Mic.150.0 mm50.0 mmDistance from Mic.1 to Mic.211.9 mm11.9 mm30.0 mm(230.0 – d) mm---(30.0 d) mm---11.9 mmDistance from Mic.2 to frontsurface of sampleDistance from front surface ofsample to Mic.3Distance from Mic.3 to Mic.44. VALIDATION OF SOUND ABSORPTION COEFFICIENT MEASUREMENTSSETUPIn this section, performance of the HF tube is verified by measuring an air cavity (zero absorption)and some commonly used acoustic materials then comparing the impedance ratio and the soundabsorption coefficient results with the conventional tube.4.1 Validation by measuring specific impedance of air cavityTo validate the performance of the HF tube, specific impedance ratios of three thicknesses of aircavities (5 mm, 25 mm and 50 mm) were measured, and the imaginary part of the impedance ratioswere compared with the theoretical value of an air cavity with thickness d [5]:Page 4 of 10Inter-noise 2014
Inter-noise 2014Page 5 of 10 Z Im cot kd Z0 46810Frequency [kHz]1225TheoreticalMeasured20Specific Impedance Ratio25Specific Impedance RatioSpecific Impedance RatioThe imaginary part of the theoretical and measured specific impedance ratios of the air cavities areshown in Figure 5. In the case of the 5 mm air cavity (Figure 5a), both values are in good agreement.Also, in the cases of the 25 mm and 50 mm air cavities (Figure 5b, 5c), several divergences of cot(kd)at kd n (n is integer value) are observed. Other than the slight frequency shift and additionalattenuation in the measured data both values are in good alMeasured-20-25-250246810Frequency [kHz]012246810Frequency [kHz]12(5a) 5 mm Air(5b) 25 mm Air(5c) 50 mm AirFigures 5a, 5b and 5c – Comparison of the theoretical and measured specific impedance ratios of aircavitiesAdditionally, measured SACs are compared with theoretical SACs with consideration of the tubeattenuation in reference [6]. Note that theoretical SACs, were calculated using the complex wavenumber k' with respect to the tube attenuation:k k jk ,(9)instead of the wave number k 2 f / c (where f is frequency and c is speed of sound in air).term k″ is called the attenuation constant and A is a constant:k A fcdThe(10).For the purposes of this paper A 0.02203, which is defined in the ASTM E1050 standard [2], wasused.To compare with k″ calculated by equation (10), k was calculated by Utsuno’s 2 Cavity method [7].In this method, characteristic impedance Zp and propagation constant jk p are calculated usingspecific impedance Z 1 of front and back surface of the “sample” and Z 2 -j ccot(kd) for the two backcavity conditions using the cavity thicknesses d (a) and d (b) .Z p cZ c c Z1 a Z1 b Z 2 a Z 2 b Z 2 a Z 2 b Z1 a Z1 b Z 2 a Z 2 b Z1 a Z1 b jk p k p jk p 1 Z1 Z c Z 2 Z c .ln 2d Z1 Z c Z 2 Z c .(11)(12)Figure 6 shows the attenuation constant k″ of a 25 mm thick air cavity calculated using the 2 cavitymethod. The specific impedance ratio of 25 mm and 50 mm thicknesses of air (which assumed 0mm and 25 mm thick back cavities respectively with a 25 mm thick front air cavity ”sample”), arecompared with k″ calculated from equation (10).Inter-noise 2014Page 5 of 10
Page 6 of 10Inter-noise 2014Attenuation Constant [Np/m]10Equation (10)HF Tube (SLR)HF Tube (Meas)500246810Frequency [kHz]12Figures 6 – Comparison of the theoretical and measured attenuation coefficient of 25 mmthickness air cavities. SLR is a linear regression of the measured dataThe theoretical and measured SACs of the air cavities are shown in Figure 7. The measuredattenuation coefficient and SACs are larger than the theoretical SACs. We can attribute thedifferences in the measured and predicted results to the attenuation of actual tube being larger thanthe predicted values. The phase match of the measurement system can also add error to the resultsespecially for a sample with very low absorption such as the air cavity. It has been shown that theprocedures recommended by the standards [2,3], though adequate when the specimen has highabsorption, are insufficient when measuring small sound absorption ncy [kHz]12Sound Absorption CoefficientTheoreticalMeasuredSound Absorption CoefficientSound Absorption .40.30.20.100246810Frequency [kHz]120246810Frequency [kHz]12(7a) 5 mm Air(7b) 25 mm Air(7c) 50 mm AirFigures 7a, 7b and 7c – Comparison of the theoretical and measured sound absorption coefficient of aircavities4.2 Validation by comparing results of conventional tubeTo validate the accuracy of HF tube, specific impedance ratios and SACs were measured andcompared using the same materials in both the HF tube and the small Brüel & Kjær Type 4206impedance tube. The standard small tube has a 29 mm diameter with a 20 mm microphone spacinggiving an upper useable frequency of 6.4 kHz.Measurement results of thin recycled felt and the 25 mm thick polyurethane foam, which isprovided as the calibration sample of the Brüel & Kjær Type 4206, are shown in Figures 8 and 9.Page 6 of 10Inter-noise 2014
Inter-noise 2014Page 7 of 101Sound Absorption CoefficientSpecific Impedance Ratio5Real0Imaginary-5-10B&K 4206 SmallHF Tube-15B&K 4206 SmallHF Tube0.90.80.70.60.50.40.30.20.100246810Frequency [kHz]120246810Frequency [kHz]12(8a) Image of samples (Left:(8b) Specific Impedance(8c) Sound Absorptionfor Brüel & Kjær 4206 smallRatiosCoefficientstube, Right: for HF tube)Figures 8a, 8b and 8c – Comparison of acoustic properties of recycled felt1Real50Imaginary-5B&K 4206 SmallHF Tube-10Sound Absorption CoefficientSpecific Impedance Ratio10B&K 4206 SmallHF Tube0.90.80.70.60.50.40.30.20.100246810Frequency [kHz]120246810Frequency [kHz]12(9a) Image of samples (Left:(9b) Specific Impedance(9c) Sound Absorptionfor Brüel & Kjær 4206 smallRatiosCoefficientstube, Right: for HF tube)Figure 9a, 9b and 9c – Comparison of acoustic properties of polyurethane foamA more rigorous examination of the variability in the measured results can be achieved throughexamination
Therefore, based on ASTM E1050/ISO 10534-2 standard (for sound absorption coefficient) and ASTM E2611 standard (for sound transmission loss), a newly developed HF Tube allows for measurements of acoustic performance up to 12.8 kHz. The tube was designed with a 15 mm inner diameter and 11.9 mm microphone spacing. It was designed to use Brüel & Kjær's 1/4 inch microphones and pre- amplifiers .