Transcription
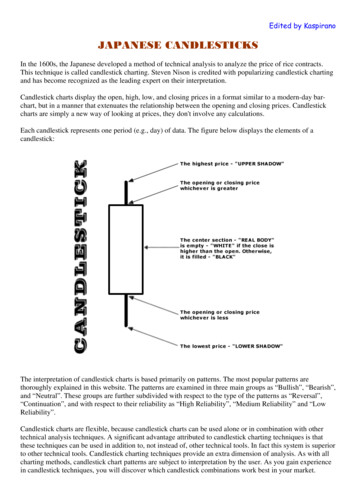
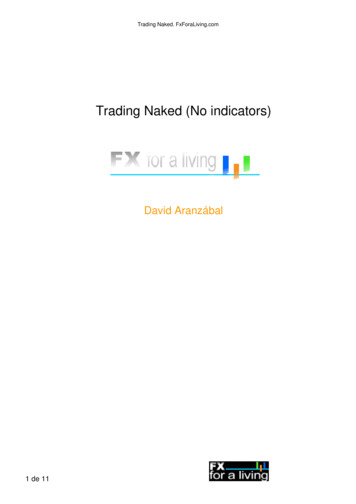
Traders Dynamic IndicatorTDIA great indicator for naked trading , canyou notice something about this pic to dowith naked trading ?
Ok well I will give you another clueHave you got it yet ? 1 peak to anotherpeak,
What they look like togetherGet in 1st leg of W get out 2nd leg of M onthe TDI simplesWell not quite lets go through Tdi fromthe start.
BasicsTraders Dynamic IndexA hybrid indicator developed toindicate market conditions relatedto trend direction, momentum, andmarket volatility.An “all-in-one” indicator!
Traders Dynamic IndexStep 1: RSI Price LineStep LineRules: Trade Longwhen RSI PL isabove 50.Trade Short whenRSI PL is below 50.Consider exit when RSIPL is 68 or 32.
Step 2:Trade Signal LineRules:Trade Long when RSI PL TSL.Trade Short when RSI PL TSL.Exit trade when RSI PL& TSL crossover.Now this is gettingclose .
Step 3:Market Base LineRules:Market Base Line actsas Overall Trend.Trade Long whenRSI PL is MBL.Trade Short when RSI PLis MBL.
Market Base Lineforecasts MarketReversals
Step 4:Volatility BandsRules:Scaling InAdd to a Long tradewhen RSI PL is VB.Add to a Short tradewhen RSI PL is VB.Consider exit when RSI PLcrosses back over VB.
TradersDynamicIndex (TDI) Long entry RSI PL 50, TSL, and MBL. Consider adding to Long trade if RSI PL theupper Volatility Band and 50, but 68. Avoid entering a Long trade when RSI PL theupper Volatility Band, 50, and 68. Short entry RSI PL 50, TSL, and MBL. Consider adding to Short trade if RSI PL thelower Volatility Band and 50, but 68. Avoid entering a Short trade when RSI PL thelower Volatility Band, 50, and 68.
TDIW M FormationsYes tdi also forms W M formations andsometimes when the market does not as wetalked about in the 1st slide
As you can see there is another small W after theM to enter long again.
Head and Shoulders
DivergenceA great way to know if your trade is right is Tdidivergence
TrendThis is probably one of the most important partsand beneficial parts of TDIKnowing what the trend is and what direction?The trend can be found 1 timeframe higher thanthe one your trading ie.The 15 min trend will be found on the 1hr and the4hr trend can be found on D1 and so on,on the crosses of RSI PL and TSL .Although this will get you the majority of themove this does not nessesarily mean the trend isover or has started as the signal lags .Its only an indicator after all .The pattern and the pins rrt m and w and h s arestill the main way to determine entries and exits.This is just to guide you.
D1The green circled 4HR chartThe MM Trend on the 4hr between the crosses ofthe D1
More examples of TrendUsd/chf D1Also note the 3 levels in TDI marked in red.As you can see here the entry and exit are earlyand late so thats why you need the pattern ,then use this for conformation .
4hr looks like thisThe 2 red lines are the crosses on D1 as you cansee their early and late but as you can see TDI isspot on in this example in hindsight LOLSo lets now try and do this step by step
Step 1 identify the pattern lets say the 15minbecause thats where I like to trade,So what happened yesterday and where are wein the cycle.On the 1 hr looks like thisRSI PL crosses the TSL but never crossed back!
What happened the next dayThat looks like a giant H&S pattern price must begoing down today ?Wait what patten is that I see on TDI ?W
Ok I got in on the W up about 20 pips now holdon is that a M I see now on Tdi will I exit ?Hold on how many pushes up has it goneI only see 2 will I exit ?Whats it look like on the 1 hrOk there are definitely 2 pushes up 2 greencandles but it still looks like a h&s pattern butTDI PL has not crossed TSL yet just wait andsee if there is 1 more push left
Ok thats more like it but it still hasn t brokeprevious high and TDI PL has crossed up againBingo looks like 3 levels now will I get out checkthe 1hr and see
Yeah looks good is this the H&S pattern NowHmmmm wait TDI PL has just crossed theMarket BASE line and hasn t crossed TSLdoesn t that mean buy ?
Well in a word yesHere is the whole move from W 3 levels to M justtaking out yesterdays high .so what did it look like on 1 hrTheir you go from cross to cross60 pips but using the pattern in conjuntion withcrosses at least 100
Ok happy trading .OH just one more thing I have discovered theultimate market signalJust use this indicator on the next page and youwill never fail !
with naked trading ? Ok well I will give you another clue Have you got it yet ? 1 peak to another peak, What they look like together Get in 1st leg of W get out 2nd leg of M on the TDI simples Well not quite lets go through Tdi from the start. Basics Traders Dynamic Index A hybrid indicator developed to indicate market conditions related to trend direction, momentum, and market volatility. An .File Size: 842KBPage Count: 26