Transcription
Decision Trees for AnalyticsUsing SAS Enterprise Miner Barry de Ville and Padraic NevilledeVille, Barry, and Padraic Neville. Decision Trees for Analytics Using SAS Enterprise Miner . Copyright 2013, SAS Institute Inc.,Cary, North Carolina, USA. ALL RIGHTS RESERVED. For additional SAS resources, visit support.sas.com/bookstore.
ContentsPreface . ixAbout This Book . xiAbout These Authors . xvAcknowledgments . xviiChapter 1: Decision Trees—What Are They?. 1Introduction . 1Using Decision Trees with Other Modeling Approaches . 4Why Are Decision Trees So Useful? . 6Level of Measurement . 9Chapter 2: Descriptive, Predictive, and Explanatory Analyses . 15Introduction .The Importance of Showing Context .Antecedents .Intervening Factors .A Classic Study and Illustration of the Need to Understand Context .The Effect of Context .How Do Misleading Results Appear?.Automatic Interaction Detection .The Role of Validation and Statistics in Growing Decision Trees .The Application of Statistical Knowledge to Growing Decision Trees .Significance Tests .Validation to Determine Tree Size and Quality .What Is Validation? .Pruning .1617181919212224283030343538deVille, Barry, and Padraic Neville. Decision Trees for Analytics Using SAS Enterprise Miner . Copyright 2013, SAS Institute Inc.,Cary, North Carolina, USA. ALL RIGHTS RESERVED. For additional SAS resources, visit support.sas.com/bookstore.
vi ContentsMachine Learning, Rule Induction, and Statistical Decision Trees .Rule Induction .Rule Induction and the Work of Ross Quinlan .The Use of Multiple Trees .A Review of the Major Features of Decision Trees .Roots and Trees .Branches .Similarity Measures .Recursive Growth .Shaping the Decision Tree .Deploying Decision Trees .A Brief Review of the SAS Enterprise Miner ARBORETUM Procedure .434448495050505151515152Chapter 3: The Mechanics of Decision Tree Construction . 55The Basics of Decision Trees . 55Step 1—Preprocess the Data for the Decision Tree Growing Engine . 57Step 2—Set the Input and Target Modeling Characteristics . 59Targets . 60Inputs . 61Step 3—Select the Decision Tree Growth Parameters . 64Step 4—Cluster and Process Each Branch-Forming Input Field . 66Clustering Algorithms . 69The Kass Merge-and-Split Heuristic . 76Dealing with Missing Data and Missing Inputs in Decision Trees . 76Step 5—Select the Candidate Decision Tree Branches . 79Step 6—Complete the Form and Content of the Final Decision Tree . 94Switching Targets . 105Example of Multiple Target Selection Using the Home Equity Demonstration Data . 106Synergy, Functionality, and the Wisdom of the End User . 114Chapter 4: Business Intelligence and Decision Trees . 117Introduction . 117A Decision Tree Approach to Cube Construction . 120Multidimensional Cubes and Decision Trees Compared: A Small Business Example . 121Multidimensional Cubes and Decision Trees: A Side-By-Side Comparison . 126The Main Difference between Decision Trees and Multidimensional Cubes . 128Regression as a Business Tool . 128Decision Trees and Regression Compared . 129deVille, Barry, and Padraic Neville. Decision Trees for Analytics Using SAS Enterprise Miner . Copyright 2013, SAS Institute Inc.,Cary, North Carolina, USA. ALL RIGHTS RESERVED. For additional SAS resources, visit support.sas.com/bookstore.
Contents viiMultidimensional Analysis with Trees . 134An Example with Multiple Targets . 135Chapter 5: Theoretical Issues in the Decision Tree Growing Process. 145Introduction . 145Crafting the Decision Tree Structure for Insight and Exposition . 146Conceptual Model . 147Predictive Issues: Accuracy, Reliability, Reproducibility, and Performance . 154Choosing the Right Number of Branches . 157Perspectives on Selection Bias . 158Potential Remedies to Variable Selection Bias . 159Multiple Decision Trees . 171Ensembles . 172Chapter 6: The Integration of Decision Trees with Other Data MiningApproaches . 187Introduction . 187Decision Trees in Stratified Regression . 188Time-Ordered Data . 189Decision Trees in Forecasting Applications . 191Decision Trees in Variable Selection . 194Decision Tree Results . 197Interactions . 198Cross-Contributions of Decision Trees and Other Approaches . 199Decision Trees in Analytical Model Development . 200The Use of Decision Trees in Rule Induction . 204Iterative Removal of Observations . 205Conclusion . 216Business Intelligence . 217Data Mining . 217Glossary . 219References . 233Index . 239deVille, Barry, and Padraic Neville. Decision Trees for Analytics Using SAS Enterprise Miner . Copyright 2013, SAS Institute Inc.,Cary, North Carolina, USA. ALL RIGHTS RESERVED. For additional SAS resources, visit support.sas.com/bookstore.
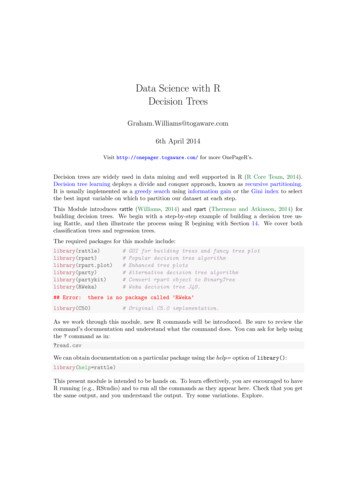
Chapter 1: Decision Trees—What Are They?Introduction . 1Using Decision Trees with Other Modeling Approaches . 4Why Are Decision Trees So Useful? . 6Level of Measurement . 9IntroductionDecision trees are a simple, but powerful form of multiple variable analysis. They provide uniquecapabilities to supplement, complement, and substitute for: traditional statistical forms of analysis (such as multiple linear regression)a variety of data mining tools and techniques (such as neural networks)recently developed multidimensional forms of reporting and analysis found in the field ofbusiness intelligenceDecision trees are produced by algorithms that identify various ways of splitting a data set intobranch-like segments. These segments form an inverted decision tree that originates with a rootnode at the top of the tree. The object of analysis is reflected in this root node as a simple, onedimensional display in the decision tree interface. The name of the field of data that is the object ofanalysis is usually displayed, along with the spread or distribution of the values that are containedin that field. A sample decision tree is illustrated in Figure 1.1, which shows that the decision treecan reflect both a continuous and categorical object of analysis. The display of this node reflects allthe data set records, fields, and field values that are found in the object of analysis. The discoveryof the decision rule to form the branches or segments underneath the root node is based on amethod that extracts the relationship between the object of analysis (that serves as the target field inthe data) and one or more fields that serve as input fields to create the branches or segments. Thevalues in the input field are used to estimate the likely value in the target field. The target field isalso called an outcome, response, or dependent field or variable.deVille, Barry, and Padraic Neville. Decision Trees for Analytics Using SAS Enterprise Miner . Copyright 2013, SAS Institute Inc.,Cary, North Carolina, USA. ALL RIGHTS RESERVED. For additional SAS resources, visit support.sas.com/bookstore.
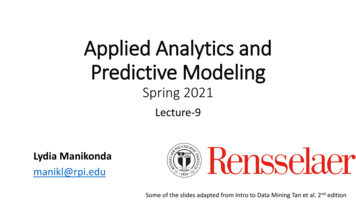
2 Decision Trees for Analytics Using SAS Enterprise MinerThe general form of this modeling approach is illustrated in Figure 1.1. Once the relationship isextracted, then one or more decision rules that describe the relationships between inputs and targetscan be derived. Rules can be selected and used to display the decision tree, which provides a meansto visually examine and describe the tree-like network of relationships that characterize the inputand target values. Decision rules can predict the values of new or unseen observations that containvalues for the inputs, but that might not contain values for the targets.Figure 1.1: Illustration of the Decision TreeEach rule assigns a record or observation from the data set to a node in a branch or segment basedon the value of one of the fields or columns in the data set.1 Fields or columns that are used tocreate the rule are called inputs. Splitting rules are applied one after another, resulting in ahierarchy of branches within branches that produces the characteristic inverted decision tree form.The nested hierarchy of branches is called a decision tree, and each segment or branch is called anode. A node with all its descendent segments forms an additional segment or a branch of thatnode. The bottom nodes of the decision tree are called leaves (or terminal nodes). For each leaf, thedeVille, Barry, and Padraic Neville. Decision Trees for Analytics Using SAS Enterprise Miner . Copyright 2013, SAS Institute Inc.,Cary, North Carolina, USA. ALL RIGHTS RESERVED. For additional SAS resources, visit support.sas.com/bookstore.
Chapter 1: Decision Trees—What Are They? 3decision rule provides a unique path for data to enter the class that is defined as the leaf. All nodes,including the bottom leaf nodes, have mutually exclusive assignment rules. As a result, records orobservations from the parent data set can be found in one node only. Once the decision rules havebeen determined, it is possible to use the rules to predict new node values based on new or unseendata. In predictive modeling, the decision rule yields the predicted value.Figure 1.2: Illustration of Decision Tree NomenclatureAlthough decision trees have been in development and use for over 50 years (one of the earliestuses of decision trees was in the study of television broadcasting by Belson in 1956), many newforms of decision trees are evolving that promise to provide exciting new capabilities in the areasof data mining and machine learning in the years to come. For example, one new form of thedecision tree involves the creation of random forests. Random forests are multi-tree committeesthat use randomly drawn samples of data and inputs and reweighting techniques to developmultiple trees that, when combined, provide for stronger prediction and better diagnostics on thestructure of the decision tree.Besides modeling, decision trees can be used to explore and clarify data for dimensional cubes thatare found in business analytics and business intelligence.deVille, Barry, and Padraic Neville. Decision Trees for Analytics Using SAS Enterprise Miner . Copyright 2013, SAS Institute Inc.,Cary, North Carolina, USA. ALL RIGHTS RESERVED. For additional SAS resources, visit support.sas.com/bookstore.
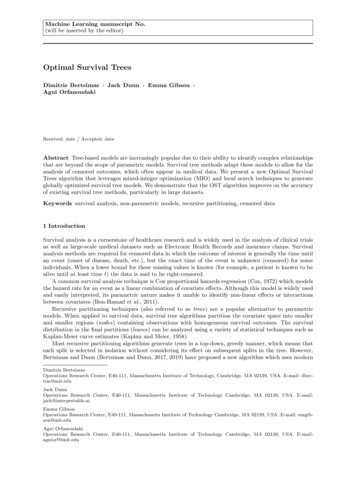
4 Decision Trees for Analytics Using SAS Enterprise MinerUsing Decision Trees with Other Modeling ApproachesDecision trees play well with other modeling approaches, such as regression, and can be used toselect inputs or to create dummy variables representing interaction effects for regression equations.For example, Neville (1998) explains how to use decision trees to create stratified regressionmodels by selecting different slices of the data population for in-depth regression modeling.The essential idea in stratified regression is to recognize that the relationships in the data are notreadily fitted for a constant, linear regression equation. As illustrated in Figure 1.3, a boundary inthe data could suggest a partitioning so that different regression models of different forms can bemore readily fitted in the strata that are formed by establishing this boundary. As Neville (1998)states, decision trees are well suited to identifying regression strata.Figure 1.3: Illustration of the Partitioning of Data Suggesting Stratified Regression ModelingDecision trees are also useful for collapsing a set of categorical values into ranges that are alignedwith the values of a selected target variable or value. This is sometimes called optimal collapsing ofvalues. A typical way of collapsing categorical values together would be to join adjacent categoriestogether. In this way 10 separate categories can be reduced to 5. In some cases, as illustrated inFigure 1.4, this results in a significant reduction in information. Here, categories 1 and 2 areassociated with extremely low and extremely high levels of the target value. In this example, thecollapsed categories 3 and 4, 5 and 6, 7 and 8, and 9 and 10 work better in this type of deterministiccollapsing framework; however, the anomalous outcome produced by collapsing categories 1 and 2together should serve as a strong caution against adopting any such scheme on a regular basis.deVille, Barry, and Padraic Neville. Decision Trees for Analytics Using SAS Enterprise Miner . Copyright 2013, SAS Institute Inc.,Cary, North Carolina, USA. ALL RIGHTS RESERVED. For additional SAS resources, visit support.sas.com/bookstore.
Chapter 1: Decision Trees—What Are They? 5Decision trees produce superior results. The dotted lines show how collapsing the categories withrespect to the levels of the target yields different and better results. If we impose a monotonicrestriction on the collapsing of categories—as we do when we request tree growth on the basis ofordinal predictors—then we see that category 1 becomes a group of its own. Categories 2, 3, and 4join together and point to a relatively high level in the target. Categories 5, 6, and 7 join together topredict the lowest level of the target. And categories 8, 9, and 10 form the final group.If a completely unordered grouping of the categorical codes is requested—as would be the case ifthe input was defined as “nominal”—then the three bins as shown at the bottom of Figure 1.4 mightbe produced. Here, the categories 1, 5, 6, 7, 9, and 10 group together as associated with the highestlevel of the target. The medium target levels produce a grouping of categories 3, 4, and 8. The lonehigh target level that is associated with category 2 falls out as a category of its own.Figure 1.4: Illustration of Forming Nodes by Binning Input-Target RelationshipsdeVille, Barry, and Padraic Neville. Decision Trees for Analytics Using SAS Enterprise Miner . Copyright 2013, SAS Institute Inc.,Cary, North Carolina, USA. ALL RIGHTS RESERVED. For additional SAS resources, visit support.sas.com/bookstore.
6 Decision Trees for Analytics Using SAS Enterprise MinerBecause a decision tree enables you to combine categories that have similar values with respect tothe level of some target value, there is less information loss in collapsing categories together. Thisleads to improved prediction and classification results. As shown in the figure, it is possible tointuitively appreciate that these collapsed categories can be used as branches in a tree. So, knowingthe branch—for example, branch 3 (labeled BIN 3), we are better able to guess or predict the levelof the target. In the case of branch 2, we can see that the target level lies in the mid-range, whereasin the last branch—here collapsed categories 1, 5, 6, 7, 9, 10—the target is relatively low.Why Are Decision Trees So Useful?Decision trees are a form of multiple variable (or multiple effect) analyses. All forms of multiplevariable analyses enable us to predict, explain, describe, or classify an outcome (or target). Anexample of a multiple variable analysis is a probability of sale or the likelihood to respond to amarketing campaign as a result of the combined effects of multiple input variables, factors, ordimensions. This multiple variable analysis capability of decision trees enables you to go beyondsimple one-cause, one-effect relationships and to discover and describe things in the context ofmultiple influences. Multiple variable analysis is particularly important in current problem-solvingbecause almost all critical outcomes that determine success are based on multiple factors. Further,it is becoming increasingly clear that while it is easy to set up one-cause, one-effect relationships inthe form of tables or graphs, this approach can lead to costly and misleading outcomes.According to research in cognitive psychology (Miller 1956; Kahneman, Slovic, and Tversky1982) the ability to conceptually grasp and manipulate multiple chunks of knowledge is limited bythe physical and cognitive processing limitations of the short-term memory portion of the brain.This places a premium on the utilization of dimensional manipulation and presentation techniquesthat are capable of preserving and reflecting high-dimensionality relationships in a readilycomprehensible form so that the relationships can be more easily consumed and applied byhumans.There are many multiple variable techniques available. The appeal of decision trees lies in theirrelative power, ease of use, robustness with a variety of data and levels of measurement, and easeof interpretability. Decision trees are developed and presented incrementally; thus, the combinedset of multiple influences (which are necessary to fully explain the relationship of interest) is acollection of one-cause, one-effect relationships presented in the recursive form of a decision tree.This means that decision trees deal with human short-term memory limitations quite effectivelyand are easier to understand than more complex, multiple variable techniques. Decision trees turnraw data into an increased knowledge and awareness of business, engineering, and scientific issues,and they enable you to deploy that knowledge in a simple but powerful set of human-readablerules.deVille, Barry, and Padraic Neville. Decision Trees for Analytics Using SAS Enterprise Miner . Copyright 2013, SAS Institute Inc.,Cary, North Carolina, USA. ALL RIGHTS RESERVED. For additional SAS resources, visit support.sas.com/bookstore.
Chapter 1: Decision Trees—What Are They? 7Decision trees attempt to find a strong relationship between input values and target values in agroup of observations that form a data set. When a set of input values is identified as having astrong relationship to a target value, all of these values are grouped in a bin that becomes a branchon the decision tree. These groupings are determined by the observed form of the relationshipbetween the bin values and the target. For example, suppose that the target average value differssharply in the three bins that are formed by the input. As shown in Figure 1.4, binning involvestaking each input, determining how the values in the input are related to the target, and, based onthe input-target relationship, depositing inputs with similar values into bins that are formed by therelationship.To visualize this process using the data in Figure 1.4, you see that BIN 1 contains values 1, 5, 6, 7,9, and 10; BIN 2 contains values 3, 4, and 8; and BIN 3 contains value 2. The sort-selectionmechanism can combine values in bins whether or not they are adjacent to one another (e.g., 3, 4,and 8 are in BIN 2, whereas 7 is in BIN 1). When only adjacent values are allowed to combine toform the branches of a decision tree, the underlying form of measurement is assumed tomonotonically increase as the numeric code of the input increases. When non-adjacent values areallowed to combine, the underlying form of measurement is non-monotonic. A wide variety ofdifferent forms of measurement, including linear, nonlinear, and cyclic, can be modeled usingdecision trees.A strong input-target relationship is formed when knowledge of the value of an input improves theability to predict the value of the target. A strong relationship helps you understand thecharacteristics of the target. It is normal for this type of relationship to be useful in predicting thevalues of targets. For example, in most animal populations, knowing the height or weight of theindividual improves the ability to predict the gender. In the following display, there are 28observations in the data set. There are 20 males and 8 females.deVille, Barry, and Padraic Neville. Decision Trees for Analytics Using SAS Enterprise Miner . Copyright 2013, SAS Institute Inc.,Cary, North Carolina, USA. ALL RIGHTS RESERVED. For additional SAS resources, visit support.sas.com/bookstore.
8 Decision Trees for Analytics Using SAS Enterprise MinerTable 1.1: Age, Height, and Gender RelationshipsdeVille, Barry, and Padraic Neville. Decision Trees for Analytics Using SAS Enterprise Miner . Copyright 2013, SAS Institute Inc.,Cary, North Carolina, USA. ALL RIGHTS RESERVED. For additional SAS resources, visit support.sas.com/bookstore.
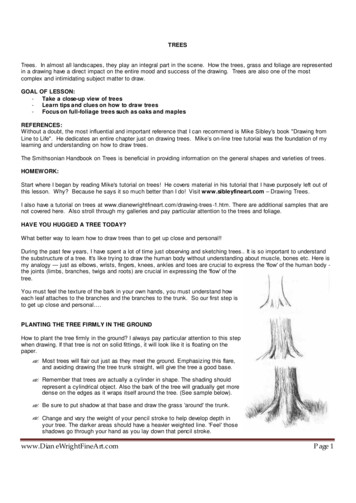
Chapter 1: Decision Trees—What Are They? 9In this display, the overall average height is 5’6 and the overall average weight is 183. Among males,the average height is 5’7, while among females, the average height is 5’3 (males weigh 200 onaverage, versus 155 for females).Knowing the gender puts us in a better position to predict the height and weight of the individuals,and knowing the relationship between gender and height and weight puts us in a better position tounderstand the characteristics of the target. Based on the relationship between height and weightand gender, you can infer that females are both smaller and lighter than males. As a result, you cansee how this sort of knowledge that is based on gender can be used to determine the height andweight of unseen humans.From the display, you can construct a branch with three leaves to illustrate how decision trees areformed by grouping input values based on their relationship to the target.Figure 1.5: Illustration of Decision Tree Partitioning of Physical MeasurementsLevel of MeasurementThe example shown here illustrates an important characteristic of decision trees: both quantitativeand qualitative data can be accommodated in decision tree construction. Quantitative data, likeheight and weight, refers to quantities that can be manipulated with arithmetic operations such asaddition, subtraction, and multiplication. Qualitative data, such as gender, cannot be used inarithmetic operations, but can be presented in tables or decision trees. In the previous example, thetarget field is weight and is presented as an average. Height, BMIndex, or BodyType could havebeen used as inputs to form the decision tree.deVille, Barry, and Padraic Neville. Decision Trees for Analytics Using SAS Enterprise Miner . Copyright 2013, SAS Institute Inc.,Cary, North Carolina, USA. ALL RIGHTS RESERVED. For additional SAS resources, visit support.sas.com/bookstore.
10 Decision Trees for Analytics Using SAS Enterprise MinerSome data, such as shoe size, behaves like both qualitative and quantitative data. For example, youmight not be able to do meaningful arithmetic with shoe size, even though the sequence of numbersin shoe sizes is in an observable order. For example, with shoe size, size 10 is larger than size 9, butit is not twice as large as size 5.Figure 1.6 displays a decision tree developed with a categorical target variable. This figure showsthe general, tree-like characteristics of a decision tree and illustrates how decision trees displaymultiple relationships—one branch at a time. In subsequent figures, decision trees are shown withcontinuous or numeric fields as targets. This shows how decision trees are easily developed usingtargets and inputs that are both qualitative (categorical data) and quantitative (continuous, numericdata).Figure 1.6: Illustration of a Decision Tree with a Categorical TargetThe decision tree in Figure 1.6 displays the results of a mail-in customer survey conducted byHomeStuff, a national home goods retailer.
2 Decision Trees for Analytics Using SAS Enterprise Miner The general form of this modeling approach is illustrated in Figure 1.1. Once the relationship is extracted, then one or more decision rules that describe the relationships between inputs and targets can be derived. Rules can be selected and used to display the decision tree, which .